


How Financial Reality Is Hidden By Commonly Used Theory & Jargon
by Daniel R. Amerman, CFA
Below is the 2nd half of this article, and it begins where the 1st half which is carried on other websites left off. If you would prefer to read (or link) the article in single page form, the private one page version for subscribers can be found here:
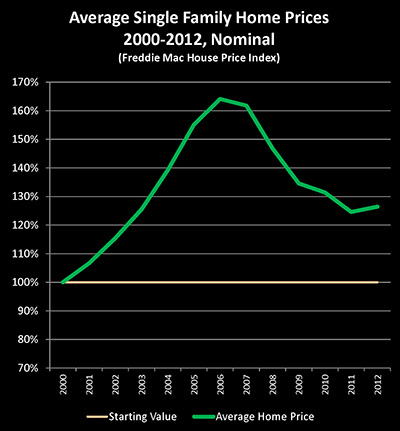
Now, let's take a look at what happened in the real estate market in the United States between the end of the year 2000 and the end of 2012. Between the end of the year 2000 and the end of 2006, the average single-family home in the United States rose by 64%, according to the Freddie Mac House Price Index (the green line). And as we all know, there was a sharp plunge in values with the collapse of the real estate bubble. However, as we can easily see, the plunge isn't as bad as it looks because the average house is still worth 26% more by the end of 2012 than it was in 2000.
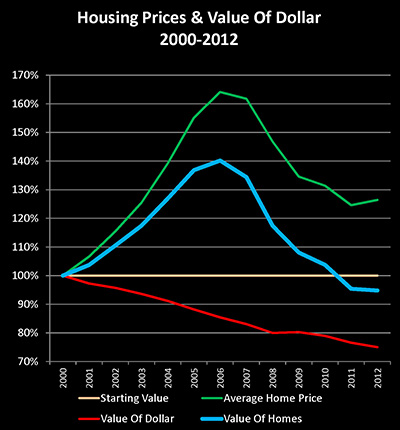
Until we adjust for the value of the US dollar falling by 25% in purchasing power terms between the end of 2000 and the end of 2012 (the red line). And when we adjust for inflation, we get a radically different picture of what has happened with the real estate market in the United States over the last 12 years (the blue line). The average real value of a home never rose by 64%, but rather by only 40%.
In purchasing power terms, the average US home is in fact worth 5% less than it was 12 years ago. In the real world then, when we look at the entire single-family housing market, what we are seeing is simultaneous asset deflation and price inflation.
Since the year 2000, a nationally average 5% destruction in the real value of our homes has been masked by a 25% destruction of the value of our money.
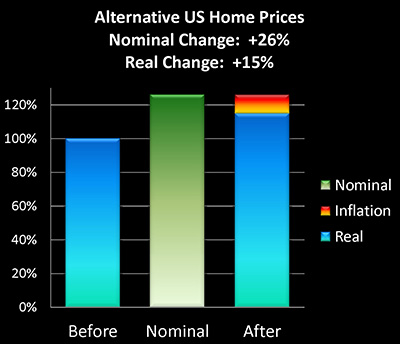
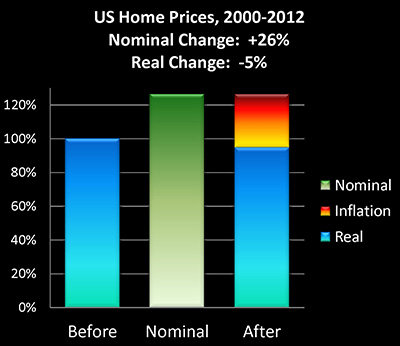
And if we take the usual approach of assuming it must be either inflation or deflation, then we can't tell the difference between a real 5% loss (real asset deflation, that is) or 26% nominal asset inflation, or 15% real asset inflation as shown above, or real 30% asset deflation as shown below:
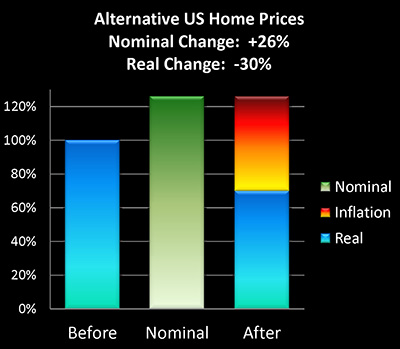
By restricting our choices to either inflation or deflation, but not allowing it to be both – we lose the ability to see reality all together.
So in the real world then, we've experienced simultaneous asset deflation and monetary inflation in the two largest asset markets in the United States – the two largest components of net worth for most households – for the last 12 years.
Is this an anomaly?
To answer that, we must go back in time to another period when the US economy was deeply troubled and struggling with issues of both high unemployment and slow growth – that being the early 1970s to the early 1980s.
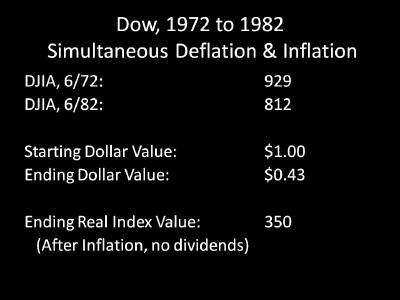
The Dow Jones Industrial Average stood at 929 in June of 1972 – and was 812 by June of 1982, ten years later. Now as you may recall, this ten year period also had the greatest bout of inflation that the US experienced in the 20th Century. The dollar fell in value by 57% in the space of ten years. When we take our ending DJIA number of 812, and adjust for a dollar only being worth 43 cents – the real value of the index was only 350. In purchasing power terms, what our investments will buy for us – the Dow had fallen by almost two thirds.
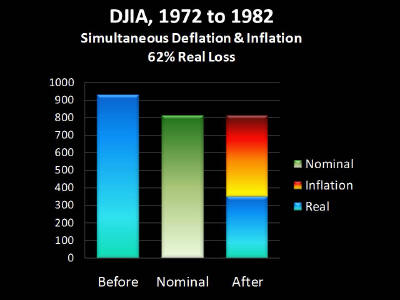
Let me rephrase: the single largest bout of asset deflation in the US since the Great Depression occurred SIMULTANEOUSLY with the single largest destruction of the value of the US dollar in modern history. Asset values fell 62% in real terms, even as money was simultaneously losing 57% of its value.
However, if you are relying on the Econ 101 definition of inflation – you will be blind to this. All you will see is a case of quite mild asset deflation. Which means you will be completely confused. In thinking (as even most commentators do,) that it is EITHER inflation OR deflation, you might quite mistakenly believe that falling asset prices provide at least temporary protection for your money. And this all-too-common theoretical mistake could be deadly for the real world value of many millions of people's savings, as well as their real world standard of living over the coming decades.
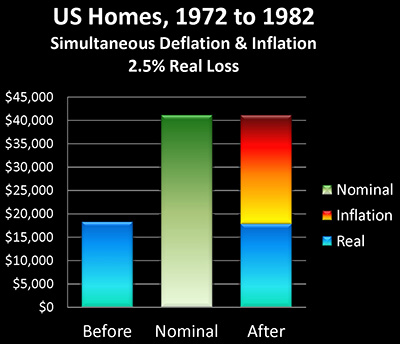
Now how about housing during those same difficult years? In June 1972, the average US home was worth a little over $18,000, and by June 1982 this had increased to a little over $41,000. So the average US home more than doubled in value in a 10 year period, and if you talk to many people who were homeowners during this time, they would tell you their homes were one of the best investments they had ever made.
Until, of course – and this may be sounding a little repetitive, but let me suggest that there is extraordinary value in being able to see that repetition – we adjust for inflation and the 57% destruction of the purchasing power of the dollar. And then we find that in inflation-adjusted terms, the average home actually lost 2.5% of its value over those 10 years, and about $23,000 of our national average $41,000 home value in 1982 was never a gain in real value, but instead actually represented inflation and the destruction of the purchasing power of the US dollar.
So let's put this all together. We have two of the largest markets in the United States – two of the largest components of net worth – with those being the collective value of homes in the United States and the collective value of stock portfolios. We're looking at two long term periods when the economy was stressed, during the years from 1972 until 1982, and from 2000 to 2012. In other words, 22 out of the last 40 years.
For stocks, from 1972 to 1982 and from 2000 to 2012 – we had asset deflation and losses in the value of stocks that were mostly or entirely masked by inflation and the destruction of the value of money.
For homes, from 1972 to 1982 and from 2000 to 2012 – we had asset deflation and a decline in the value of the average single family home that was entirely masked by inflation and the destruction of the value of money.
So for more than half of the last four decades, in the largest markets in the United States, we have had simultaneous asset deflation and money inflation. The decline in the value of assets has been largely offset by the decline in the value of money, and an illusion has been created for the nation. An illusion that cannot be pierced with the Econ 101 definition of inflation, and a reality that can neither be visualized nor anticipated properly when we restrict ourselves to that all-too-common perspective of it being either inflation or deflation, but not both simultaneously.
What recent history shows us is that when it comes to times of economic stress, it is indeed the norm for both inflation and deflation to occur simultaneously, because the destruction of the value of our assets in no way shields us from the destruction of the value of our money.
Real World Theory & Jargon Price 3: Missed Solutions
In addition to blindness and confusion, there is a third real world price for misleading theory and jargon, and it is the worst of the bunch. It is indeed very difficult for any of us to come out ahead when the value of assets and the value of money are each falling over time.
However, it becomes even more difficult when we can't see what is happening, because we have been taught that it has to be either inflation or deflation.
That said, it's not impossible to come out ahead. As one example, tens of millions of people who were homeowners in the 1970s did indeed genuinely experience a surge in their inflation-adjusted net worth, a surge that made home ownership the single most profitable financial decision of their lifetimes for many middle class families.
Now, if you asked most of these people, they would say that it was their homes that were the great investment. Except as we just reviewed, it wasn't the homes, at least not by themselves – because the homes lost value in inflation-adjusted terms.
Gaining a practical understanding of how wealth is redistributed between people and segments of society in an environment of simultaneous inflation and deflation is absolutely crucial for the decades ahead, but to explore it properly would take far more space than a single article.
But the starting place is adjusting our vision, in order to see with perfect clarity that the question is not simply one of inflation or deflation, but rather whether both inflation and deflation will be seen simultaneously in the future, as has happened so often in the past during stressed economic circumstances.
The next time you see the past or future being discussed as either inflation or deflation, my hope is that you will stop and think to yourself: "but wait a minute, what if it's both?"
If you find yourself doing that, I think you may find that this perspective will benefit you for years to come.