The Stealthy Raid On Our Bank Accounts
Money printing is not the main source of trillions in government spending – it is our bank accounts
* How the Federal government changed the laws in 2006 and 2008, giving Washington and Wall Street unprecedented back door access to the spending power of our money in the bank.
*The ten little known steps the money takes as it travels from us, to our banks, to the Federal Reserve, to being spent by the U.S. government.
* Follow the dollars between 2008 and 2021, as $4.1 trillion went from our bank deposits to funding the national debt (while also rescuing Wall Street).
* Using tools similar to a forensic audit, track the “miracle” money that funded $1.6 trillion of pandemic stimulus checks back to its source – dollars that had been in our own collective bank accounts only weeks before.
Read Chapter One (free)
The Homeowner Wealth Formula
Buying a home with a mortgage is the best investment that the average person will make in their lifetimes, and national statistics show that homeownership is the number one source of net worth for the average middle class family. There is a financial formula that explains why homes have been such a good investment, and “The Homeowner Wealth Formula" uses almost fifty years of national home price information to show what that formula is, as well as how so many millions of households have been able to build so much financial security over the decades.
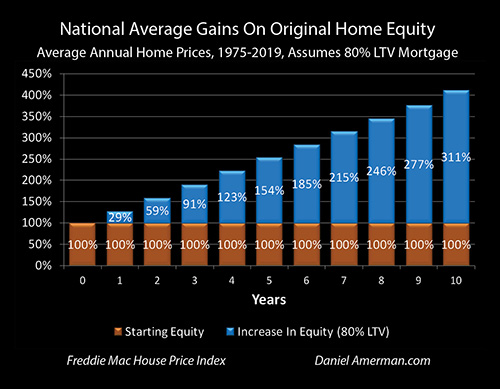
Underneath the surface, homeownership turns inflation into wealth while multiplying the power of the compound interest formula, with an average national result of quadrupling home equity in the first ten years. This first of a kind book gives homeowners and home buyers what they need to know about what has been the single most important and profitable financial decision that many millions of people have made.
Read Chapter One (free) of The Homeowner Wealth Formula, Book #1 of The Home Wealth series.
The Eight Levels Of Homeowner Wealth Multiplication, Chapter One
Winning Lotteries & Profiting From The National Debt
How would you like to buy a ticket in a lottery where there was an almost one in four chance of winning the price of an entire home? What if the consolation prize - the average outcome for buying the ticket - was to quadruple your money in ten years?
Lots of people play the lottery, or gamble in casinos. In theory - each one of those gambles could indeed lead to a quarter million dollar or so gain.
In practice, however, very few people buy winning quarter million dollar lottery tickets, or walk out of a casino with an extra quarter million in their pocket. This is because the odds are extremely low of doing so, most people can play for their entire lives and not win such a large prize. Indeed, because the odds favor the "house", as in the state governments for lotteries, or the owners of the casinos - most people who try for the big wins will steadily lose money over the years instead.
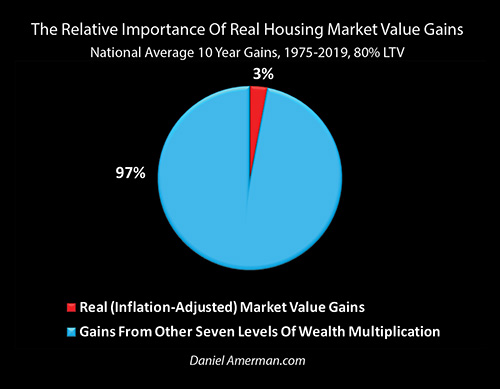
Now, there is a "catch" when it comes to having a really good chance of winning the price of a home – which is that you have to first buy that home. That means you have to comfortably live your life in a nice home, perhaps with a garden in the back yard, and maybe in a good school district as well. And after ten years, what national average homeownership statistics show us is that there is a 23% chance that your home equity will have increased by an amount that is about equal to the entire original purchase price of the home.
Read Chapter One (free) of The Eight Levels Of Homeowner Wealth Multiplication, Book #2 of The Home Wealth series.
Using Gold & Stocks As Contracyclical Assets: A 5,000 To 1 Advantage
Extraordinary stimulus spending by the U.S. government and massive monetary creation and spending by the Federal Reserve may be enough in combination to end the coronavirus recession in the next year or two, and eventually create still higher asset prices for stocks, bonds and homes in a 3rd cycle of the containment of crisis.
But, they may not. If the 3rd round of the containment of crisis fails, then the results of the pandemic and economic lockdowns could include a long and severe recession - or even a depression - and a potential secular (long term) bear market in stocks.
If this were to happen, then history shows that gold has far more valuable uses than if it were just a mere inflation hedge. In this chapter, using six stages of analysis, we will explore a powerful and highly consistent historical relationship between gold and stocks that offers investors the ability to use gold in ways that far exceed the profits produced by just attempting to keep up with inflation.
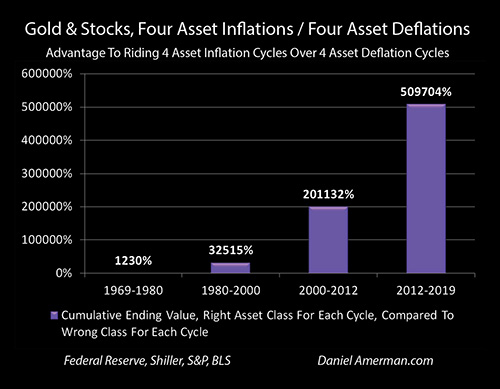
What historical numbers over 50 years show is that if we get another round of a secular bear market in stocks, then those who understand and invest for the contracyclical relationship between stocks and gold can come out 10X or more ahead in net worth over a 10-20 year period, when it comes to price changes on an inflation adjusted basis. For a 20-30 year time period, correctly aligning oneself with the counter-cycles would have historically produced a 100X or more greater increase in net worth, versus having the opposite alignment.
Indeed, if a 30 year old had bought gold in 1969, switched to stocks in 1980, switched to gold in 2000 and switched to stocks in 2012, just those four investment choices - being completely passive all the rest of those years with national average results in each year – then price changes alone would have produced more than a 5,000 to 1 advantage in the money they would have had at age 80 in 2019, compared to if they had made the four opposite choices.
Read More
Recent Analyses
Ongoing articles and commentary about current financial developments are sent directly to subscribers (subscription is free, and is included with the free book). A sampling of some recent articles can be found below.
National Debt Watch February 2025
Read More
Truth Testing Inflation With Reality
Read More
Economic Growth & Real Inflation Rates
Read More
Gasoline Price Pairs And Inflation
Read More
Stubborn Inflation & Zero Percent Real Rates
Read More
First Republic And The Problems With Funding The Fed
Read More
Economic Fragmentation And Dollar Hegemony
Read More
Thinking Through The Unimaginable: America After The Fall Of King Dollar
Read More
Failing Financial Defenses & The Changing Politics Of Money
Read More
Eurodollars And The Other Existential Banking Crisis
Read More
SVB And Collapsing Global Financial Defenses
Read More
An Evidence-Based Look At Inflation, Recessions And Pivots, Part Two
Read More
An Evidence-Based Look At Inflation, Recessions And Pivots
Read More
Fed Forced To Use Negative Liabilities
Read More
The Misleading "Strength" Of The Dollar
Read More
The End Of Abundance (?) & Eight Externalities
Read More
Stagflation & Sequence Of Returns Risks
Read More
Ukraine War Sanctions Double Inflation To 13.9%
Read More
Economists Can't Account For 98% Of Rising Inflation
Read More
Combining Three Distinct Sources Of Inflation
Read More
The Historical Case For A 70% Real Stock Market Loss Over 14 Years
Read More
A 15.4% Annualized Rate Of Inflation
Read More
Rising Inflation, The Taylor Rule, Rational Bubbles & The Fatal Flaw
Read More
Inflation, Stocks & Seeing A 70% Loss
Read More
The Hidden 95% Of The Risk
Read More
Using Our Money To Steal Our Money
Read More
The Money Printing Myth & The Raid On Our Bank Accounts
Read More
The Stealthy Raid On Our Bank Accounts: How The Government Uses Our Bank Accounts To Fund The National Debt
Read Chapter One (free)
Persistence Of High Inflation Reaches 40 Year Record
Read More
Rising Inflation Is Punishing Savers With Deeply Negative Real Interest Rates
Read More
Fed Difficulties In Funding National Debt Grow Worse
Read More
Four Month Inflation Rate Hits 40 Year High
Read More
The Fed Pawns A Trillion Dollars Of The National Debt To Raise Cash
Read More
The Critical Risk Of Simultaneous Inflation & Deflation
Read More
Climate Change & Court-Ordered Inflation
Read More
Current & Future Supply Side Inflation Shocks
Read More
Counterfeiters, Con Men, Mass Illusions & Funding The National Debt
Read More
The Unstable Funding For The National Debt
Read More
The Eight Levels Of Homeowner Wealth Multiplication, Chapter One
Read The Chapter
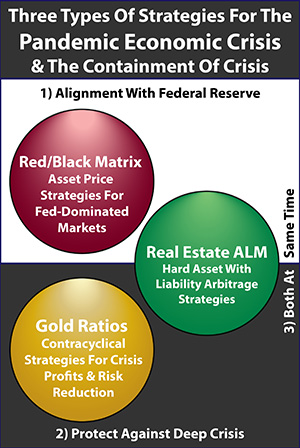
Three Paths For Massive Monetary Creation In A Pandemic World
Read More
Two Centuries Of National Debt In One Year: Putting 2020 In Perspective
Read More
The Homeowner Wealth Formula, Chapter One
Read The Chapter
A Still Strong Signal For A Secular Bull Market In Gold
Read More
Sequence Of Returns Risks - How "Vicious Circles" Can Destroy Financial Security After Retirement
Read More
The Magnitude Of Long Term Profits In A Gold Secular Cycle
Read More
A Strong Signal For A Secular Bull Market In Gold
Read More
The Bizarre Mathematics Of How Negative Interest Rates Create Stratospheric Profits
Read More
Gold & Bonds During A Pandemic - Comparing Two Opposite Sources Of Crisis Profits
Read More
Gold, Stocks & The Pandemic: A Powerful Contracyclical Play In Action
Read More
Federal Reserve Funds 165% Of Record Pandemic Deficit Spending Through Monetary Creation
Read More
The Secret History Of A 70% Market Loss - What A Secular Bear Market In The 2020s Could Look Like
Read More
Stepping Back From The Chaos: The Coronavirus Cycle Of Crisis In Perspective
Read More
A Battle Of Titans: The Coronavirus Versus The Fed
Read More
Using A Contracyclical Rebalancing Hedge For Stocks & Gold To Increase Inflation-Adjusted Returns From Price Changes By 50% While Lowering Risks
Read More
Gold Had A Strong 2019, But The Disconnection From Inflation Continues
Read More
How High Proposed Tax Rates Can Lead To Effective Gold Confiscation (2020 Election Edition)
Read More
The Half Trillion Dollar Crisis With The National Debt - A Near Miss For Retirement Accounts & Home Values
Read More
Government Deficits 100% Funded By Fed Monetary Creation Since September 2019
Read More
Hacking The Economy To Determine An Election: Is It Happening?
Read More
National Debt Forces Potential $634 Billion In Money Creation
Read More
Funding Of U.S. Deficits By Monetary Creation Reaches 90% In Late 2019
Read More
Calculating Your Personal Cost If Stock, Bond & Home Prices Return To Average
Read More
The New Threat To Housing & Stocks From Government Deficits
Read More
How The Red/Black Matrix Performed: Seven 2019 Scenario Results
Read More
The Housing Market In 2006-2007 and 2018-2019: Similarities & Differences
Read More
The Surprising Advantages Of Investing In Gold, A 50 Year Historical Analysis
Read More
Next Recession: The New Risks & New Profits Of A Grand Experiment
Read More
Will Fed Actions Create Dow 40,000 - And Triple Gold Prices?
Read More
Seven Key Words That Explain "Stupidly High" Prices
Read More
Negative Interest Rates In The U.S. Go Mainstream - With Some Glaring Omissions
Read More
Next Recession: The Case For A 36% Stock Market Loss
Read More
Facebook's Libra vs Bitcoin: Five Key Differences
Read More
Is Your Financial Security Based On A Double Aberration?
Read More
Next Recession: Finding A 48% Yield Amid The Ruins
Read More
Next Recession: Concentrating Future Losses & Bringing Them Forward In Time As Profits
Read More
Next Recession: Turning Zero Percent Interest Rates Into A 21% Yield
Read More
Stacking The Next QE On Top Of A $4 Trillion Fed Floor
Read More
A New Great Recession, Once Every Five Years
Read More
Will The 35th Recession Bring A Swift Return To Zero Percent Interest Rates?
Read More
Will A 35th Iteration Of This Night & Day Cycle Change Your Retirement?
Read More
Using The Red/Black Matrix To Identify Investment Risks & Opportunities
Read More
Three Beautiful Arbitrages (Why Yield Curve Inversions Happen)
Read More
OECD Recommends Potential Major National Debt Increases: The Impact On Retirement
Read More
The Sixth Graph - The Multiplication Of Wealth
Read More
Using The Five Graphs To See The 1-2-3 Cycle Of Exaggerated Profits & Losses
Read More
Five Graphs That Explain How The Fed Creates Extreme Real Estate Price Movements
Read More
Will The Federal Reserve Create Two Major Investment Arbitrage Cycles?
Read More
Is Traditional Financial Planning Blind To The New Sources Of Profits?
Read More
A Model That Better Fits The Data
Read More
A Remarkably Accurate Warning Indicator For Economic & Market Peril
Read More
Does The Containment Of Crisis Create Record Investor Wealth?
Read More
A Continuous Cycle Of Crisis & The Containment Of Crisis
Read More
The ABCs Of Popping A Third Asset Bubble
Read More
Using Personal Math Instead Of Abstract Theory To Make Better Retirement Decisions (Social Security Debate)
Read More
How Inflation Reduces The Real Value Of Social Security Net Of Medicare Premiums (Part 6)
Read More
Medicare Premiums Are A Shared Pool - Eight Coming Changes That Will Transform Retirement (Social Security Indexing Part 5)
Read More
The Critical Impact Of Medicare Premiums On Social Security Inflation Indexing (Part 4)
Read More
Out Of Money By November 29th - Social Security Indexing Part 3
Read More
Out Of Money By December 12th - Social Security Partial Inflation Indexing Part 2
Read More
The Social Security Inflation Lag Calendar - Partial Indexing Part 1
Read More
Game Theory & Retirement Choices - Should You Get Yours, Before Everyone Else Tries To Get Theirs?
Read More
Are Roth IRA Owners Likely To Be Subject To Double Taxation?
Read More


