A Model That Better Fits The Data
By Daniel R. Amerman, CFA
TweetLet's say that our goal is to maximize our investment returns, and minimize our risks. And in order to do that, we have to make a choice:
A) Invest for reality and the situation as it is, wherever that may lead us; or
B) Take the easy and popular route, even if it ignores the situation we are in.
Which is the better choice, "A" or "B"?
Many people would not see the distinction - for the easy and popular route, what we are encouraged to believe, is that the process of reliably and safely creating wealth over the long term is no mystery, but rather is effectively a solved science.
What this belief system boils down to is that the financial patterns of the United States and other developed nations in the 20th Century are assumed to be a fixed and governing reality. And while the specifics may vary in the short term, we can supposedly be confident over the longer term that the past will endlessly repeat itself when it comes to how stocks, bonds and other assets will perform in the future.
However, there is a problem with that belief system when it comes to the last twenty or so years - it hasn't been working. We have seen the collapse of two asset bubbles, with results that include the Financial Crisis of 2008, and the most severe recession since the Great Depression of the 1930s. We have also had unprecedented Federal Reserve interventions to contain those crises, including creating trillions of dollars out of the nothingness, and forcing the lowest interest rates in history.
Most importantly, we have also seen record or near record valuations for stocks, bonds, real estate and precious metals.
From the perspective of the patterns of the past - those are all abnormalities, although what is abnormal is a matter of perspective.
From a mainstream perspective, the ruinous financial damage from the collapses of the bubbles, the Great Recession, and the Federal Reserve effectively wiping out the ability of retirees and retirement investors to earn interest income were each complete shocks and surprises, abnormalities that should never have happened.
The traditional alternative to the mainstream is a "doom and gloom" perspective, and from that perspective, the last twenty or so years have also been deeply abnormal. It is now the crises that are expected - but the Federal Reserve actions are a bizarre form of "cheating" that should not have worked, and the record high prices for stocks, bonds and real estate are all completely unexpected abnormalities.
In most fields, if we have to disregard most of the data for the last 20 years because it doesn't fit the model, then a question should arise - are we using the right model? And if the subject is important - such as the value of our life savings and potential standard of living for what could be decades of retirement - then shouldn't we be insisting on a model that actually fits the data, instead of ignoring much of the data as being "abnormalities"?
This analysis is part of a series of related analyses, an overview of the rest of the series is linked here.
Carnivals & Sledgehammers
As explored in much more detail in two other analyses in the series which are linked here and here, there is an alternative way of looking at the last almost 20 years , which is that we have had a cycle of continuous abnormalities.
The recession of 2001 was not a normal business cycle recession, but was abnormal, because it was triggered in part by the collapse of an asset bubble, the tech stock bubble. Losses were unusually severe for investors and confidence was shaken, it was a market crisis.
In order to contain the crisis and reboot the economy, the Federal Reserve responded with an unusually powerful intervention. The Federal Reserve pushed the effective Federal Funds rate down from 6.40% to 0.98%, which took interest rates to their lowest level in almost 50 years.
Now, per investment theory, the "risk free rate" is part of the foundation for investment prices and yields in almost all investment categories. So when the Fed pushed the risk free rate down 5.40% to below 1%, it was if it was swinging a giant sledgehammer downwards, with a force the markets had not seen in the modern era.
By swiftly knocking interest rates downwards, the Fed also swiftly knocked mortgage rates downwards, which made homes far more affordable - and this was one of the key underlying components in creating the real estate bubble. Indeed, in most investment asset categories, a lower risk free rate means potentially much higher asset prices, and the Fed's rapidly forcing low interest rates can be likened to swinging a sledgehammer at an old style carnival attraction, trying to ring the bell.
Real estate prices soared, stock prices recovered, and Wall Street began to take huge risks that were effectively based on real estate prices climbing forever. Until they didn't, and the results were the real estate bubble popping, the Financial Crisis of 2008, and the Great Recession.
So how did the Fed respond? By swinging that sledgehammer down harder than it had ever been swung before, and intervening more aggressively in all investment market prices. It swiftly pushed interest rates down to effectively zero percent, the lowest in the modern era, and it reinforced the power of the sledgehammer with unprecedented and successive rounds of quantitative easing, creating trillions of new dollars.
And ultimately, the carnival bells began to ring again, and there were new record or near record prices again for many investment assets, including real estate, bonds and stocks.
So what we have seen over the last 20 years has been: asset bubble... crisis... Fed sledgehammer to contain crisis... high asset prices... asset bubble... crisis... Fed sledgehammer to contain crisis... high asset prices... asset bubble???
Is that a pattern? Could it happen again? Is it happening again?
As introduced here and further developed in the previously linked analyses, when we take that perspective - the abnormalities disappear and the data far better fits the model.
The sharp losses caused by the popping of asset bubbles become rational and expected.
Federal Reserve interventions and the destruction of interest income for retirement investors becomes rational and expected.
Most importantly, record or near record prices for stocks, bonds, real estate and precious metals all become rational and expected at various points in the cycle.
The last twenty years have included some of the worst financial conditions that most of us have experienced in our lifetimes. The last twenty years have also included some of the most profitable market conditions that we have ever seen.
Both are true simultaneously - and there is good reason to think that both could potentially be true in the future. To protect ourselves from the risks and to position ourselves to profit from the opportunities, we have to be able to truly see and understand the logical relationships between crisis, the containment of crisis, and investment price movements in each of the major asset categories.
What If There Is A Third Iteration?
Finding an investment model that better fits the data may sound quite abstract for the average person.
What needs to be kept in mind, however, is that these data points are our lives, our financial security, what our actual standard of living will be in retirement, and whether we can retire at all.
If we invest all that we have on the basis of a model that has been a poor fit with the data for almost 20 years, and the model continues to be a poor fit - then we have no security and no assurances.
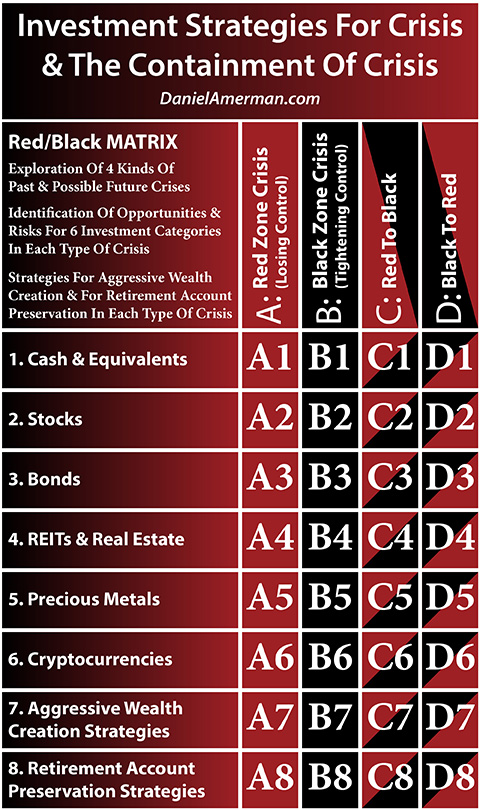
Perhaps the easiest way to illustrate this is to ask a quite simple question: what if we get a third iteration? Starting in the year 2000, we've had two Red Zone crises (more on what that means in the other analyses), and we've also had two Black Zone containments of crisis. What if there's another round to the cycle?
From a mainstream individual financial planning perspective, the data points of the last two bubbles popping, the tech stock bubble and the Financial Crisis of 2008, have already been (effectively) thrown out as being rare abnormalities that never should have happened in the first place. That means that the potential data point of a third crisis - and perhaps the largest crisis if amplification continues - is ignored, and the possibility of it is more or less precluded by definition.
So, if there is a third iteration, and our only protection was to theoretically exclude the possibility of a third crisis - then we have no protection whatsoever. There would be devastating financial damage to tens of millions of retirees and retirement investors (and pension funds).
Because we have in practice had two previous rounds of "abnormalities", a previously obscure term has become part of the professional vocabulary, and that is "sequence of returns risk". As was demonstrated in the real world in 2000 and 2008, long term averages do not protect individual investors if there is a sharp enough loss that occurs near to the year they retire or in retirement. There may not be enough time to recover from the damage, and the loss of financial security and/or lifestyle can be permanent over their remaining years.
Not Seeing The Third Containment
Now, let's consider a different financial model, which is that of generic "doom & gloom" investors. Their financial model completely incorporates the previous two episodes of crisis, for they are the very core of the model. So if there is a third round of Red Zone crisis - these investors are likely to come through with flying colors, with financial security intact and possibly in better shape than ever.
However, what if there is not just a third round of crisis, but a third round of the Black Zone containment of crisis? A third crisis could be an existential event for the United States government and the Federal Reserve, and they would have extraordinary motivations to do whatever they could to contain the crisis, prevent a financial meltdown, and try to get the economy going again.
That could be a daunting task - but never forget that the law and the very nature of money itself are not fixed, but are variable, and can be changed by the government and Federal Reserve if the need is urgent enough. We saw this the last time around, and it could certainly happen again, perhaps even in amplified form if there is an amplification of the crisis.
Now, a crisis can deeply impact asset prices and returns across all the asset categories, and that is reasonably well understood. What is far less understood is that extraordinary interventions to contain crisis can also have a dominating impact on asset returns and prices.
How the containment of crisis can produce record or near record prices for multiple asset categories including stocks, bonds and real estate - even while destroying the interest income that is one of foundations of retirement financial planning - is not taught in Finance 101, and it is not part of the conventional wisdom. It not only not part of Modern Portfolio Theory, but it contradicts the very foundation assumptions of MPT, which are based upon investors determining prices rather than governmental interventions.
But nonetheless, what we have seen since 2001 has been ever more aggressive Federal Reserve interventions, including the lowest interest rates in 50 years, followed by ZIRP (Zero Interest Rate Policies) and the lowest rates in history. We've seen the Federal Reserve using quantitative easing to create dollars by the hundreds of billions to stop a collapse of the global financial system in 2008, and then even more to effectively fund the purchase of most of U.S. homes that sold in 2009 and early 2010, and then even more trillions to effectively fund a big chunk of the U.S. national debt.
And the results of this seemingly bizarre process have been not been some dark scenario, but record real estate prices, record bond prices and record stock prices. The price of not understanding the process is to miss out on record profits in different asset categories at different times.
Because the generic "doom and gloom" model does not incorporate the containment of crisis - it cannot see this process. (This is not meant to be a description of all contrarian investors, and most particularly not of the contrarian readers who I have met or corresponded with over the years, many of whom are exceptionally well read when it comes to economics and finance.)
In a classic "doom and gloom" model, crisis is supposed to lead to an annihilation of the value of paper currency as well as much of the financial system. From that perspective, record asset prices and profits in the aftermath of crisis are completely illogical events that should not have happened in the first place, and they can therefore be safely ignored as abnormalities that won't happen again.
So while a generic "doom and gloomer" can come through a third round of crisis just fine, the risk is that they will not be able to see a third round of the containment of crisis. They therefore risk staying hunkered down in their financial bunkers for many years after the crisis has passed, discarding the data points of what is actually happening and missing out on what could be extraordinary profit opportunities in multiple markets, even while the value of their crisis oriented investments continues to decline.
The Advantages Of Seeing & Using All The Data
This is a short introduction to a much larger body of work, and there is not room herein to fully develop what follows. But as a start, let's consider the advantages of using a financial model that includes all of the data points.
There is no certainty that there will be another Red Zone crisis. But if it does happen for a third time then a model that sees with clarity the data points that have already happened, and allows for the significant possibility of crisis has major advantages over a model that ignores what has happened and precludes the possibility of its happening again.
There are greater chances of defense, and of being able to preserve the value of assets. There are greater chances of offense, and of being able to aggressively take advantage of the major price swings that accompany crisis.
There is no certainty that there will be another Black Zone containment of crisis. But if it does happen for a third time, and if we see the data points, and if we understand why they are happening and what the implications are - then we have the ability to potentially benefit from major price swings in multiple different asset categories at different points in time.
The greatest benefit of all that comes from moving to a model of crisis and the containment of crisis is the ability to see the cycles.
A key difference between normality and cycles of crisis and the containment of crisis is that with the cycles there are higher highs, and lower lows, and they can occur closer together.
So a change in a cycle is a major price movement across multiple categories in the first half of the cycle, and this is true whether we are looking at a cycle of Red Zone crisis to Black Zone containment of crisis, or a Black to Red cycle. In some asset categories, there may be record or near record losses, and in other asset categories there may be record or near record profits.
Then the cycle changes a second time - and possibly quite abruptly, as we have seen in the past. If we were in Red, we go to Black, or if we were in Black, we go to Red. There is an entirely different pattern of potentially radical price changes. Again, there could record or near record losses in some asset categories, and record or near record profits with other assets, with the specifics being entirely different than in the first half of the cycle.
The Many Paths From Point A To Point B
Let's say that where we are right now is Point A, and in 5, 10 or 15 years, the nation has gone through a complete cycle, and investments, the markets and the economy are going to be at Point B. Some would say that is all that matters. However, as individuals making individual decisions, there are many paths in traveling the cycle from Point A to Point B, with potentially radically different personal outcomes.
Let's say that someone is not invested for the possibility of crisis, a change in the cycle does bring a severe Red Zone crisis, and all their asset valuations go from high to low, with severe losses and financial pain.
So they completely change their investment strategy with what remains of their assets. Then there is another change in the cycle, and it goes to what we have seen for most of the last 20 years, which is Black Zone containment of crisis. But they have no idea what that means, they had no reason to expect it or invest for it, and once again, their asset valuations go from high to low, with major losses.
That would not be a pleasant situation - but I suspect many of us know people that has happened to in at least one of the Red to Black or Black to Red cycle changes over the last twenty years.
If we mix it up and our strategy gets one side of the cycle right and the other side wrong - then it all depends on the specifics.
But if we were to get both sides of the cycle right, and go from lower lows to higher highs, two times in succession on both sides of the cycle - then the results could be life changing in a very positive way.
The future is never certain - but the knowledge we have and the choices we make can shift the odds in our favor, compared to what would otherwise be the case.
If the model we are using to make our choices requires throwing out large chunks of the last twenty years as being abnormalities because they don't fit our model - then our odds of success may not be what we think they are.
On the other hand, if our decision making changes to a model that fully includes all of the data points, where none are abnormalities but rather all are rational and expected - then the odds may indeed move materially in our favor.
*******************************************