

Making Optimal Social Security Claiming Decisions - A Four Stage Analysis
By Daniel R Amerman, CFA, MBA, BSBA
TweetOverview
Making optimal decisions about when to claim Social Security benefits is of vital importance. For a person of retirement age with average savings, this choice may be more important than any other aspect of financial planning when it comes to the standard of living in retirement – yet, much of the information available is overly simplistic. This analysis looks at the claiming decision on four different levels, to better capture the tradeoffs involved and the impact that different choices can have.
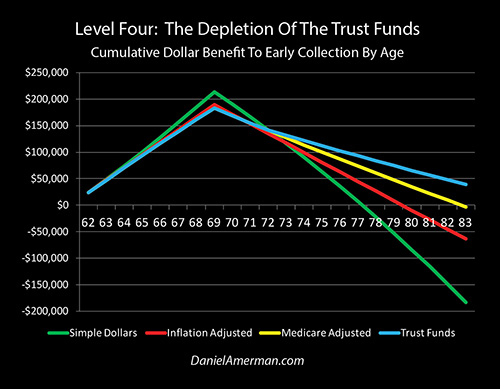
The graph above summarizes the four analyses, for someone who is choosing between collecting at age 62 versus age 70. Some money is always better than no money, so a major cumulative dollar advantage builds each year with the early collection of Social Security benefits. However, once age 70 is reached, the monthly payments are much higher for those who waited, so the cumulative advantage rapidly erodes.
This first level of analysis is detailed below and is represented by the "Simple Dollars" green line. The crossover age, where the cumulative dollar advantage to collecting benefits early becomes $0 – and the financial advantage shifts to late collection – is 78 years and 2 months. In the example developed below, this means that someone who reaches the initial decision age of 62, and then lives an average lifespan of 84 years, would have a $183,000 advantage to waiting until age 70 before claiming benefits.
It is this simple type of analysis which leads to the widely publicized claim that deferring collecting Social Security for as long as possible can lead to a six figure increase in benefits.
However, while mathematically accurate, this result is dependent upon ignoring three crucial factors, each of which can have a major real world impact on our standard of living in retirement.
The second level of analysis is to adjust for inflation. Most of the six figure advantage to waiting is an illusion that is based upon counting future inflation adjustments to benefits as income, but not discounting for the lesser purchasing power of the dollar.
When a more financially accurate treatment of inflation is used, we get the red line, which crosses the breakeven $0 dollar line at the age of 80 years and 5 months. The advantage to late collection for someone who lives an average lifespan is reduced to about $64,000.
A third level of analysis is to also take into account the vital but little examined linkage between Social Security and Medicare Part B premiums. When this is done, we get the yellow line, which does not cross the breakeven line until the age of 83 years and 9 months.
For someone who lives an average lifespan, there is now almost no advantage to waiting until age 70, and the cumulative advantage to collecting late is less than $3,000 on their 84th birthday.
The fourth level of analysis is to also factor in the financial condition of Social Security and the Social Security Trust Funds. Absent changes in the law, when the Trust Funds deplete – then benefits are legally required to be reduced.
Using the "High Cost" scenario from the government's own Social Security Trustees Report, this means benefits are reduced beginning in 2030, and the blue line is generated. The blue line crosses the breakeven point at the age of 88 years and 7 months. For someone living an average lifespan, the cumulative advantage to claiming at age 62 would still be about $39,000 as of their 84th birthday.
We do need to keep in mind that there are multiple levels to the decision about when to start collecting Social Security, including spousal situation, our employment and current income status, and the biggest wild card of all which is how long it is that each of us will individually live.
That said, the simple fact is that retirees have a greater exposure to inflation and medical expenses than any other age group. And the extreme financial pressures that a steady stream of about 10,000 more Boomers retiring each day will be placing on an already heavily indebted federal government over the years to come are well known.
Any retirement decision framework which does properly not take all three of those basic factors into account is likely to be wrong, and perhaps terribly wrong. Yet, ironically, ignoring all three factors is commonplace when it comes to the financial analysis of Social Security decisions.
Level One: Simple Dollar Analysis
Beginning at age 62, those eligible for Social Security have a right to collect benefits, but they are also given a strong financial incentive by the government to not exercise that right. They can choose to begin collecting benefits immediately, but the benefits are relatively low and will remain so for the rest of one's life. The incentive for not starting immediately is that the longer one waits to start collecting benefits, the higher the benefits that will be paid out each month, and again – this is for life.
The table below shows the financial choices presented to an individual who is just turning 62, and is eligible for a reasonably high Social Security benefit for that age. One choice is to claim Social Security benefits as soon as possible at a level of $2,000 dollars a month, which is $24,000 per year. This choice is shown in the "Early Strategy" columns on the left.
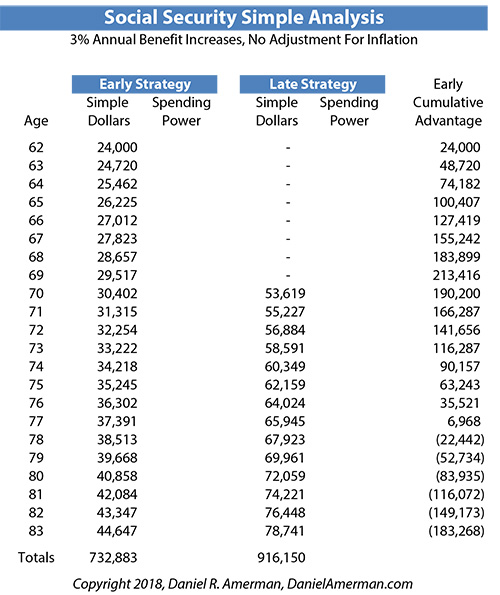
This monthly cash flow is not fixed, however, but is assumed to increase once each year with an inflation adjustment of 3%, which is somewhat less than the long term inflation rate of 3.5% in the United States since 1933. So the cash flow for age 63 is $24,720 which is 3% greater than the cash flow for age 62, and that climbs in each succeeding year, until it reaches $44,647 for age 83 (the tables all assume that someone reaches age 84, but not 84 years and 1 month, so the final year of payments are all for a full 83rd year). Total payments over the 22 years are $732,883.
Now, a person could start claiming Social Security any given month after turning 62, but for simplicity and to draw the clearest possible distinction between choices, the "Late Strategy" columns assumes we follow the widely given advice to claim at the latest time for the largest benefit, which means waiting until age 70. At the time we made our choice, the schedules showed the benefits for 70 as being $3,527 per month – or a full 76% increase over early collection.
What is shown in the actual table in the "Late Strategy" columns, however, is $53,619 in benefits for age 70, which is $4,468 a month in payments. The difference is that with each year that passes, and each inflation adjustment, our scheduled future payments are rising right along with the current benefits being paid out. Because eight (assumed) 3% inflation increases have already occurred, our first payment is much higher that what it looked like eight years earlier.
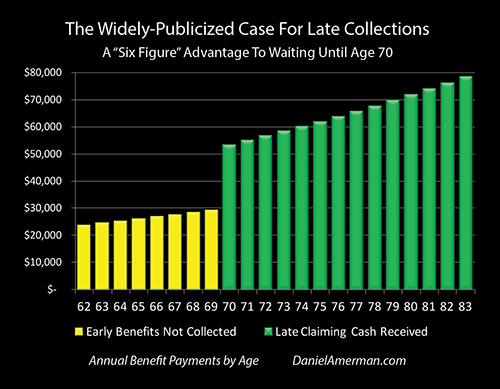
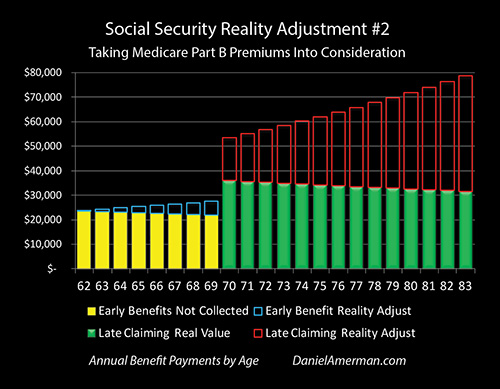
It is this assumed annual increase in payments with a 3% rate of inflation that produces the graph above, and the yellow and green bars that grow taller in each year. And while claiming late does mean giving up eight years of payments, when we do start getting payments – they are much higher.
Even though we only get 14 years of payments with this choice, because they are so much higher, our total benefit payments received are now up to $916,150, which is getting close to $1 million (and if we just lived one more year, we would reach almost the million dollar mark in total Social Security payments). This is $183,268 more than we would have received if we had starting claiming benefits at age 62.
Now, so long as the choice is between some money coming in versus no money coming in – then as can be clearly seen in the graphic below, there is a quickly building advantage to having some money coming in, until by the end of one's 69th year there is over a $200,000 cumulative advantage to early collections. For those who don't make it to their 70th birthday, or don't live very long beyond that, then this advantage is all that matters.
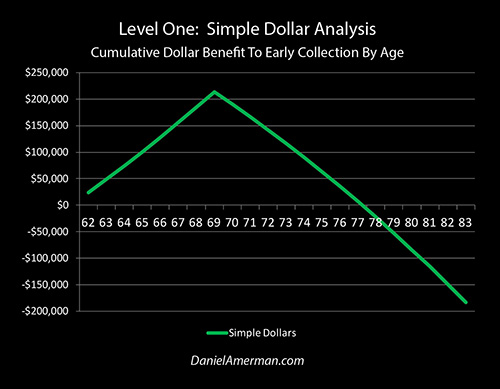
On the other hand, for the substantial majority of retirees who do live at least that long and much longer – from that day forward there is a powerful monthly financial advantage to having waited. The much bigger checks immediately begin to reduce the cumulative advantage to having collected the smaller checks for a longer period, and the dollar advantage plunges downward in both chart and table. Until at the age of 78 years and 2 months we reach our "crossover" date, where the dollar advantage to early Social Security benefit collection disappears entirely.
For someone who reaches the age of 62, the average lifespan is about 84 years. And as indicated, for the entire time between our crossover age of 78 years and 2 months, and an assumed end to benefit collection on the first day of the 84th year, the cumulative dollar advantage of about $183,000 goes to those who waited to collect their payments.
This particular kind of Social Security analysis is responsible for the widely reported, headline-grabbing conclusion that for those retirees who live to an average age, there is a six figure advantage to waiting until age 70 to collect benefits, with couples having a much bigger advantage over individuals. As presented, that is quite an advantage, and millions of people are being urged to use this kind of financial education – which points towards deferring the collection of their Social Security benefits – in order to make the best possible decisions.
Level Two: Spending Power Analysis
There is unfortunately a fundamental flaw with these calculations, which becomes apparent when we raise the sophistication of our analysis by just one notch. For, when we look at the future in terms of spending power (otherwise known as using inflation-adjusted dollars) – as those with a reasonable amount of financial or economic training usually do – we discover a surprisingly different outcome.
When we get inflation adjustments to our salary or retirement benefits, while on the surface it may seem like we're getting a raise, we're actually not – rather we're being compensated for the loss of the purchasing power of our dollars.
This issue is illustrated in the table below, which shows the effects of a 3% rate of inflation on a $1,000 benefit payment, that exactly keeps up with the rate of inflation. We do get more dollars each year, as seen in the red "Level One Simple Dollars" column. However, the dollar buys less each year, as shown in the green "Value Of Dollar" column.
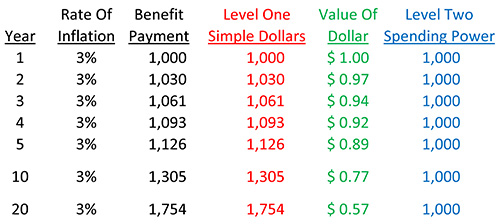
If in the interests of making the best decision for our retirements we want to get an accurate look over time at what matters – which is the purchasing power of our benefit payment – then an evaluation method used by professional analysts is to adjust the amount of each payment for the value of the dollar at the time, which produces our blue "Level Two Spending Power" column. And indeed, a benefit payment which exactly keeps up with inflation should maintain an exactly level purchasing power.
So what happens if we do look at our pivotal decision about when to begin collecting benefits in spending power terms?
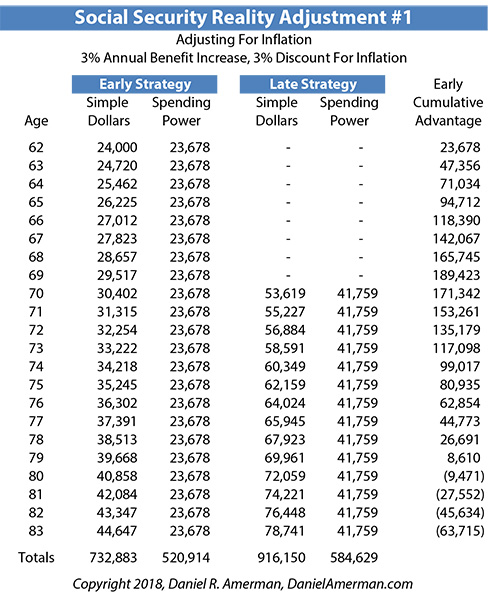
The "Simple Dollar" columns are identical to those of the previous table, but the "Spending Power" columns have now been filled in in the table above. As one would expect and as previously illustrated, when we both increase payments by 3% per year, and decrease the value of the dollar for a 3% rate of inflation, the falling value of the dollar exactly offsets the increasing number of dollars, and we are left with what inflation-indexing is supposed to produce – level spending power.
Now, as can be seen with age 62, the level spending power is actually less than the cash coming in even in the first year, and this is not an error. These tables are the annual summary of monthly calculations, and inflation means that what we pay for purchases increases a little bit (on average) each month, but we are given our annual compensating "raise" retroactively, after up to twelve months of having paid those higher prices. So Social Security, Cost Of Living Adjustments (COLAs) for salaries, and other inflation-indexed payments don't actually fully keep with inflation, even if the inflation measure used were to be exactly accurate.

Indeed, as shown in the table above and explored in detail in the more advanced analysis linked here, when we also take into account the lag between when inflation is measured and when payments are made, Social Security beneficiaries have a potentially major financial exposure to increasing rates of inflation that few people realize. However, for this introduction we will keep it simple.
Our total Spending Power for the Early Strategy is reduced by over $210,000 when compared to Simple dollars, down to $520,914. And unfortunately, this major loss is reality-based and mandatory – as retirees on fixed incomes know all too well, for even small ongoing annual increases in prices can steadily reduce standards of living.
As bad as adjusting for Spending Power reality is for the Early Strategy, it is much worse for the Late Strategy, where our spending power is reduced by over $330,000. This greatly closes the gap from a $183,268 Simple Dollar advantage to the Late Strategy, to a much smaller $63,715 Spending Power advantage, which is a reduction of about 65%.
For many people, this degree of change may seem counter-intuitive. We have two alternatives over a 22 year time frame, shouldn't inflation reduce the benefits for both strategies in a more or less proportionate fashion?
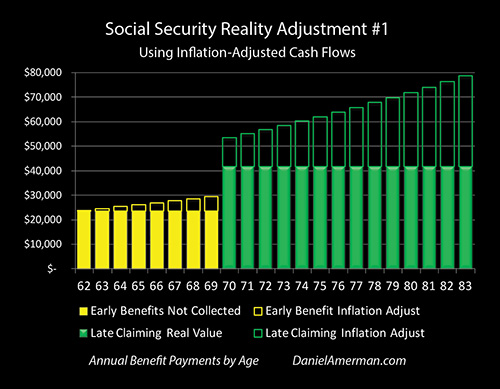
The reason for major change is illustrated in the graphic above, and can be easily seen in the numerical table of payments as well. Inflation adjustments start small, and get very large with time. The hollow yellow bars of adjusting for the reality of inflation start very small, and only slowly grow above the level, solid yellow bars which represent purchasing power. Looking at the numerical table, our initial annual adjustments for the Early Strategy are roughly $1,000 for age 63, $1,800 for age 64, and so forth.
However, when we reach the green bars of the Late Strategy in the illustration, the hollow bars of inflation adjustments get much larger in proportion to real spending power, and this becomes particularly true as we go out to ages in the late 70s and early 80s. Looking at the numerical table, our annual inflation adjustment for the Late Strategy is about $26,000 by age 78, and about $37,000 by age 83.
The farther out in time we go, then the greater the possible mistake for people making decisions, when it comes the difference between Simple Dollars and actual Spending Power. And because the cash flows are so heavily back-end loaded with the Late Strategy, the impact of accurately adjusting for Spending Power is far greater.
Now, the use of Simple Dollars is not by itself a mathematical error, nor is it at all uncommon. Looking at the past and future in terms of simply "dollars", is the unquestioned norm for newspapers and television and the like.
Indeed, if you read about stock market averages, or real estate prices, or financial records in almost any category – they are typically not adjusted for inflation. The public is continually presented with information about record markets and record prices, when in reality what they are really reading about in most cases is record lows for the purchasing power of the dollar.
So to be fair, the Simple Dollar analysis ─ which is based upon "a dollar being a dollar", regardless of when we receive it ─ does indeed fall within the normal range of how financial information is presented to the general public, and the assertion of a six figure Simple Dollar advantage in situations such as the example above is mathematically accurate.
Unfortunately, however, common usage does not mean making good decisions, and in this particular case, using the most common approach for the general public can lead to millions of people making bad decisions that could change their daily lives for the worse over a period of 20 years or more. Because the decisions are being based on an illusion, and the great majority of the dollar "advantage" to late claiming strategies is indeed an illusion.

When we accurately adjust for spending power, we also get a very different cumulative advantage graph for visualizing the tradeoffs between strategies. During the early years something continues to be much better than nothing, and an enormous advantage still builds for the Early Strategy.
However, once age 70 is reached and the larger Late Strategy payments begin arriving, the slope downwards is not nearly as steep as with the Simple Dollar graph, because much of the steepness of the decline was based upon nothing but treating inflation as income. The line still goes negative by the end - because there is still a cumulative disadvantage to early collection - but the financial loss is far smaller. Which can certainly change both the psychological perception and the decision.
Now, for the half of the population who live at least a little (and hopefully many years) beyond the average lifespan, the advantage to Late Strategies is still there and growing every month and every year as we go off the edge of the graph to the right, just not at the same rate as with Simple Dollars. So the fundamental dilemma remains when it comes to making this decision and the unknown variable of how long we will live.
The "crossover date" when the financial advantage shifts to delaying our Social Security checks does now move to 80 years and 5 months – a delay of 2 years and 3 months. Meaning that we moved much closer to a 50/50 tradeoff, where those who live an average lifespan are theoretically indifferent between strategies, those who turn out to live shorter lives should have chosen Early collection, and those who live longer lives should have chosen Late collection. (Keeping in mind that the timing of the cash flow can be important for different individual situations in ways that are not captured with this type of analysis.)
It should also be noted that the red line above is based upon the common academic simplifying assumptions of perfect inflation indexing and perfect payment certainty. When we use a different methodology that allows retiree expenses to grow at a faster rate than Social Security benefit increases as analyzed here, this can substantially change the results in favor of earlier collection.
Level Three: Adjusting For How Social Security Decisions Can Change Medicare Premiums
The retirement standard of living delivered by government benefits is not Social Security by itself, nor Medicare by itself, but Social Security payments net of Medicare premiums and deductibles.
In other words, what determines our standard of living for food, shelter, utilities, clothing and the other components of day to day living is the net cash flow we get from the government.
Now, if Social Security were entirely separate from Medicare, we could ignore Medicare and just make the best decision we can for Social Security, then separately make the best Medicare decision we can while ignoring Social Security, and that would give us our best result.
However, what many people don't realize is that their Social Security decisions can have a potentially dramatic impact on the size of the Medicare Part B premiums they pay, and this can happen repeatedly over many years.
If someone is currently collecting Social Security AND like most people they choose at age 65 to have their Medicare Part B premiums deducted from their Social Security payments, then under current law in most (but not all) cases they will be protected against excessive Medicare premium increases for the rest of their lives. The "hold harmless" provision of Social Security states that increases in Medicare Part B premiums cannot result in net Social Security payments being cut.
So if the monthly size of someone's Social Security payment goes up by $30 because of inflation-indexing, and their Medicare premium which is deducted from that payment is supposed to increase by $40, then it would appear that their benefit payment would go down by $10 per month. The "hold harmless" provision which applies to most retirees keeps that from happening, as their Social Security payments net of Medicare deductions are not allowed to fall.
For most retirees (there are several excluded categories) in that situation, their Medicare premium could not go up by more than $30 per month. It does not matter whether their monthly premium would otherwise go up by $30, or $40 or $80, they are protected and capped out at a $30 increase - which means their net payment is unchanged. (There is an exception, however, if the government simply doesn't have the money to pay, as covered in the Trust Funds section that follows.)
There are two important ways in which this little understood or explored linkage with Medicare premiums can have a powerful impact on the decision about when to start collecting Social Security benefits.
1) Partially Or Fully Negating Inflation Indexing. Let's say that we are receiving an even $1,000 per month benefit, and that our Social Security benefit was supposed to go up by $30 per month to keep up with inflation, but our Medicare Part B premium goes up by $10 per month, so our net benefit payments increase by only $20. With this round number example, our cost of living went up by 3%, but our cash coming in goes up by only 2% because the Medicare premium increase took part of the inflation-indexing increase.
In that case, we are no longer completely protected against inflation, but rather we are only partially protected. (If we were ever fully protected that is, retiree expenses are not what the inflation index is based upon, but tend to rise at a faster rate, and the government has enormous financial incentives to make sure that remains the case.)
If we are spending all the retirement benefit money we have coming in, and those benefits don't keep up with inflation because of the linkage with Medicare premiums, then either our standard of living must fall every year, or we must eat into our savings at a faster rate than we otherwise would, which brings forward in time the depletion of our savings.
A failure to keep up with inflation to even a minor extent is something that grows ever more powerful with the passage of time. It has a much bigger cumulative effect in year five than in year one, a much bigger effect in year ten than year five, and still more so in year twenty than year ten. This slow but steady loss in spending power can be seen in the graphic below, where the solid bars representing spending power now gradually shrink with time, even as the hollow bars of that represent inflation and the impact of Medicare premiums now grow slightly larger.
 g
g
Because the cash flows from late collection occur on average much later than the average cash flows for early collection, having partial inflation indexing hurts the solid green bars of late claimer spending power much more than it hurts early claimers, as can be seen above. However, this is not the only Medicare related disadvantage to delaying collecting Social Security, and it is not necessarily the worst.
2) Concentrating Medicare Premium Increases. Under current law, when some Medicare beneficiaries are protected from excessive premium increases, the shortfall does not go back to the government. Instead, it is paid for by the Medicare beneficiaries who aren't protected. Medicare Part B premiums are in fact a shared pool, and while very few people are currently properly taking this into account, the financial implications are quite powerful for retirement income.
For those people aged 65-69 who are paying Medicare premiums but have intentionally deferred collecting Social Security in order to receive larger payments later – they have no "hold harmless" protection. What is much worse, however, is that they must "pick up the tab" for everyone who is protected by "hold harmless", including those in their age group who did choose to collect Social Security.
As an example, about 30% of current Medicare beneficiaries just barely dodged this bullet in late 2015 when a last minute budget fix averted what would have otherwise been up to a 52% increase in Medicare Part B premiums that was scheduled to take place on January 1, 2016.
The reason that the scheduled 2016 increase was so large was that the government said that there wasn't any inflation (on average) in the previous year, so Social Security payments did not increase for 2016. But yet, despite the purported complete lack of inflation, the cost of the Medicare Part B program did soar, which meant that under the law the premiums had to soar as well.
Except premiums couldn't be increased at all for the 70% of Medicare beneficiaries who were having their Medicare premiums deducted from their Social Security payments, because with no increase for inflation, any increase in premiums whatsoever would have reduced their net payments, which is not allowed under the "hold harmless" provisions.
And what that meant was that the 30% of Medicare beneficiaries who were not protected by "hold harmless" – had to take on the premium increases for everybody.
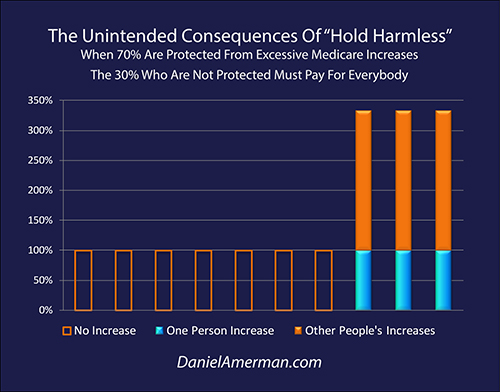
This real world situation is illustrated above. If it weren't for "hold harmless", then everyone would have had to pay for 100% of their own Medicare premium increase. But 70% of the beneficiaries were protected and didn't have to pay anything extra, which is why their orange bars are hollow.
Those not protected are represented by the solid blue bars, and they had to pay 100% of their own premium increase. Crucially, they also had to pay the premium increases for everyone who was held harmless. Since there were 2.33 protected people for every non-protected person (70/30 = 2.33), that meant that each non-protected person had to pick up a total of 333% of the per person premium increase, with 100% for themselves (the solid blue bar), and 233% for 2.33 other people (the solid orange bars).
That is where the shocking number of up to a 52% increase in Medicare Part B premiums for 2016 came from, it wasn't just the sharp jump in medical expenses, but was even more so the few paying for the many. This sounds crazy, and it sounds terribly unfair – but it is part of the current law governing the relationship between Social Security and Medicare.
And while there was a last-minute budget fix for 2016 where the federal government took part of the financial hit and just added it to the deficit, thereby reducing the size of the premium increases for those who were vulnerable – that was a one time action. The governing law remains the same. And those who defer collecting Social Security for as long as possible have no protection from this danger, while those who are collecting and choose to have their Medicare premiums deducted are protected.
Accurately estimating the effect is problematic, because it depends on the differential between what the government states the inflation rate is, and what the actual increase in Medicare Part B costs are in each future year. There is a further quite "lumpy" and powerful risk, that at least every now and then the situation of the 2016 premium increase recurs, and all those late claimers aged 65 to 69 get taken to cleaners, so to speak.
But yet, these factors can be life-changing, and any analysis which does not take this little examined relationship into account is likely to be skewed towards making bad decisions. For those who wish a more detailed understanding of this critical issue, the more advanced analysis is linked here, and it explores eight different factors that will be changing retirement finances in the coming years.
As a solution, this simpler analysis uses a somewhat "gentle" adjustment for the intertwined relationship between Social Security and Medicare Part B premiums. It is assumed that actual Social Security payments net of Medicare premiums fall 1% short of the assumed 3% rate of inflation, and this applies equally to early and late claimers. It also assumes that for those not yet claiming Social Security, there is an additional shortfall of 1% per year, because they entirely lack the protections that are offered by the "hold harmless" provision.
The effect of each small adjustment is to create "Partial Inflation Indexing" where net benefits do steadily increase, but at a slower rate than prices. For the average person this can sound a bit obscure or subtle – but for retirees, the results are powerful and can help determine standards of living over a period of many years.
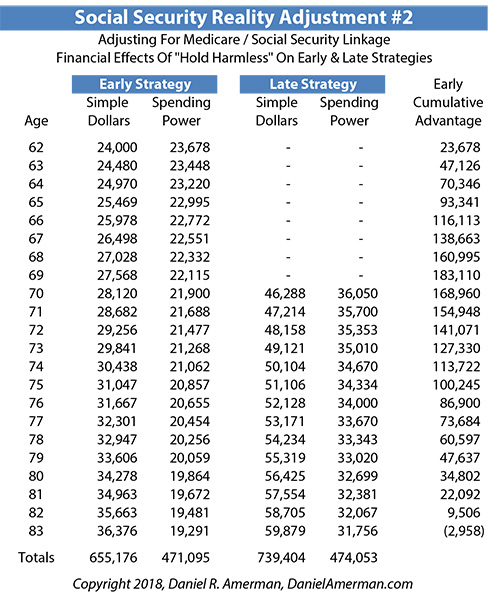
The first thing to notice about the numerical table above is that the Social Security benefits net of increases in Medicare premiums are still assumed to increase every year, and that this still seems to occur at a pretty good rate. By age 83, we are up to over $36,000 per year for the Early Strategy, and almost $60,000 per year for the Late Strategy. And if we stick to Simple Dollars, there is still about a $84,000 cumulative advantage to the Late Strategy over an expected lifetime.
So the way most people see the world – they are still getting more money every year. And using the most common way that information is presented to the general public by those who are not financial professionals, there is still a substantial advantage to waiting until age 70 to collect Social Security benefits.
But yet, any increases whatsoever in Medicare Part B premiums mean that we are no longer keeping up with inflation. Medical expenses don't even have to increase faster than the rate of inflation to produce this result, because we only (theoretically) keep up with inflation with our full benefit increase, and any increases in deductions at all means that isn't happening. Social Security is in truth only partially inflation-indexed when we take Medicare premiums into account, and this is a matter of design, albeit not a feature that the government talks about.
On a personal level, it doesn't get any more real world than spending what we have left after the deductions for (government-sponsored) medical insurance, and having to reduce our lifestyle when the prices we pay for everything else are increasing at a rate that is even slightly faster than the money that we have coming in.
With even the modest adjustments previously described, in the numerical table we now see personal reality for each of us, which is our "growing" net Social Security payments actually buying just a little less each year. And because the value of our Late Strategy cash flows are so much farther out in time and therefore more vulnerable to adjustments for inflation – and partial inflation indexing – they are disproportionately reduced, in comparison to the much smaller impact on the initial years of the Early Strategy.
When we move from Simple Dollars to Spending Power, and we then look at the Spending Power of Social Security payments net of Medicare Part B premium increases, those two factors by themselves are enough in combination to effectively wipe out the advantages of Late Claiming for someone who lives to an average age.
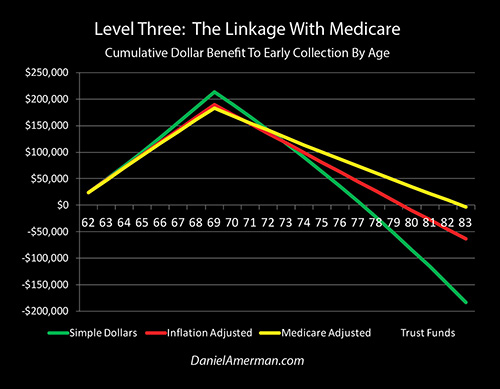
Visually, it can be plainly seen that the steepness of the downward slope of the yellow line from age 70 onwards is significantly less than the red line of cumulative Spending Power, or the green line of cumulative Simple Dollars. Because the yellow line is still almost on the $0 line at the end, there is now a financial advantage to the Early Strategy for the duration of an entire average lifespan, right up until the last three months.
Our "crossover" age where the advantage shifts to Late Strategies has now moved to 83 years and 9 months. For those living longer lives there is still an advantage to Late Strategies, but the date this advantage arrives has moved back by 3 years and 4 months, and the monthly advantage from that date forward is smaller than it previously was.
And there could be a much greater advantage to early collections if the Medicare costs of an aging population do increase at a rate substantially higher than the government stated rate of inflation.
Level Four: The Depletion Of The Trust Funds
The preceding sections assume that the government pays every dollar of scheduled future Social Security payments. The word "scheduled" is critically important because while it may come as a surprise to much of the general public, the federal government itself could not be more clear that it has not promised to make those scheduled payments in full, but will only pay beneficiaries to the extent that it has the cash available.
This uncertainty means that our largest issue of all when it comes to deciding whether to collect late or early is that of the government's ability to pay, and whether we are in fact likely to be receiving our full scheduled payments for the rest of our lives.
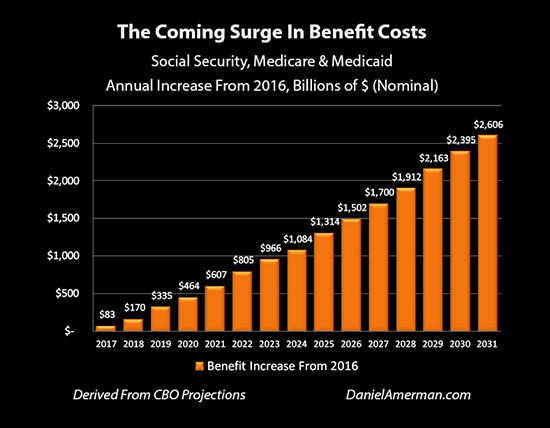
When it comes to the ability to pay, it is worth taking a close look at the graph above. As analyzed here, the long expected surge in Boomer retirement benefits is finally upon us. If scheduled payments are made in full, increasing benefit payments alone will lead to an increase in annual deficits of close to half a trillion dollars a year by 2020, and nearly a trillion dollars a year by 2023. The amounts then swiftly grow to much more staggering levels, with annual increase in deficits of $1.5 trillion by 2026, $2.2 trillion per year by 2029, and $2.6 trillion per year by 2031.
Unfortunately, the rapid doubling of the national debt between 2007 and 2014 also had a profound impact on the financial feasibility of the government making Social Security and Medicare payments in full.
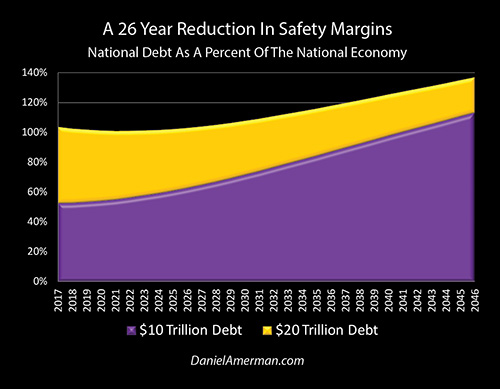
As explored in the analysis linked here, the doubling of the national debt removed 26 years of safety margin for the Social Security and Medicare programs. If the debt had not doubled, then every dollar of Social Security and Medicare payments could have been paid in full until 2043, and the nation still would have been in better financial shape for the entire time than it is today. But, the national debt did double.
The federal government is well aware of these issues - and the law takes them into account. The solution under current law is shown below.
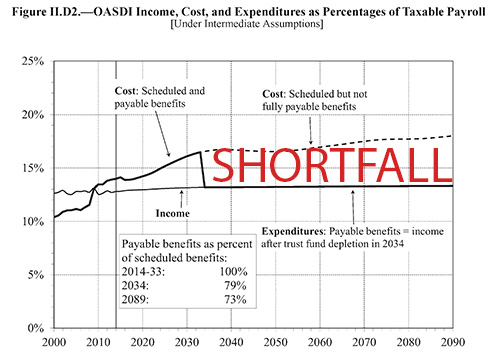
The above is excerpted from the 2015 Trustee Report for Social Security (only the word "SHORTFALL" was added). After the Trust Funds run out, there is a top line that says "Scheduled but not fully payable benefits", and a lower line that says "Payable benefits." And the government doesn't have any intention of covering the difference. If taxes don't go up in a major way, then the payments go down so that the deficit doesn't go up.
That is the current law. And the scenario above is the government's own baseline projection for the future. Which is actual Social Security benefits paid out being cut well below what is scheduled at some point in the future.
Now some might confuse this little understood feature of Social Security with projections of bankruptcy for the United States government or the collapse of Social Security ─ but it is instead arguably the direct opposite of such talk. As explored in more detail here, this provision is the intended protection against insolvency for both Social Security and the government.
The legal loophole is that Social Security doesn't have to pay us what it doesn't have the cash on hand to pay, regardless of what we think we are entitled to or what is shown in the Social Security tables. This keeps the federal government from going bankrupt. This keeps Social Security alive and solvent.
But the price of that solvency is that we don't get what the schedules say we will. And that hits Late Strategies much worse than it does Early Strategies.
How bad will the hit be?
To answer that question requires more information than anybody has at this point, so all we have to work with are projections. The number one question is what the size of the economy will be in each future year. The number two question is what percentage of that economy will be taken by the government in the form of the payroll taxes that are used to pay for Social Security and Medicare.
The basic relationship is that the greater the economic growth, the greater the future payroll taxes. This means that the Trust Funds deplete at a slower rate, which pushes back in time any shortfalls, and because the economy is assumed to be still larger at that point and generating more payroll taxes, this reduces the size of the future reductions in benefit payments.
So any projection of what each of our individual Social Security benefits will be is only as good as the accuracy of the economic and tax rate projections. This is what is left out of most Social Security calculators, yet it is arguably the most important factor.
There is no certainty. Particularly once we get ten, fifteen or twenty years out, it is the size of the economy and the economic health of the nation that will determine the actual resources available to support retirees. If sufficient economic growth has not occurred, then all the tables of precise numbers for different Social Security claiming strategies become meaningless.
What matters most is whether the government's projections turn out to be accurate, and it should be noted that the government's baseline projection is based on a series of remarkably optimistic assumptions which over time create a much larger and more prosperous economy than what we currently have.
In the Trustee Report, the slow to no growth economy in the United States over the last decade is assumed to be a temporary anomaly that disappears, and is replaced by the higher rates of economic growth of 20 or 50 years ago.
Steadily rising wages in inflation-adjusted terms are assumed to replace the falling real median wages and shrinking middle class that the US has been experiencing for these last 40 years. And the payroll taxes that support Social Security and Medicare are assumed to rise with those real wages.
Not only is there assumed to full or close to full employment, but the 15 year trend of falling workforce participation rates (as explored here) is assumed to reverse, with an ever growing percentage of the workforce age population getting jobs – and paying payroll taxes.
An endless and large stream of highly productive, young, and fertile immigrants (both legal and "other") are assumed to come to the United States, and they and their children are assumed to support us with their large and ever growing payroll taxes.
And even if every one of those remarkably optimistic assumptions contained in the "Intermediate" scenario turns out to be true, the US government itself still projects that the ability to make full Social Security payments runs out by 2034 (absent major tax increases). This means that the last year that full payments would be made is 2033.
For our numerical table, we will use the only slightly less optimistic "High Cost" scenario from the 2015 Trustee Report. All of the key assumptions are still remarkably optimistic, in terms of a economically healthy and growing nation that reverses all of the currently negative 10, 15 and 40 year economic trends that were previously mentioned. But, the assumptions are not quite as robustly optimistic as the "Intermediate" scenario.
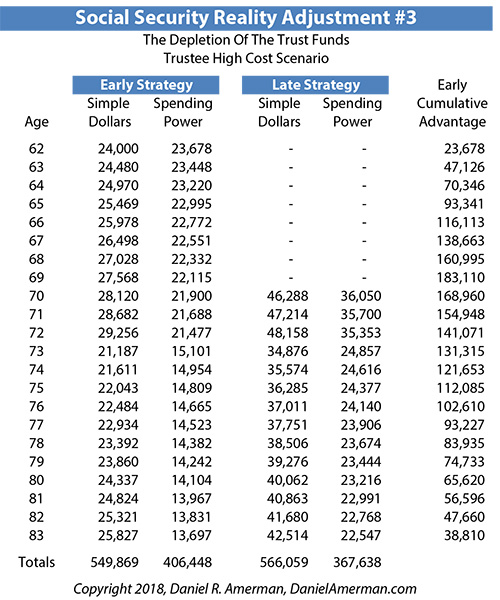
With the government's "High Cost" scenario, the Trust Funds are assumed to run out by 2030, and the last year of full payments would be 2029. Payroll taxes are assumed to be able to pay close to 71% of scheduled benefits thereafter. For someone making a decision that is effective at the end of 2018, and assuming the Trust Funds run out at the beginning of 2030, this would mean they would get three full years of scheduled Social Security payments with a Late Strategy, before their payments would be cut by 29%.
(There are lots of ways between assumed birthdays for someone turning 62 in 2018 and the assumed actual date of Trust Fund depletion within 2030 to get 3.5 to 4 years of full benefits, but that is still based on quite optimistic economic assumptions, and doesn't materially change the conclusion.)
With this scenario, annual benefits for the Late Strategy in Simple Dollar terms fall from $48,158 at age 72, down to $34,876 at age 73. When we look at Spending Power net of Medicare premium increases, then it falls from $35,353 at age 72 down to $24,857 at age 73 – and then slightly declines each year thereafter, as slowly increasing Medicare premiums prevent net Social Security payments from fully keeping up with inflation.
Now, something interesting about that Late Strategy spending power at age 73 of $24,857, is that it is reasonably close to the Early Strategy spending power at age 62 of $23,678 – which can also be seen in the graphic below.
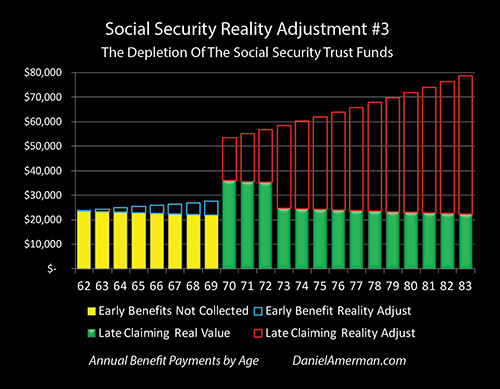
What is illustrated above is the central problem with people choosing Late Strategies when the government itself projects that it is likely to run out of the money needed to make future scheduled payments in full.
The core tradeoff is that someone gives up the certainty of the solid yellow bars in the here and now, in exchange for the alluring income that is the top of the hollow red bars many years down the road. But, as previously analyzed, most of the hollow red bars turn out to be illusions when we properly adjust for Spending Power and the linkage between Social Security and Medicare.
Worse, they may only receive their full benefits for a few years, as represented by the taller green bars, before their benefits are slashed – as required under current law – when the Trust Funds deplete, tens of millions more Boomers have retired, and payroll taxes are (as expected) insufficient to make scheduled Social Security benefit payments in full. So in exchange for waiting, based on the best information we currently have, they get a brief spike in benefits, then their benefits drop with everyone else – and they never do get most of the reward that they thought waiting until age 70 would lock in for them.
Even with a complete reversal of the economic trends of the last decade and the return of strongly positive economic growth for the United States – there is still a $38,810 Spending Power advantage to the Early Strategy over the Late Strategy when we take into account the depletion of the Trust Funds.
The depletion of the Trust Funds creates a "kink" in the blue line at age 73, which is exactly what we would expect. There is no longer the assumed smooth progression into the indefinite future that is shown with normal Social Security calculators, but a separation from the yellow line that reflects the reality of what happens when the (supposed) savings of the Trust Funds are gone, and payroll taxes are no longer sufficient to pay benefits in full.
The degree of the kink may seem less than what one would expect, but that gets to the heart of the tradeoff. More money is still more money, and the larger payments associated with late claiming will still steadily erode the cumulative advantage of early claiming over time. But the cumulative Spending Power advantage net of Medicare increases that built up over the eight years of early collections is still a quite substantial $141,000 at the time that the depletion of the Trust Funds triggers a reduction in payments. Because the monthly dollar advantage to the Late Strategy is reduced from that point forward, the erosion of the Early Claiming cumulative advantage occurs at a much slower rate. Which, given average human lifespans, profoundly changes the relationship between the strategies, and potentially our decision as well.
(There is also the possibility that higher Social Security benefits will fall more than lower dollar benefits at that time. For instance, those receiving $3,000 per month (inflation adjusted) could see a 40% or 50% decrease, while those receiving $1,000 per month might see a 10% decrease, or none at all. Or the higher benefits could be be subject to higher taxes, or more aggressive means testing, any one of which would increase the advantage to the Early Strategy more than what is shown herein.)
On a Spending Power basis, our "crossover" date where the advantage shifts to the Late Strategy is now age 88 years and 7 months. Which means that for the great majority of the population, there is no longer a tradeoff, but a double advantage to the Early Strategy. For eight straight years in their 60s they do get some money instead of no money. And on a cumulative basis they never lose that initial financial advantage even if they do live a normal lifespan – or up to 4+ years beyond that normal lifespan.
It should also be noted that while the Trust Funds sound comforting, they are much stranger than most people realize because they are entirely invested in financing the national debt. This raises the question: if the national debt isn't repaid – then how is it that Social Security benefits get paid?
There is a way, but for those with the curiosity and courage to seek that answer, be prepared "to go down the rabbit hole". Because as explored here, the real source of your security and where the Trust Funds money will come from to pay for your Social Security benefits is likely not at all what you think it is, and there is a downright toxic relationship with the national debt.
Now, it is possible that the United States could exceed the strongly positive economic growth rate that is projected in the government's "High Cost" scenario, and instead meet the even more robustly positive economic and demographic projections contained in the "Intermediate" scenario from the Trustee report. If so, then someone following a Late Strategy might get 6 years of full benefits starting at age 70, and 79% of their benefits thereafter.
Nonetheless, the advantage for someone living an average lifespan would still remain with the Early Strategy, because our adjustments for inflation and Medicare were enough by themselves to remove the advantage to the Late Strategy, and any benefit decreases whatsoever in the later years would just increase the advantage to the Early Strategy.
That said, there is little or no protection for those who choose the Late Strategy when it comes to the possibility of disappointing future economic growth.
If the economic growth rate for an aging and heavily indebted nation remains what we have actually experienced since the financial crisis of 2008 – then the results are much worse than what is shown above. Payroll taxes are lower in each year, the Trust Funds deplete sooner, and the hit to future benefits is greater.
If real (inflation-adjusted) median wages don't reverse their 40 year trend and start to grow along with a resurgent middle class – then payroll taxes will be lower, and we may see only one or two years (or no years) of higher payments being received by late claimers
If we don't see a reversal in the 15 year trend we have seen for declining workforce participation rates, then benefit payments could fall each year after the Trust Funds run out, instead of remaining level.
In closing summary:
1) Inflation is fundamental for retirement decisions.
2) Medical expenses are fundamental for retirement decisions.
3) The ability of society to actually pay for future retirement benefits is fundamental for retirement decisions.
4) To make retirement decisions that are based only on scheduled payments while ignoring those fundamentals – is to risk making an absolutely fundamental and potentially life-changing mistake.
***************************************************

Read Chapter One Of "The Homeowner Wealth Formula"
Read Chapter One Of "The Eight Levels Of Homeowner Wealth Multiplication"