
The Eight Levels Of Homeowner Wealth Multiplication, Chapter One
Winning Lotteries & Profiting From The National Debt
By Daniel R. Amerman, CFA
TweetHow would you like to buy a ticket in a lottery where there was an almost one in four chance of winning the price of an entire home? What if the consolation prize - the average outcome for buying the ticket - was to quadruple your money in ten years?
Lots of people play the lottery, or gamble in casinos. In theory - each one of those gambles could indeed lead to a quarter million dollar or so gain.
In practice, however, very few people buy winning quarter million dollar lottery tickets, or walk out of a casino with an extra quarter million in their pocket. This is because the odds are extremely low of doing so, most people can play for their entire lives and not win such a large prize. Indeed, because the odds favor the "house", as in the state governments for lotteries, or the owners of the casinos - most people who try for the big wins will steadily lose money over the years instead.
Now, there is a "catch" when it comes to having a really good chance of winning the price of a home – which is that you have to first buy that home. That means you have to comfortably live your life in a nice home, perhaps with a garden in the back yard, and maybe in a good school district as well. And after ten years, what national average homeownership statistics show us is that there is a 23% chance that your home equity will have increased by an amount that is about equal to the entire original purchase price of the home.
That is an amazing and life changing outcome - which has happened in practice for many millions of homeowners over the decades. It isn't improbable or fantastic - but is instead just an average result, that has happened over and over again.
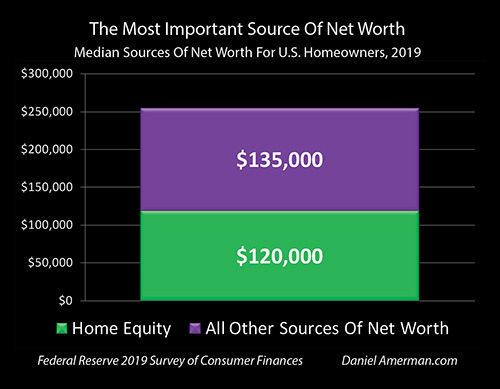
These extraordinary but average major increases in equity also explain why for the two thirds of the population who are homeowners, their home equity makes up about half of their median net worth, almost as much as all their savings, investments, retirement accounts and other assets combined (According to the Federal Reserve's 2019 Survey Of Consumer Finances).
In Book #1 in this series, "The Homeowner Wealth Formula" (link here), we examined in detail why homes have been such a good investment for so many millions of people over the decades. Using detailed historical information from almost four hundred different possible 1 to 10 year homeownership periods, we looked at the roles and importance of inflation, the compound interest formula, the multiplication and stacking that occurs when a home is bought with a mortgage, and how amortization increases both equity and safety.
Those first four levels of the multiplication of wealth together account for the great majority of the wealth creation from homeownership over the years, as well as the reliability of that wealth creation. In other words - the first four levels of homeowner wealth multiplication account for the great majority of about half of the net worth of about two thirds of U.S. households.
However, if one of the many millions of people who have become "house rich" from owning a home with a mortgage is asked about what the source was of half or more of their net worth - they aren't likely to talk about inflation, alignment with government policies, multiplying and stacking, or the compound interest formula.
Instead they are more likely to say something like "I bought when home prices were much lower, the housing market went way up and I made a lot of money."
On the face of it - that is a very accurate answer for most people. That is indeed what happened for so many millions of home buyers, again and again over the decades. But given that we are talking about the source of what is on average half of the net worth for two thirds of the population, it is likely worth digging a little deeper than that.
How accurate is that belief? How much of the very large national average increases in home equity have really come from the housing market going up, separate and aside from inflation or owning a home with a mortgage?
The Importance Of Market Changes For Home Equity
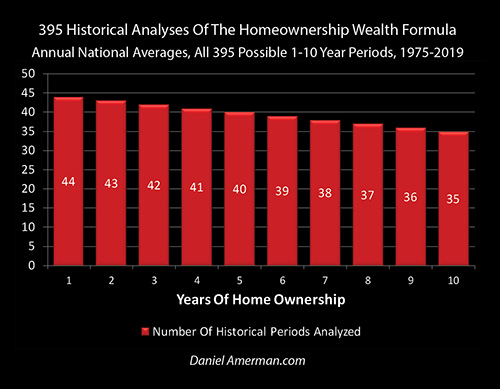
To find an accurate answer based on what history has to show us, we will begin by looking at 35 possible ten year home ownership periods between 1975 and 2019, starting with 1975 to 1985, and ending with 2009 to 2019.
When we look at national average home price changes for each of those ten year periods, using the Freddie Mac House Price Index, and also the individual mortgage amortizations using for national average mortgage rates in each starting year, as reported by the Federal Home Loan Mortgage Corporation (Freddie Mac), then we get 35 different increases in home equity, one for each ten year period.
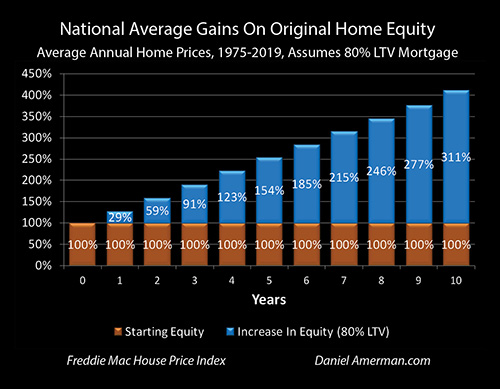
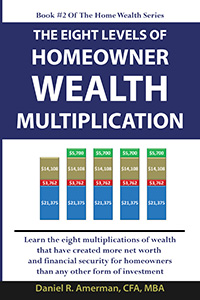
When we average the 35 ten year national average increases in home equity together, then we get the rightmost bar in the graph above. The national average outcome for homeowners in all their millions and across the decades, was to see a 311% gain in home equity, bringing total home equity to more than four times where it started.
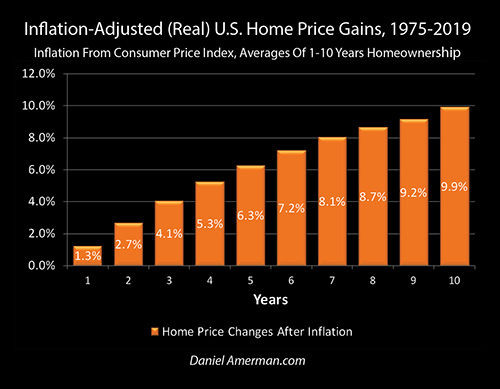
When we take that same Freddie Mac House Price Index for national average home prices in each year, and remove inflation using the Consumer Price Index (CPI-U) as reported by the U.S. Bureau of Labor Statistics, then we get the graph above. (There is much more about how this critical step is accomplished and the importance for homeowners and investors in the next chapter.)
The bottom line result is that when the inflation-adjusted home price changes for the nation are averaged together for 35 different ten year homeownership periods - the average homeowner saw their house increase in value by just under 10% in ten years.
If we compare the 10% real increase in inflation-adjusted market value with no mortgage, to the 311% total increase in home equity including both inflation and buying the home with an 80% loan to value (LTV) mortgage, then the real change in housing market values accounts for only 3% of the increase in home equity.
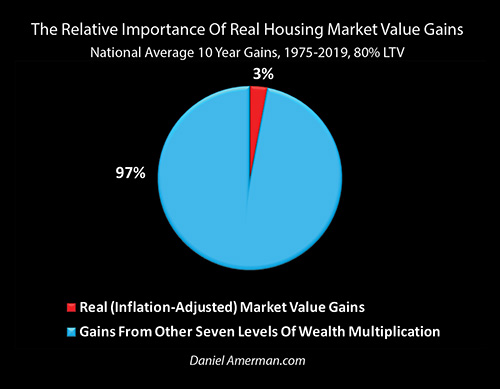
That's all. On a national average basis and over all the years, only 3% of the ten year increases in home equity have directly come from genuine increases in the inflation-adjusted value of the homes by themselves.
The other 97% all comes from the other seven levels of the multiplication of homeowner wealth.
Returning to our example from Book #1 of buying a $200,000 home using a $160,000 mortgage and $40,000 in starting home equity, the national average homeowner outcome was to see home equity grow to about $164,400 over ten years, an increase of $124,400.
If the homeowner had taken the same $40,000, and bought a smaller property or something else that went up by 10% in inflation-adjusted terms over ten years, with no inflation or mortgage, then they would have seen their equity go up by $4,000.
The $4,000 gain from the genuine increase in the market value not including inflation, is only 3% of the total $124,400 increase in home equity. To understand the source of the other $120,400 in additional net worth for the national average homeowner (or investor) over the decades - we need to understand the other seven layers of wealth multiplication, and their relationships with changes in real market value.
While the extensive historical research supporting this book is for the United States, the combination of inflation and mortgages has also created enormous wealth for homeowners in many other nations, and the same underlying wealth multiplication principles apply on a global basis.
This book is written primarily for homeowners - but everything also applies to investors who buy single family homes for rental purposes. Indeed, the research behind this book provides a uniquely in-depth look at how income property investors have historically built wealth over the decades. The dominant sources of equity gains have in practice actually been quite different than what many investors or potential investors believe.
The historical record is also quite clear that purchasing rental homes has on average over the decades produced both larger profits and more reliable profits than what is commonly understood - specifically because what is actually producing the profits and reliability is different from many people think. A better understanding of the actual underlying wealth creation engine allows for potentially much better investment decisions, whether the decision is about a home to live in or a home to rent out.
The Base For Three More Levels Of Multiplication
It is entirely accurate to say that the real change in inflation-adjusted values of homes - with no mortgage and no inflation - is directly responsible for only 3% of the average increase in home equity in ten years. However, it is not accurate to say that changes in inflation-adjusted home values are only responsible for 3% of home equity increases.
The difference is multiplication, or to be more specific - three more levels of the multiplication of wealth.
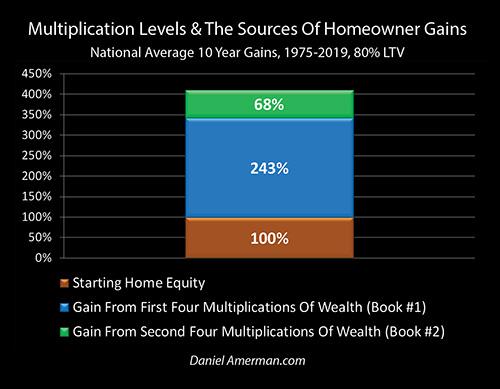
Book #1 covered the first four levels of wealth multiplication, and this Book #2 explores the second four levels of wealth multiplication. All four of these new levels of multiplication are based on changes in real market value - which is the fifth level of multiplication, if we are looking at all eight levels together.
As will be developed step by step in the following chapters, the sixth, seventh and eighth levels of the multiplication of homeowner wealth are the multiplicative relationships between real market value changes, and inflation, and the mortgage, and inflation and the mortgage in combination.
The national average homeowner experience over ten years is for these four levels to increase home equity by about 68% - so the additional levels of multiplication take the starting 10% increase in real market values for homes, and amplify them by about 7X.
That seven times average amplification of real (inflation-adjusted) home price changes has been a tremendous source of net worth for average families over the decades, but it is only an average result for ten years. When we go beyond ten years, or look at times of higher inflation, then the amplification of real market value changes for the homeowners of the nation has been 10X, or 20X, or more.
One of the biggest differences between the first and second books is the reliability of the wealth creation. The first four levels of wealth multiplication are based on government policies (low to moderate inflation), government failures (high inflation), and the financial implications of the contractual relationship between the homeowner and the mortgage lender when we do have inflation. Put together, these factors not only account for the substantial majority of homeowner wealth creation over the decades, but they are also quite reliable over the years, they aren't really market forces or gambling or speculation.
On the other hand, changes in real home values are market based, they go up and they go down, and there has been a great deal of variation over the decades. However, because inflation dominates real home price changes over time, it can actually be hard to see whether real market changes have been positive or negative.
In the next chapter, we will use historical examples, show the huge range of real market value gains and losses, and demonstrate how they can be covered over by inflation. Using that information, we will then take a look at the historical 395 one to ten year homeownership experiences, and show just what the odds have been for real market values going up or down, for one year, four years and so forth.
In Chapters 3 & 4 we will develop the relationship between the base of real market home price changes and its multipliers, the sixth, seventh and eighth levels of the multiplication of wealth.
The financial implications of these repeated multiplications are fascinating but little understood. That is unfortunate, because these wealth multipliers have created vast amounts of net worth for homeowners and investors, particularly over longer periods of time. Indeed, when we take a look at a long time homeowner who has paid off their mortgage, and assume that they currently own a national average home that they bought decades before at the then national average price - then about $70,000 of their net worth is based just on the seventh and eighth levels of the multiplication of homeowner wealth.
In practice, something that most people aren't even aware exists, has through wealth multiplication created more net worth for older homeowners over the years, than the entire $65,000 median retirement account value (for the 50% of the population that has retirement accounts).
By the time all eight levels of the multiplication of homeowner wealth are put together, we have something amazing. The best way of creating wealth over time is the multiplication of wealth. Eight levels of multiplication are much more powerful than one level, and it is indeed all eight levels working together that explain why about half the net worth of two thirds of the population is found in their home equity.
However, there is also a problem that comes with this. The "problem" - which as problems go is a very good one to have - is that the increases in homeowner wealth are coming in from so many different directions that it becomes difficult to keep track of them all. The relative importance of the factors can vary quite a bit at different times, and for someone who is considering buying a home, whether to live in or as an investment, it is really helpful to be able to understand just where the gains have actually come from, and how reliable each of the sources have been.
Chapter 5 is devoted to the solution for the "problem" and that is the creation of a wealth map that visually shows the eight levels of the multiplication of wealth, with the surface area of each source showing its relative importance. For someone who bought an average home in 1975 with an 80% LTV mortgage, their home equity would have increased by 40 times by 2019 if they had experienced national average homeownership results. A wealth map is developed to visually show where every dollar of that remarkable forty-to-one increase actually came from.
Wealth maps and the eight levels of the multiplication of wealth are used for much shorter time periods in Chapter 6. Every component of the national average outcome of home equity almost doubling in the first three years of homeownership can now be clearly seen and understood, as well as the tripling in seven years and the quadrupling in ten years.
While the great majority of the American homeownership experience has been very positive - that has not always been true. Chapter 7 is entirely devoted to negative real market value changes, with a particular focus on the "worst of the worst", for those who bought homes near the peak of the housing bubble and were then hit by the financial crisis of 2008. The ability of the first four levels of wealth multiplication to effectively overpower real market value losses 80% of the time is also examined, as well as the 100% effectiveness in doing so on a national average basis for years not involving the peak of the bubble or the aftermath of the financial crisis.
Chapter 8 is all about the full details of eight different ways of "winning the lottery". Eight wealth maps show eight different ways the eight levels of the multiplication of wealth historically came together to produce a national average outcome of home equity increasing by about the original purchase price of the home, in just the first ten years of homeownership.
The final two chapters of the book take all that was learned through the intensive study of decades of information about how homeowner wealth was actually created in practice in the past, and use that information to explore some possibilities for the future.
Chapter 9 focuses on the inflationary dangers that are created by a very large national debt, and considers three scenarios for low, medium and high inflation that could end up being the result of the soaring national debts in the United States and other nations. The scenarios begin with looking at how higher rates of inflation benefit the government even while financially devastating savers.
Focusing just on inflation and the first four levels of the multiplication of wealth, the future wealth maps take that same information about the national debt, and show how to take that destruction of the value of savings and flip it into some of the most lucrative increases in home equity that we have ever experienced, as inflation is multiplied and turned into wealth. Indeed, assuming a 9% annual rate of inflation over the long term, we will track the exact dollars to map out how an eventual 92.5% destruction of the value of the dollar can be flipped into a 65 to 1 increase in home equity.
As established in Book 1 and further developed in this Book 2, the historical evidence is overwhelming that owning a home with a mortgage is the single best defense against inflation that is available to the average person. This is critical information for homeowners - and it is also critical information for investors who are concerned about the national debt and are seeking protection from inflation.
Chapter 10 adds in the factors of a growing population, as well as very low interest rates and the increasing concentration and density of population in some areas of the country. If these long term trends increase real market values over the coming decades at the same time that the national debt is sending inflation rates jumping upwards - then there is a multiplication of a multiplication that reverberates through the levels of the multiplication of wealth.
This effective multiplication of the impact of the growth in the national debt times the impact of the growth in population has the potential to set off an upwards explosion in homeowner equity. As can be seen in the final wealth map, the second and third levels of wealth multiplication from Book 1 combine with the seventh and eighth levels of wealth multiplication from this Book 2, and those four wealth multipliers all acting together could create what would be by far the largest profits for homeowners (and investors) that we have ever seen, with $45,000 becoming $4.5 million over the long term in the final scenario. This could make the buy-versus-rent decision the single most important financial decision of a lifetime, perhaps making the difference between prosperity and poverty for millions of people.
Before we get to the eight ways the homeowner “lottery” has been won in the past, or mapping out the dollar mechanics of how a soaring national debt can create explosive increases in home equity in the future, we need to first develop and understand the fifth through eighth levels of the multiplication of homeowner wealth. We will start in the next chapter by learning how to see through an illusion that fools most homeowners (and most investors too).