
The True Cost Of The National Debt For Retirees - 26 Years Of Lost Safety For Social Security & Medicare
By Daniel R. Amerman, CFA, MBA, BSBA
TweetWhen the U.S. national debt rapidly doubled in recent years - decades of financial safety were lost for the Social Security and Medicare programs. Which could have life changing consequences for the average person in retirement.
Interest payments and retirement benefits effectively come out of the same pot. So for any given level of taxes - any additional money that has to go for interest payments on a larger national debt is that much less money that is available for retirement benefits.
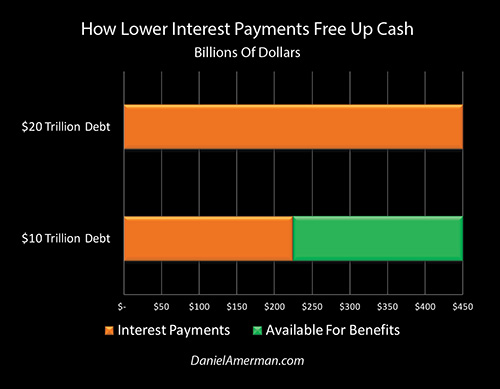
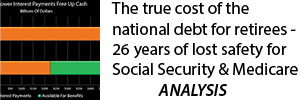
The current annual interest paid on the national debt of $20 trillion is about $450 billion. If the debt were $10 trillion, and interest rates were the same - annual interest payments would be $225 billion. Which, as shown in the green area above, would free up $225 billion a year for additional Social Security and Medicare payments, or for tax or deficit reductions.
The other issue is one of safety margin. Money that is used for one purpose can't then be used for another purpose.
So, if the national borrowing capacity hadn't been quickly used up by the huge deficits run by the government during and in the aftermath of the financial crisis - how many years could it have covered the shortfalls for Social Security and Medicare, allowing payment in full with no changes in eligibility or benefits, and without raising taxes?
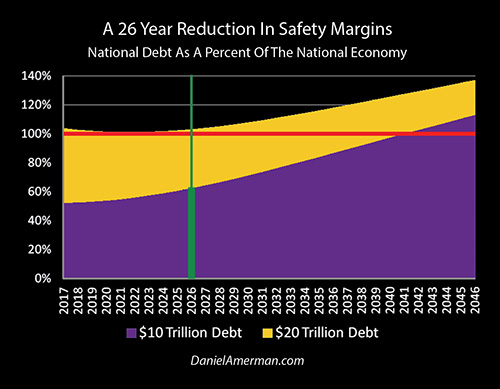
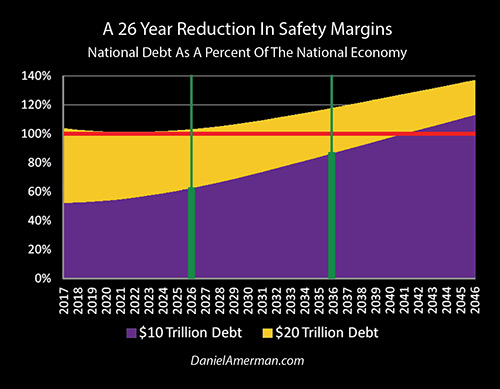
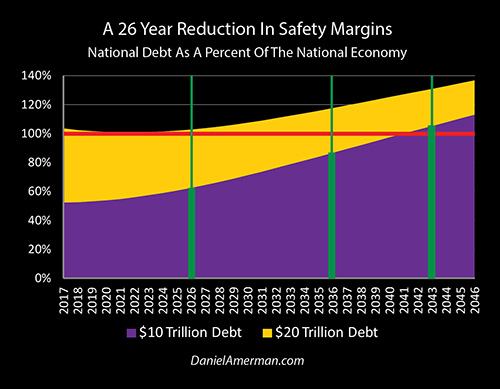
As shown in the graph below and developed in this analysis - the true cost of the rapid doubling of the national debt is 26 years of lost financial safety for Social Security and Medicare. Which means that tens of millions of current and future retirees who are currently at risk - would not have been at risk until 2043.
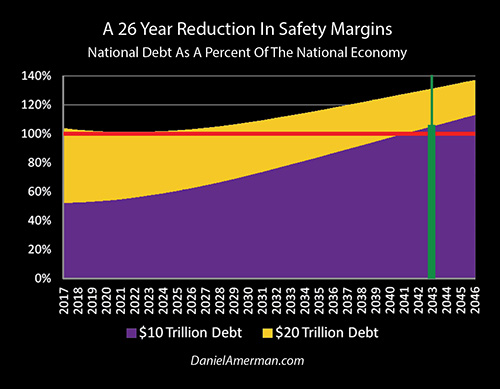
The orange zone in the graph above looks at our $20 trillion national debt not in simple dollars, but in terms of affordability. What it measures is the size of the total national debt compared to the size of the economy. Nations enter the danger zone when they pass the 100% red line, which is a debt larger than the economy.
Because of the rapid doubling of the debt, the starting point of the United States in 2017 is above that red line, with a national debt that is larger than the size of the national economy.
The purple zone shows a simple "what if" scenario. What if the national debt had not quickly doubled, and what if it were currently $10 trillion instead of $20 trillion? How long could we have paid benefits in full before we reached the same place that we are today?
As shown, if we had started with half the debt - the purple zone would not cross the red line into the danger zone until 2041. And as marked with the green line, the United States would not be as indebted as we are now until 2043. Even with paying every dollar of Social Security, Medicare and Medicaid benefits on schedule and as promised, and even without raising taxes but just borrowing the difference, the United States would have been in better financial shape over those entire 26 years than it is today.
It is likely to become increasingly difficult in the years ahead for the United States to pay for the combination of Social Security and Medicare, interest on the national debt and general government spending. So the farther out in time we go, the more at risk we are of having the eligibility and retirement age rules change, the more we risk losing some of the purchasing power of our Social Security benefits, and the more likely it is that there is a reduction in what Medicare covers and how much it pays.
If you are counting on Social Security and Medicare in the mid to late 2020s - then you are currently at risk. The risk is much greater in the 2030s. The risk is greater still in the 2040s. And most people are aware of this, on at least some level.
What is missing from the dialogues on the national debt and retirement benefits is that those are not two separate issues - but are two parts of the same issue. The personal cost to you of the rapid doubling of the debt is the lost retirement security which you could have otherwise enjoyed in the 2020s, 2030s and 2040s. The difference could end up changing your day to day standard of living and entire life during those decades.
If voters truly understood the direct relationship between the national debt and their future personal standards of living - elections results might be very different than what they have been. If the average person planning for retirement fully understood this relationship - they might be making some quite different decisions today.
Knowledge is power, and much of the past and potential future growth in the national debt is based upon people not understanding how it will impact their personal lives. The goal of this analysis is not just to give you a better understanding of the past - but to give you the information needed to make better and more informed decisions in the future.
Isolating The Doubling
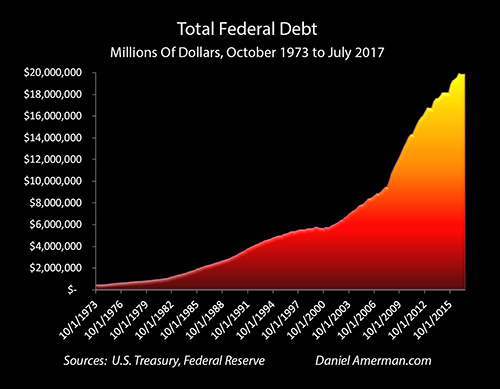
During a time of economic distress the national debt did quickly double, as can be seen above. Per the Treasury Department, the total United States national debt was $8.8 trillion on January 1st, 2007, and it was $17.6 trillion on January 1st, 2014.
The financial impact on all of our futures was enormous - but it is generally difficult to fully understand or quantify. The only way to do this is to be able to link together economic growth, tax rates, interest rates, inflation, and the coming escalation in retirement benefits. Which is, well, complex.
A solution is to simplify by using two comprehensive financial and economic analyses that differ in only one way - the size of the national debt.
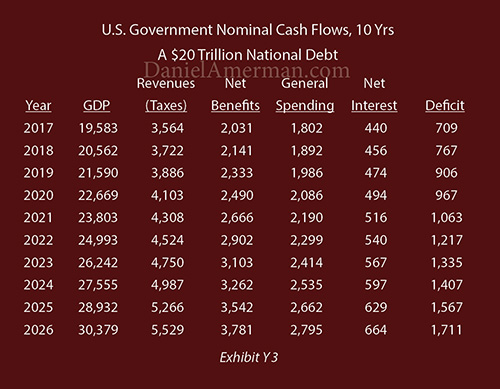
The very conventional economic model used above is based upon our current situation, which is a debt that was $19.6 trillion as of the end of the 2016 fiscal year, and is a (rounded) $20 trillion national debt as of the late summer of 2017. The average interest rate paid on the federal debt is about 2.25%. So the first year interest is $440 billion. We take taxes, subtract benefits (Social Security, Medicare and Medicaid), subtract general government spending, and then interest, and we get the federal deficit in each year.
The exact assumptions are available in the methodology and schedules page. The model is very close to that used by the Congressional Budget Office (CBO), and includes 2% real economic growth and 3% inflation.
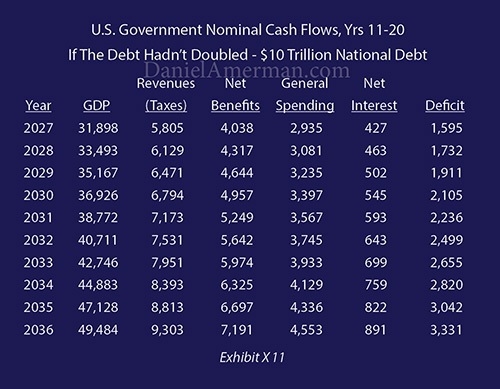
Of particular importance is the benefits column. The federal government has just recently started paying more on Social Security, Medicare and Medicaid each year than all other (non-interest) government spending combined. And these costs are expected to almost double over the next 10 years, as ever more Boomers retire (the benefit numbers are also derived from CBO projections). Which is enough to send annual deficits soaring upwards, rising from about $700 billion in the first year, to $1.7 trillion in the tenth year.
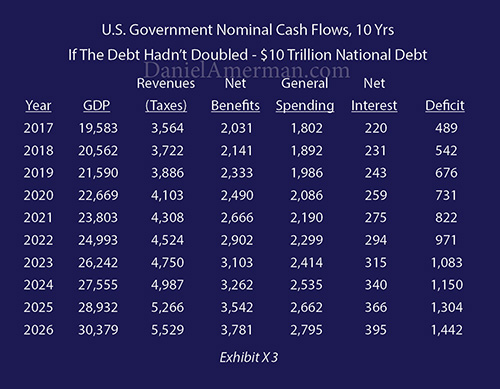
The "what if" scenario above examines what happens if the debt hadn't quickly doubled. Everything else is just the same: identical economic growth, identical taxes, identical benefit payments and identical general government spending. The sole difference is the starting national debt is "only" half, or $10 trillion as of the summer of 2017. With an identical average interest rate on the federal debt of 2.25%, the interest expenses drop by $220 billion in the first year, and there is a corresponding reduction in the federal deficit to less than $500 billion.
(To help avoid confusion, a dark red background is used for the current $20 trillion debt scenario, and a dark blue background is used for the "what if" $10 trillion debt scenario. The first year interest is based on an ending national debt of $9.785 trillion for the end of the 2016 fiscal year.)
Growth In The National Debt
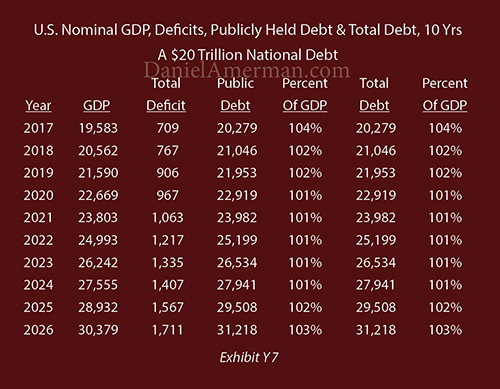
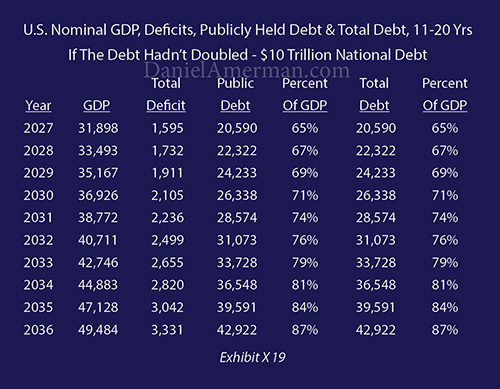
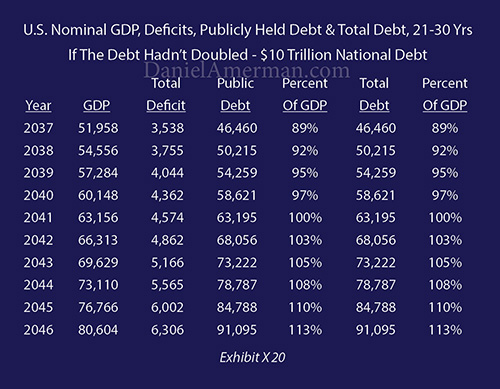
If we start with a $19.6 trillion national debt at the end of the 2016 fiscal year and run the $718 billion deficit calculated in the cash flow schedule (Y3), then we end up with the $20.3 trillion debt in the first line of the schedule above. If we divide that by the estimated GDP for fiscal year 2017, we get a ratio of 104%. So, the national debt is larger than the national economy, which is problematic.
As the deficits grow rapidly with the combination of surging benefits and increasing interest payments - the debt climbs rapidly, to over $30 trillion in ten years. There is nothing radical in this projection, but rather a roughly $10 trillion increase in about ten years is "baked" into most long-term projections, precisely because of what is coming with Social Security and Medicare.
Seeing The "Race" That Determines Retirement Security
To see the true cost of the rapid doubling of the debt, we need to learn to see the underlying economic reality - which is that retirement security is never guaranteed, but is rather a long-distance race between two runners. The first runner is the Economy, and the second runner is Retirement Benefits.
It is the wealth of society that determines whether benefits can be paid in full - or not. We conventionally measure the wealth of society through using Gross Domestic Product (GDP). A certain percentage of the projected GDP is assumed to go to federal taxes (this analysis uses CBO assumptions), which sets the money available to pay for everything else, including both retirement benefits and interest payments on the national debt.
Those who study these issues have known for many years that the race would grow problematic starting in the 2020s, as the Retirement Benefit runner would start to really speed up with the increasing Social Security expenses of the Boomers, and the decreasing ratio of workers paying taxes to retirees collecting benefits. Then in the 2030s and 2040s the Retirement Benefit runner is expected to continue to speed up as increasing numbers of Boomers reach their late 70s and 80s, and Medicare expenses surge upwards.
So the time was coming when the Retirement Benefit runner would be going much faster than the Economy runner, whether the national debt had doubled or not.
As shown above, even if the debt had started at half its current size - we were likely on the path to a $20 trillion national debt anyway. Paying for the coming surge in benefits is just plain expensive, there is no getting around it. The problem isn't having a debt of close to $20 trillion, because we would have been there anyway by 2026.
But - this is a race between two runners, both of which are moving.
Something governments have in common with households is that it isn't so much what you owe that matters, but rather how much is coming in versus how much is going out. A $25,000 debt is staggering for someone making $25,000 per year - but less important for someone making $75,000 a year, and is comparatively minor for someone making $250,000.
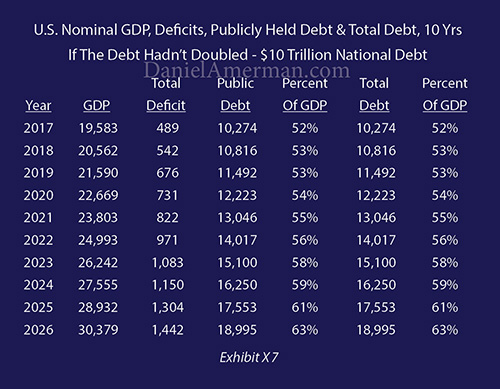
If we start with an economy that is twice as large as the national debt, and that economy is growing at a total of 5% per year (2% real growth and 3% inflation), then the economy would have grown to $30 trillion by 2026 - making a $19 trillion debt much more manageable, as well having a much greater ability to make retirement benefit payments, because of the much larger taxes from the larger economy.
The relationship that is the race can be seen graphically above. Yes, the purple zone is trending upwards because of the greater speed of the Retirement Benefits runner, and yes, the debt is up by almost $9 trillion - but the economy is up by over $10 trillion. As shown on the green line, a national debt of $19 trillion is "only" 63% of that larger economy, and therefore far more affordable for the nation.
So, if the debt hadn't doubled, then in terms of affordability the nation would still be in far better financial shape in 2026 after paying for ten years of rapidly escalating retirement benefits in full than it actually is now in 2017.
The Next Ten Years Of The Race
If we go out another ten years, then benefits almost double again, as shown in the cash flow schedule above. We know this is coming. It isn't just the Boomers retiring, but their growing older in retirement, with ever increasing medical costs.
So by 2036 the cost of retirement benefits is up to over $7 trillion per year. However, the benefits are not being cut, but are being paid in full while entirely keeping up with inflation. Everyone is getting every dollar, but the price is that this is now creating a $3.3 trillion annual deficit, all of which is being borrowed.
Those multi-trillion dollar annual deficits are sending the national debt rapidly upwards, and even with a much lower starting national debt - we would still be over $40 trillion in debt in 20 years.
That sounds like a great deal of debt - and it is a lot - but with even 2% annual real growth and a 3% rate of inflation, the economy (GDP) would have increased to almost $50 trillion in those 20 years.
The higher the GDP - the greater the tax revenues, all else being equal. And a debt of $43 trillion versus an economy of almost $50 trillion is "only" 87% -which is still much better than our current total of over 100%.
As can be seen in the graphic summary of the race above, the purple line is still rising fast, the Retirement Benefits runner is getting much faster than the Economy runner, and the gap is closing. Our national debt / GDP ratio goes from 52% for fiscal year 2017, to 63% for 2026, to 87% for 2036. The Retirement Benefit runner is faster than the Economy runner and the gap will slowly close, there is no getting away from that (unless there is a higher economic growth rate or a slower retirement benefit growth rate).
But the key is that when the Economy is much larger than the national debt - it has a big head start. And the Economy is (hopefully) not stationary, but it is also a runner, and moving as fast as it can. What the size of the starting national debt determines is how big of lead the Economy starts with, and how fast it runs.
And if the Economy runner has a ten mile head start, and it runs faster because of much lower interest payments - then it can take a very, very long time for the faster Retirement Benefit runner to catch it.
Catching The Economy Runner
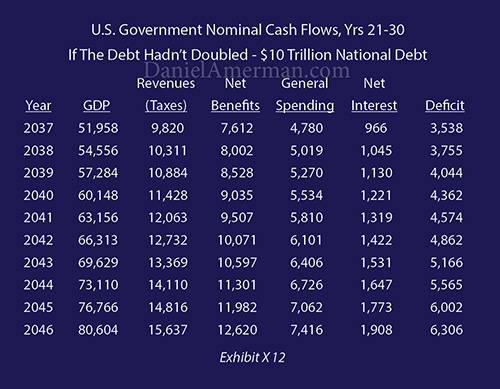
If we go out to 2043, then paying out over $10 trillion in retirement benefits for two consecutive years takes us to the place where there is a $5 trillion annual deficit. This means that almost half of benefit payments are being subsidized by new borrowings.
It is that $5 trillion deficit in 2043 that finally pushes the national debt to the point where it equals 105% of the national economy. Which means that by 2043, even if the debt hadn't doubled, we as a nation would still have ended up in the same mess that we are currently in in 2017.
The purple zone does intersect the red danger line in 2041 - and by 2043 we would finally reach the same place that we are starting at now. With a starting debt a little more than half the size of the economy - and half the interest payments - then the Retirement Benefit runner still does eventually catch and pass the Economy.
But - we would have had those 26 years.
And even afterwards, in 2043 - we would have been in much better shape with the purple zone, than we would be in 2043 with the orange zone and our current situation. Meaning much more forgiving conditions for the tough decisions that will need to be made in the 2040s, 2050s and beyond when it comes to retirement standard of living and health care.
26 Years Of Lost Retirement Security
It is only when we understand this reality, how things really work, that we can see the true cost of the rapid doubling of the national debt. We took that entire "ten mile" lead - and gave it away, to try to solve a different issue. And in the process, we effectively tied the shoelaces together for our Economy runner, by doubling the interest payments on the debt.
The moment that choice was made - the terms of the "race" that would govern the ability of the economy to pay for retirement benefits in future decades were turned upside down.
There is no longer a "lead" at all, let alone one that could last for a quarter century. So the runners are starting side by side. And the Retirement Benefits runner is just plain faster than the Economy runner, particularly when we take into account the burden of the higher interest payments.
In many cases, we are told that we don't need to worry about how large the national debt is. Or about whether we should be financially planning for ongoing reductions in (inflation-adjusted) Social Security or Medicare benefits. And of course, there are few connections made between the size of the debt and the amount of our future benefit payments, those are almost always treated as being two entirely different subjects.
But even if the message from the heart of the political/financial establishment is "don't worry / don't think" - the underlying issue is readily understandable. If the national debt has exploded upwards to what is an almost incomprehensible level for most people, and the same nation will simultaneously be grappling with how to pay much higher Social Security and Medicare benefits to a rapidly growing population of Boomer retirees, and these are happening at the same time - how could the two subjects possibly be separate?
What is missing is the specifics - and an understanding of the "race". The full long-term damage that the rapid doubling of the national debt caused is not intuitive for most people, and the figure of 26 years might seem shocking.
What is not generally understood or taken into account is what is developed in this analysis - the knowledge that an economy which is twice as large as the national debt and is itself growing each year - takes a very long time to catch. There used to be a huge safety margin for Social Security and Medicare, it was much larger than what might seem intuitively obvious to most people - and it is now gone.
Meanwhile, we all have our own "races" and our own "finish lines".
How much of our own race, our time in retirement and our standard of living in retirement, will be run while the economy can fully pay for all of our benefits? Will we (or our spouses) cross the "finish line" with the retirement benefits safety net still intact?
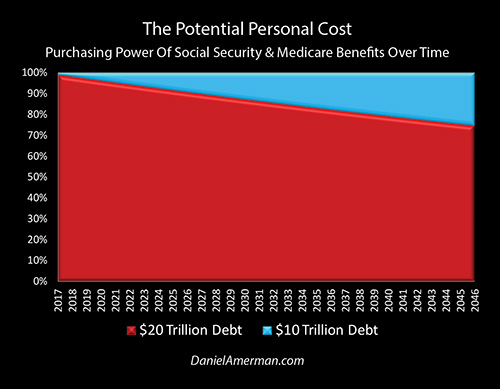
Or, as illustrated above, will we face years - or even decades - of slowly losing the race? Of seeing the purchasing power of our Social Security payments slowly declining, while what Medicare covers and how much it will pay is also slowly diminishing?
There is of course tremendous variation in each of our individual "races", depending on our age, health, financial situation, and other factors.
But what we do know - is that the terms of tens of millions of personal "races" over the coming decades all changed when the debt quickly doubled and a potential 26 year head start for the economy was quickly given up.
Tens of millions of people who might have gone through retirement and reached their personal "finish lines" with their retirement benefits still intact the entire time - are now at risk of not doing so.
The true cost of the doubling of the national debt is the lost opportunity of 26 years of an entire nation receiving Social Security, Medicare and Medicaid benefits in whole, without any further increases in the retirement age, without losing any purchasing power to inflation or program changes - and without any major tax increases.
That is 26 years of paying out what we ultimately can't afford, without increasing taxes, and covering the difference by just "running up the tab" and borrowing the money.
A tab that can no longer be run up in the same way - because we already did that between 2007 and 2014.
It does not mean that we would have necessarily taken that approach. Different choices could have been made with benefits and taxes, and we would not have necessarily run up the debt. But all of those choices would have been easier than what we are now facing, because the safety margins would have been so much higher.
(A fuller set of schedules and graphs for both scenarios is available on the methodology and schedules page.)
Moving Parts, Interest Rates & Social Security Decisions
As households, we know perfectly well that the cost of buying one thing today is that the money used is no longer available for buying something else in the future. If we decide to fly the family to the Caribbean for a vacation this year - then that same money (whether from savings or credit cards) cannot also be used to purchase a boat next year.
Governments are far more complicated, and that complexity creates room for deception by politicians and those who further political agendas. There is an illusion of "free money", and politicians can massively borrow to spend today, while solemnly assuring voters that Social Security and Medicare are untouchable. They can claim that the spending decisions now (or in the past) are not related to the financial security of retirement benefits in the future.
In this analysis, we used a major simplification to cut through multiple layers of complexity, in order to demonstrate that there is no "free money" for governments either, and there is indeed a direct connection between the size of the national debt and future Social Security and Medicare benefits.
This simplification involved "freezing" the rates used for interest, economic growth, inflation, taxes and retirement benefits, and then changing only one variable, which is the size of the starting national debt. With that change in only one number of "input", we then calculated one number of "output" - how long could we have paid Social Security, Medicare and Medicaid in full before reaching the same relative level of indebtedness that we are starting at today?
In the process of reaching our answer, we established that there is not only a relationship, but that it is much stronger than most people would likely think - once we take into account not only the debt, but the "race" and the critical factor of a growing economy.
In practice, the chances are that economic growth, interest rates, inflation, taxes and actual retirement benefits are likely to follow different paths than what is commonly assumed today. And whatever they turn out to be, the particular combination of the "moving parts" - is likely to be what determines our collective standard of living in retirement over the coming decades. (A research report on how these "moving parts" can change retirement and investment decisions is linked here.)
Financial planning for retirement usually has two main "pillars", with one being the government benefits of Social Security and Medicare, and the other being retirement savings. The issue is that both sources of retirement security are profoundly impacted by the national debt and all the other "moving parts" - but yet, the routine is to completely ignore these factors.
There are numerous decision aids for helping people to determine what age they should start collecting Social Security benefits. The current regulations are complex, and there are lots of numbers, so there is a veneer of great sophistication.
Unfortunately, what will actually determine likely benefits down the road is almost always being left out. When the national debt doubled, benefits claiming decisions also needed to change in many cases. It is the "race" between the Economy runner and the Retirement Benefits runner that will determine actual future payments. And a seemingly highly sophisticated analysis which does not take those factors into account - is likely to be wrong.
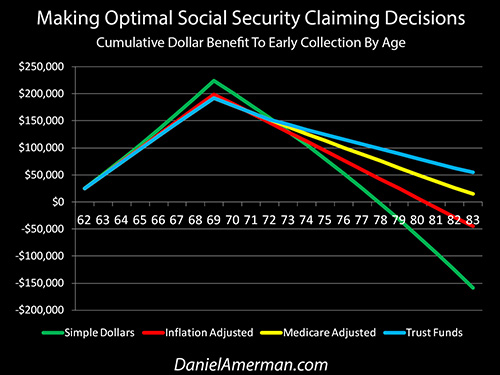
The four stage analysis linked here takes a look at the Social Security claiming decision using a series of increasingly sophisticated tools. Each time a level of sophistication is added - reflecting what will determine the purchasing power of net benefits in the real world - the optimal age at which to begin collecting Social Security can change as well. Which means that the age when retirement begins - and the standard of living and financial security in retirement - can also change.
If benefits are likely to be lower down the road than what we are hoping for - then standard of living and financial security in retirement become ever more dependent on the other pillar, that of retirement savings. And something that would be tremendously helpful for retirement savers is to earn higher interest rates.
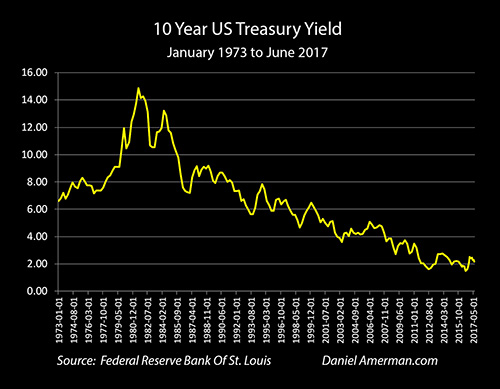
A key factor that was "frozen" in this analysis was to keep interest rates at their current levels, which are in the lowest range in modern history, as can be seen above. If rates rise like so many retirees have been counting on - then increasing interest payments mean that the national debt rises that much faster, and the day moves forward when retirement benefits are likely to be cut substantially.
As covered in the analysis linked here - there is a profound conflict of interest between a heavily indebted federal government and the needs of retirement savers.
So when the national debt doubled - it didn't just change likely future Social Security and Medicare payments, but it also transformed retirement investments. Indeed, the impact on retirement savers is even greater than the impact on beneficiaries. Which means that any retirement financial planning that did not change with the doubling of debt, and which does not take these factors into account - may turn out to be quite mistaken.

The future national debt, future Social Security and Medicare payments, and future interest rates are all tightly interlinked. When the national debt rapidly doubled - then the future changed for retirement benefits, and so did the future for interest rates and retirement savings.
There is an old saying that "you may not be interested in War, but War is interested in you". Someone may have no interest in wars, or may be fervently opposed to the existence of wars at all, but that doesn't change reality if they currently live in Syria or Afghanistan, or if they lived in Europe during World War II. Reality is what it is, and war is still likely to dominate many aspects of people's lives - including their standard of living and personal security.
When it comes to retirement financial planning, let me suggest that you may not be interested in the National Debt - but the National Debt is interested in you. If one doesn't have even the slightest interest in the national debt, or see the relationships - that doesn't matter when it comes to results. Reality is what it is, and the national debt is still likely to have a major influence over the coming decades when it comes to the purchasing power of both our retirement benefits and our retirement savings.
The more challenging the future becomes, then the greater the need for better decisions, and the more important knowledge becomes. Hopefully this analysis has helped you expand your knowledge of these vital issues.
 What you have just read is an "eye-opener" about one aspect of the often hidden redistributions of wealth that go on all around us, every day.
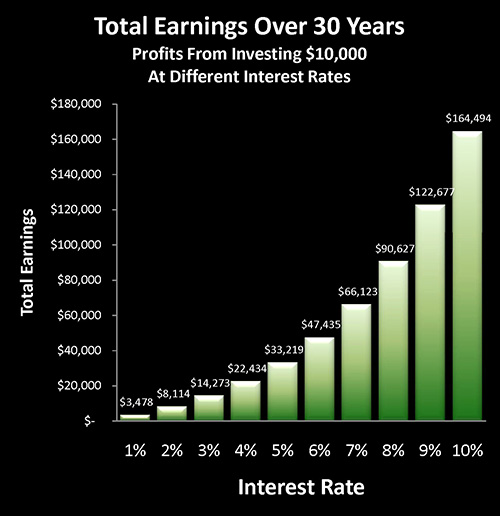
A personal retirement "eye-opener" linked here shows how the government's actions to reduce interest payments on the national debt can reduce retirement investment wealth accumulation by 95% over thirty years, and how the government is reducing standards of living for those already retired by almost 50%.
Much has been written about a $150,000+ advantage to waiting until age 70 before collecting Social Security. However, as explored in the analysis linked here, once we "raise our game" a bit, and use a more sophisticated type of analysis than some of the simplistic Social Security decision aids in wide circulation ─ all of that advantage can vanish.
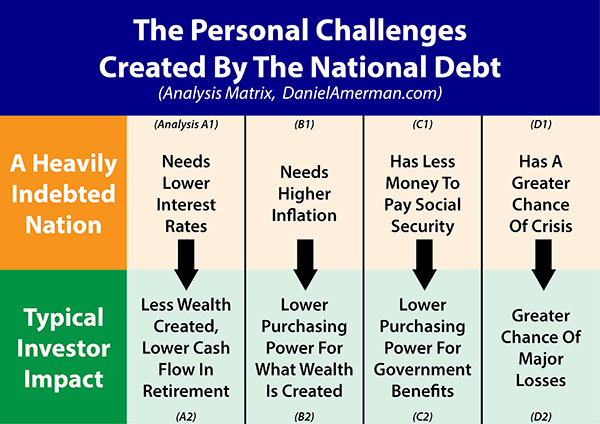
The U.S. national debt is likely to change our daily lives in multiple ways over the coming decades, some of which are little understood by savers and investors. As shown in the first row of analyses in the matrix which is linked here, heavily indebted nations have major challenges when it comes to interest rates, inflation, financial stability and the ability to make Social Security and Medicare payments in full. As is examined in the second row of analyses, each of those national challenges can directly translate to life-changing personal challenges as well.


If you find these "eye-openers" to be interesting and useful, there is an entire free book of them available here, including many that are only in the book. The advantage to the book is that the tutorials can build on each other, so that in combination we can find ways of defending ourselves, and even learn how to position ourselves to benefit from the hidden redistributions of wealth.