
Methodology & Schedules
The True Cost Of The National Debt For Retirees - 26 Years Of Lost Safety For Social Security & Medicare
by Daniel Amerman, CFA
The schedules for this analysis are a specialized and simplified use of the more sophisticated and complete analyses used in the three volume research report linked here, "How The National Debt & Surging Benefits Will Transform Retirement Planning". The assumptions and the model, as well as the impact on retirees are described in greater detail in the preceding link.
The core assumptions are as follows:
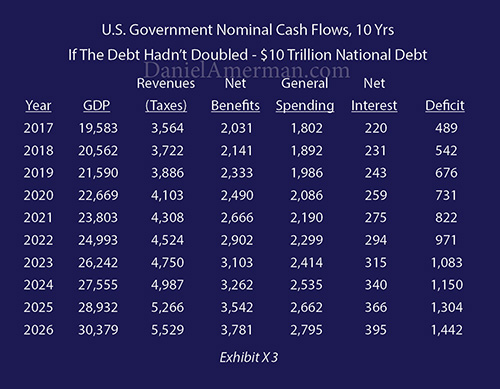
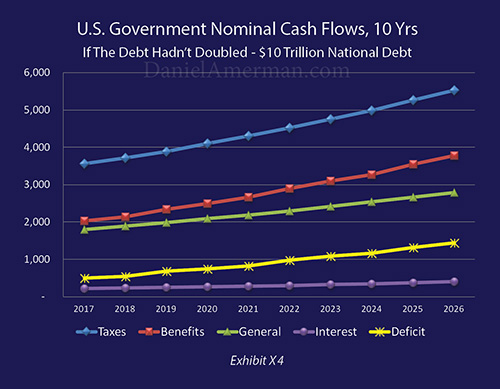
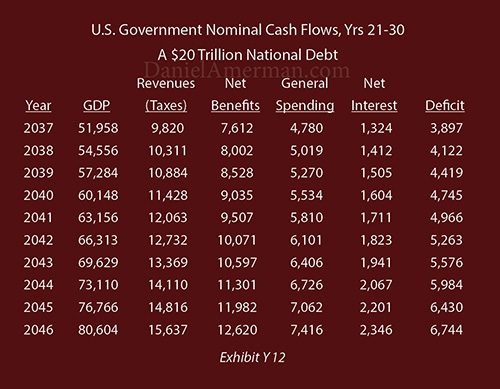
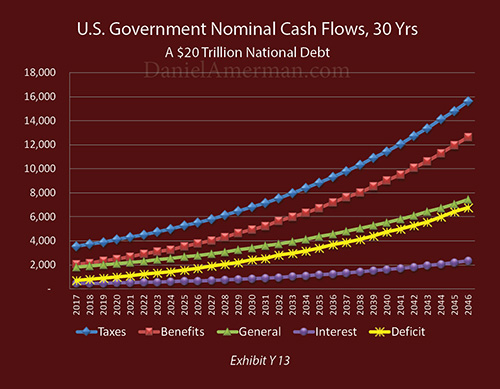
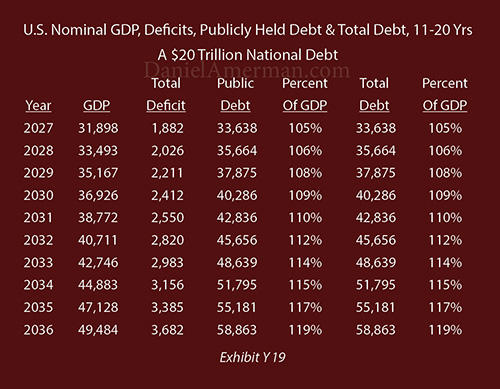
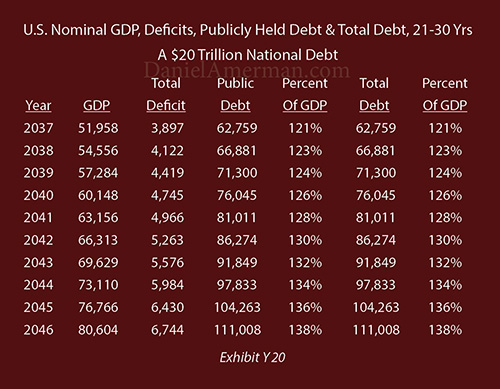
1) Real economic growth is assumed to be a level 2% in each year.
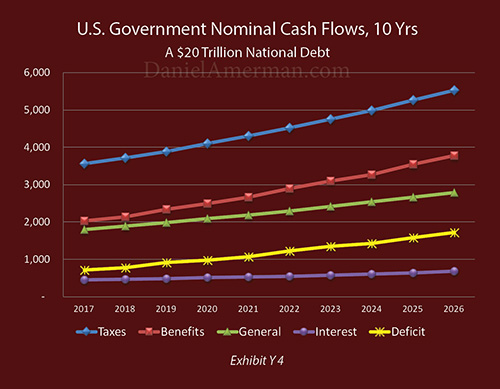
2) Inflation is assumed to be a level 3% in each year, and Social Security and Medicare payments for each individual are expected to increase with the rate of inflation.
3) Tax rates as a percent of GDP are the same as those used in the Congressional Budget Office's Long Term Outlook.
4) The increasing expenses for Social Security, Medicare and Medicaid with an aging U.S. population are derived for each year in dollar present value terms from the Congressional Budget Office's Long Term Outlook, and then calculated independently in a manner that allows for modeling changes in the rate of inflation, deviation in benefit payouts from the rate of inflation, and other factors.
5) Interest expenses on the debt are based upon the Treasury Department's reported average interest rate on the national debt as of July of 2017 (rounded).
6) All other government spending beyond benefits and interest expenses are kept level at 9.2% of GDP, per the CBO LTO number for fiscal year 2016.
(Return link to main analysis)
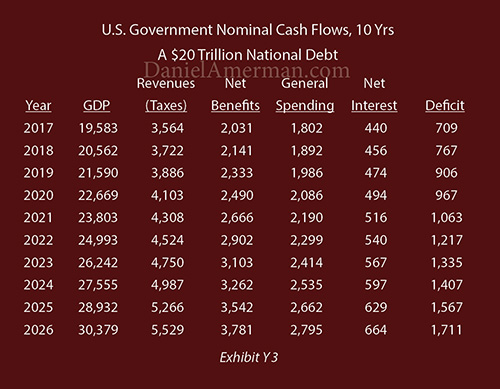
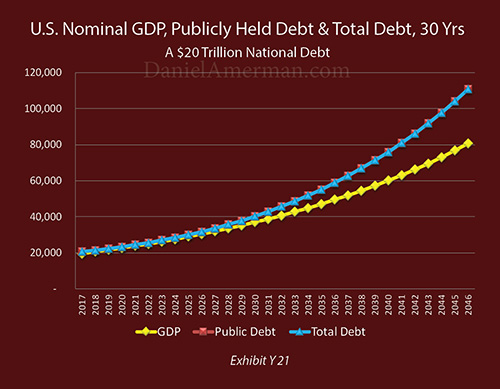
Deficit & Debt Schedules, $20 Trillion Starting Debt
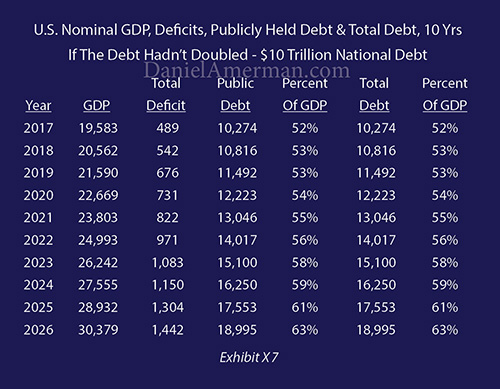
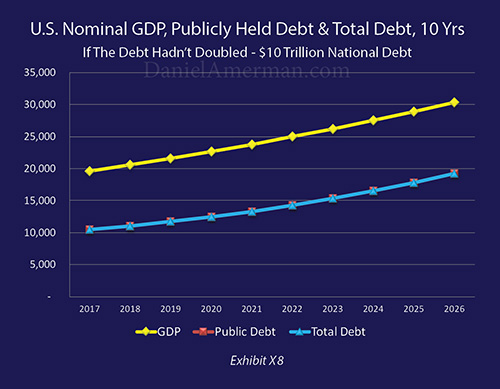
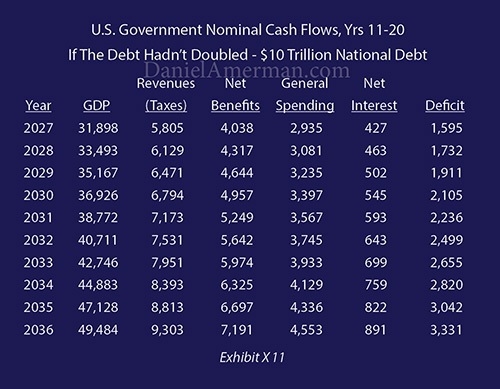
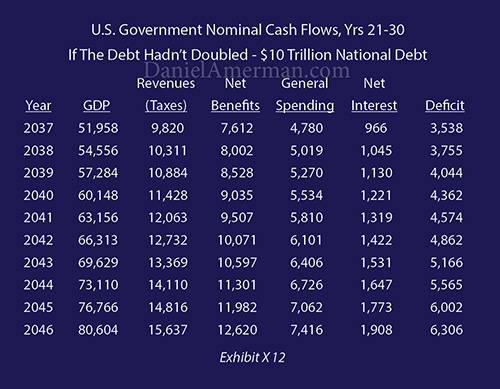
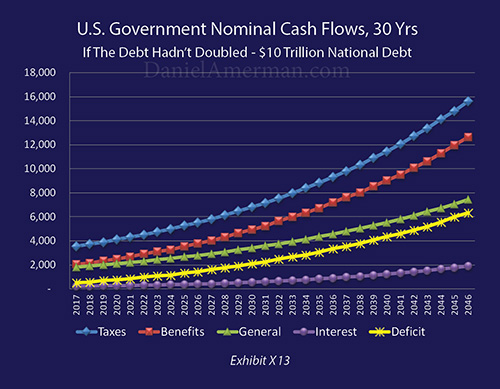
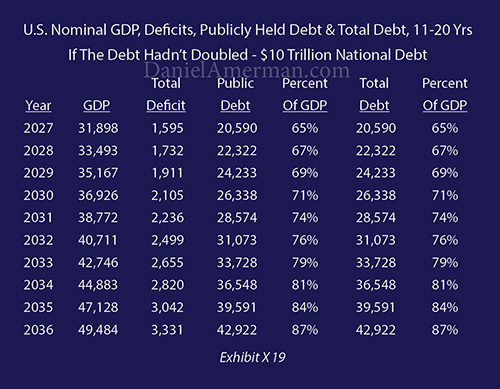
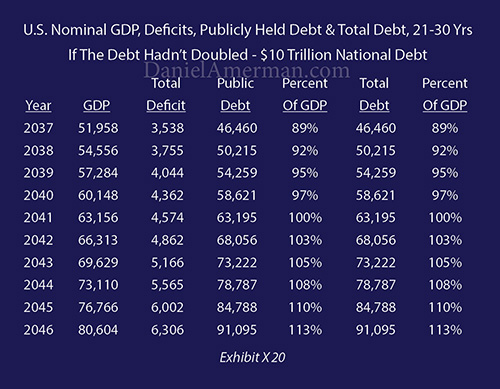
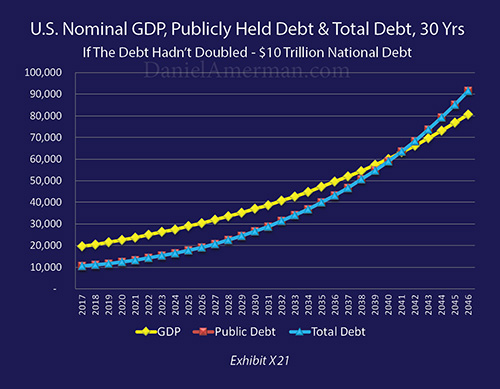
Deficit & Debt Schedules, $10 Trillion Starting Debt