


How The National Debt & Surging Benefits Will Transform Retirement Planning
Research Report With Three Stage Analysis Of The Implications For Individual Retirees, Investments & The Nation
This research report explores the far-reaching implications of how a high national debt and surging Social Security & Medicare benefits combine to create future risks and opportunities across all categories of investments which are quite different from the past, as well as the transformative impact over time on savings & benefits for individual retirees.
Volume One: Video Presentation (5 DVD set)
Volume Two: Core Analytics (Printed Manual, 592 pages)
Volume Three: Supporting Research & Analysis (Printed Manual, 292 pages)
Research Report Overview
The National Debt & The Surging Costs Of Social Security & Medicare (Introduction & Module A)
Holistic Retirement Planning (click here if you've already read the Introduction)
A Three Stage Analysis Delivering Intuitive Understanding
First Stage Analysis: The Nation
Second Stage Analysis: Individual Implications
Third Stage Analysis: Investment Implications
The Volumes, Modules & Scenarios
Module A Topic Outline (Scenarios AA To AD)
Module B: Testing Interest Rates (Scenarios BA to BC)
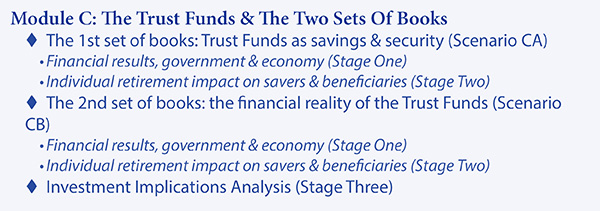
Module C: The Trust Funds & The Two Sets Of Books (Scenario CA to CB)
Module D: Five Ways Of Staying Within The Constraints (Scenarios DA to DE)
Module E: Faster Growth (Scenarios EA To EB)
Module F: Slower Growth (Scenarios FA To FC)
Module G: No Growth (Scenarios GA To GD)
Module H: Potential Trump Stimulus (Scenarios HA to HB)
The First Shifting Of The Odds
The Second Shifting Of The Odds
The Third Shifting Of The Odds
The National Debt & The Surging Costs Of Social Security & Medicare
By Daniel R. Amerman, CFA
We know three things about today, the next ten years - and next thirty years - that are very different than the past.
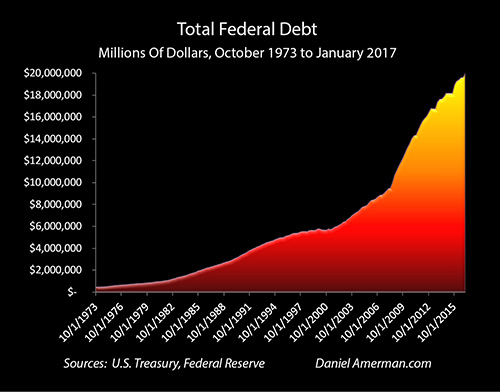
First, we know that the total United States government national debt is currently about $20 trillion, and that it is equal to about 105% of the size of the national economy.
Second, we know that interest rates around the world are still close to the lowest levels in recorded history, and in the United States are still far below those of previous decades.
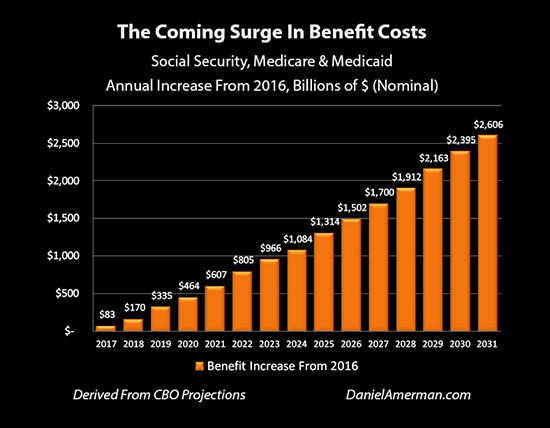
Third, we know that there will be a tremendous acceleration in Social Security and Medicare benefits payable over the next 10 years and beyond. As introduced in this analysis, the amounts involved are staggering - and these expenses will arrive much faster than most people realize.
We have never before experienced this powerful three-way combination; it will be a new set of circumstances for retirees, savers and the markets.
It is routine among some commentators to dismiss concerns about the size of the national debt - with such dismissals often serving various current political and financial agendas.
However, when the United States national debt doubled in the aftermath of the financial crisis of 2008 - it necessarily transformed how retirement finances as well as investing in general will work in the 2020s and 2030s (and beyond). One impact of the increase in the national debt will likely be to change the daily standard of living of tens of millions of retirees over a period of decades.
There is a fundamental problem with the way that many people are preparing and planning for their retirement in particular, or long-term investing in general. That is, it is the norm to look to the past to determine what is reasonable to expect for the future. But the issue is that the past - if we look at the averages of previous decades - can't repeat itself. The math simply doesn't work.
To see why this is the case, in this three stage analysis we will 1) first look at the national debt in isolation, 2) then examine the costs of the coming surge in Social Security and Medicare payments in isolation; and 3) combine the national debt and increasing benefits to see why the future is likely to be quite different from the past.
Stage One Analysis - The National Debt By Itself (Scenario AB)
For our first analysis (scenario AB) we keep the total national debt at its current sum of near $20 trillion. However, instead of very low interest rates, we assume that interest rates return to their historic averages, which were about 5% higher during the period from 1962 to 2007 (before the financial crisis). Because the federal debt has short, medium and long term components, this increase in interest rates takes a number of years to fully take effect, with interest payments gradually increasing over that time.
We also remove the coming surge in retirement benefits, and leave them level as a percentage of GDP at 2009 levels into the indefinite future - the same place where we were before the first of the Boomers reached the traditional retirement age of 65. This isolates the increase in the national debt, separating out the coming surge in Social Security & Medicare payments.
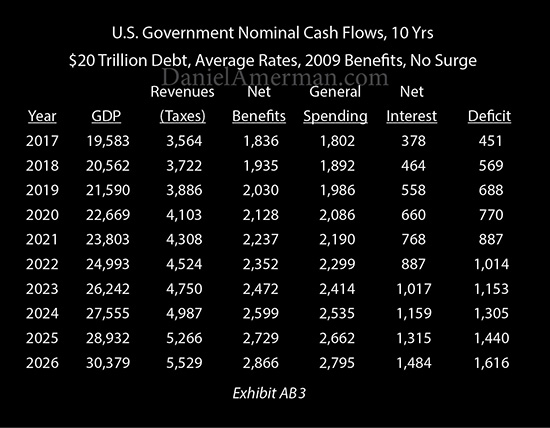
The column in Exhibit AB3 to pay particularly close attention to is the "Net Interest" column. Interest payments on $20 trillion in debt start where they are now, and as federal debt is rolled over and refinanced at historically average interest rates, the interest payments steadily climb upwards. This sends the deficit into a rapid climb. The increased deficits increase the national debt, which then further increases the interest payments, which further increases the deficits, and that then increases the debt at a still faster pace.
Simply returning to paying historically average interest rates on a $20 trillion debt would create a situation where by 2024 the annual budget deficit would exceed 50% of normal government spending, meaning a dangerous range has been entered. (From 1962-2007, ten year Treasury yields were an average of 5% higher than the fall of 2016.)
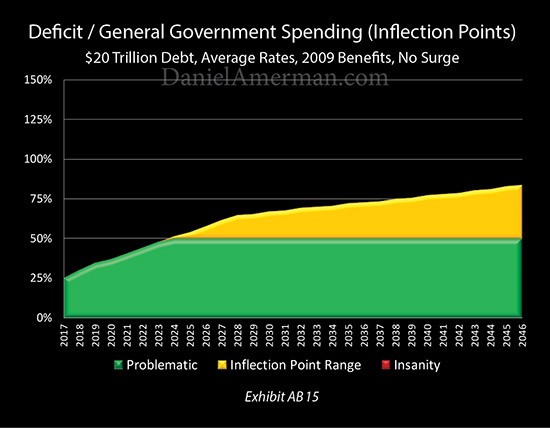
In that range, represented by the yellow above, the financial situation of the United States government grows a little more precarious each year.
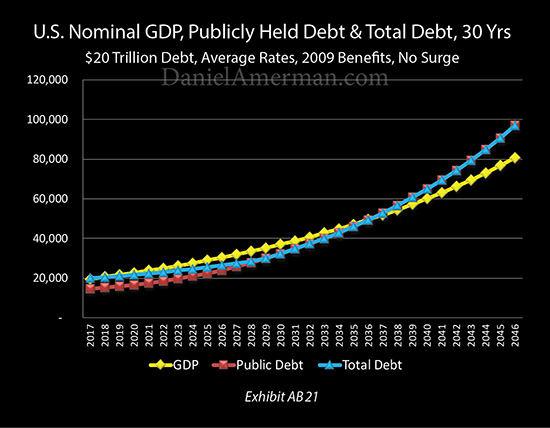
The full impact on the size of the debt can be seen in Exhibit AB21. The national debt now doubles to over $40 trillion (in nominal dollars) by 2033, and doubles again to over $80 trillion by 2044. It also grows increasingly unaffordable relative to the yellow line of the size of the national economy.
(These exhibits are excerpted from the research report. Key assumptions for the A module scenarios shown herein include a 2% real long term economic growth rate and a 3% long term average inflation rate.)
Stage Two Analysis - Isolating The Coming Surge In Benefits (Scenario AC)
Now, whether the national debt had doubled or not - we have known for decades that major financial challenges were on the way. What scenario AC examines is what would have happened if the national debt had not doubled - but we did have to pay for a surge in retirement benefits as the Boomers aged.
Even without a much higher national debt - this is still quite problematic. As of 2017, we are still very much in the early stages of paying for the retirement of the Boomers. Regardless of the national debt, things were about to get much more expensive anyway, and at a rapid rate.
To isolate the surge in Social Security and Medicare payments from the $20 trillion national debt, the national debt is brought down to $9 trillion, and interest rates are increased by a much more modest 2%, meaning they remain quite low compared to long-term historical averages. Social Security and Medicare (and Medicaid) begin not at their 2009 levels as in the previous scenario, but at the significantly higher 2016 levels, and they increase in fiscal year 2017 and each year thereafter, as further analyzed here.
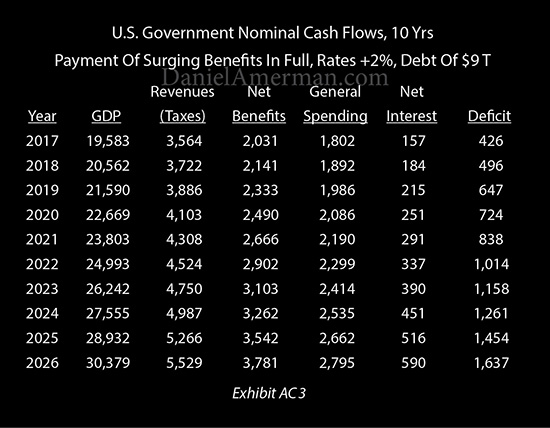
As can be seen above, the deficit problems arising from the "Net Interest" column have been greatly reduced. But now there is an issue with the "Net Benefits" column. Social Security and Medicare expenses rise from $2 trillion in fiscal year 2017, to almost $3.8 trillion per year by 2026.
This is enough to drive deficits up to over $1 trillion per year by 2022, and over $1.6 trillion per year by 2026.
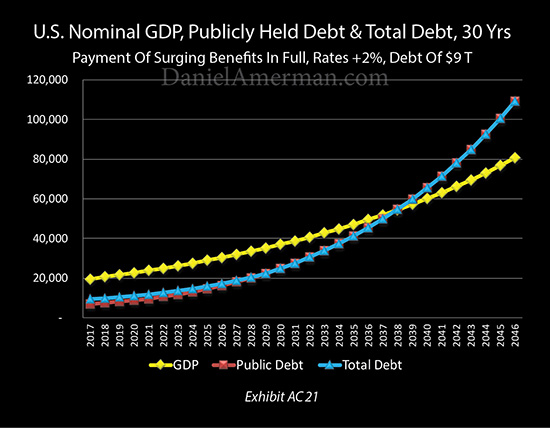
As shown in exhibit AC21, just the increase in benefits by themselves are transformative. The debt doubles to over $40 trillion by 2035, and doubles again to over $80 trillion by 2043.
This creates a situation by 2040 where benefits and net interest payments by themselves would consume all government revenues. One hundred percent of all "normal" government spending, including everything from defense to housing to paying all federal employees to keeping the lights turned on at the White House - would all need to be borrowed each year.
That is unsustainable for any period of time. Indeed, the word "insane" could reasonably apply to such a situation as well; situations like that have never turned out well in any nation. That is the reason for the AC15 exhibit below, which is designed to be an intuitively understandable one page summary.
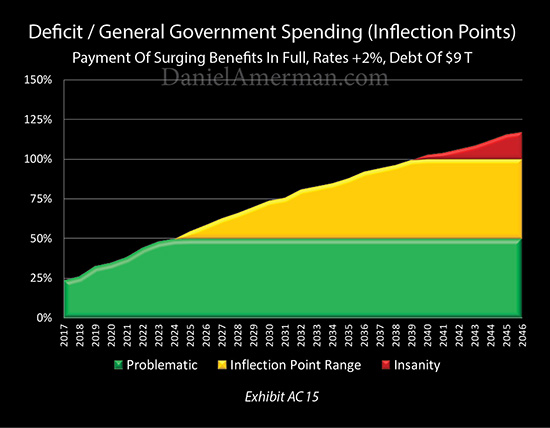
If the nation reaches the red zone, where annual deficits exceed all normal government spending (exclusive of benefits and interest) - then the "insanity inflection point" has been passed, and that is a prescription for an imminent financial disaster scenario in the 2040s.
The yellow zone is the "insanity inflection point" range where the deficit is between 50% and 100% of normal government spending. It is (just barely) reached by the end of fiscal year 2024 in this scenario, and it is in a dangerous range from that point forward, where the national debt rapidly mounts, putting ever more pressure on benefits and interest rates. An "inflection point" where government finances quickly spiral out of control could be reached at any time. But there can still be a path out.
The green zone deficits are where less than 50% of normal government spending is borrowed, and it too can be quite problematic. But this can also be sustainable over time, and government debts may decline as a percent of GDP in this range. (The colors and round number percentages are intended to provide an intuitive single visual measure to easily compare otherwise complex scenarios with many components moving relative to each other over many years.)
Long before the financial crisis of 2008, many Boomers (and younger) had been skeptical about getting their benefits in full in the way promised. As shown above - they had good reasons for those concerns, even based on what we knew then.
Stage Three Analysis - Combining The National Debt & Surging Benefits (Scenario AD)
The current reality, however, is that we face both issues simultaneously. The national debt did double. It is not 2009 anymore, retirement benefit expenses are already much higher, and we are now on the verge of the ramp-up period where Social Security and Medicare payments begin soaring upwards every year.
Exhibit AD3 of the research report shows what happens when we combine the same economic growth rates, the same tax collections, the current national debt, the costs associated with making future benefit payments in whole, and from this day forward pay historically average market interest rates (1962-2007) on all maturing and new Treasury debt, as it rolls over or is issued.
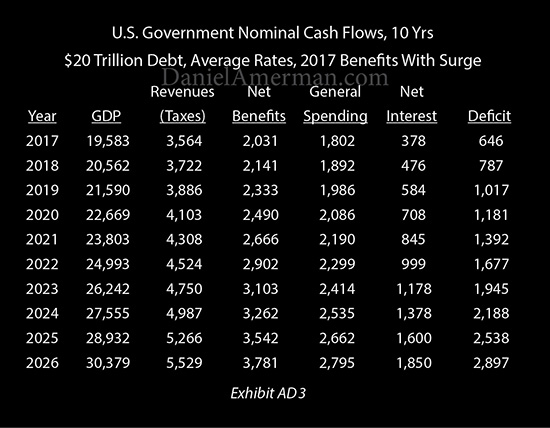
The "Net Benefits" and "Net Interest" columns are now working in tandem, and simultaneously increasing the deficit. This causes the deficits to explode upward, reaching $1 trillion per year by the end of the 2019 fiscal year, $2 trillion per year by 2024, and almost $3 trillion per year by 2026.
As plainly shown above - we have two major financial issues and they reinforce each other to create something that is far worse than either by itself.
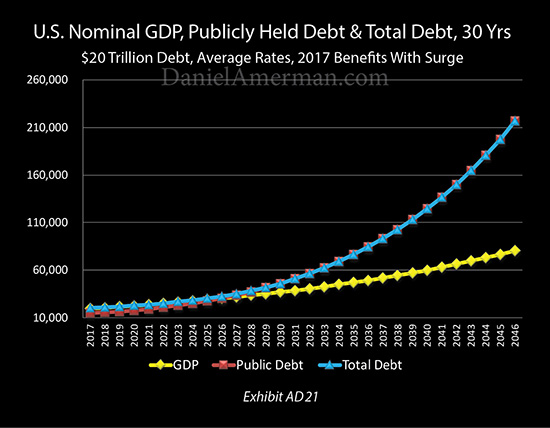
As shown in Exhibit AD21, the surge in deficits means that the national debt now climbs much faster, doubling to $40 trillion by 2029, and doubling again to well over $80 trillion by 2036. And the higher the debt goes - the larger the interest payments, which further increases the annual deficits, which are also simultaneously being fed by the ever increasing retirement benefits, which leads to an even faster increase in the national debt.
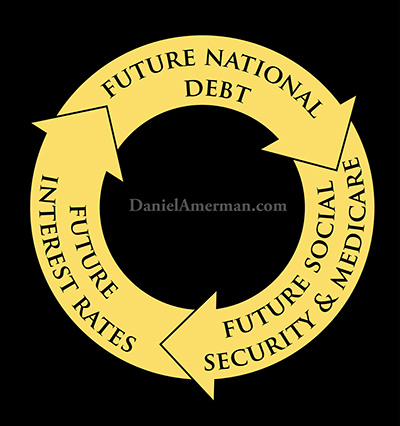
There is no getting around the fact that for the nation as a whole, the three factors of the national debt, retirement benefit payments and interest rates are deeply and inextricably intertwined.
There is also no getting around the situation that for individuals, the two major components that will determine standard of living in retirement are benefits and savings. And if the assumptions are not correct about benefits and savings - then on a reality basis, many individual retirement plans may be completely mistaken.
The tight linkage between their future interest earnings, their future benefit payments and the future size of the national debt could be the number one determinant of actual standard of living in retirement in the next 5,10 and 15 years for many millions of people. Yet, relatively few people have thought this through, let alone explicitly incorporated it into within the heart of their retirement plans.
Because the numbers are so large - they will likely impact everything. From economic growth, to deficits, debts, interest rates, bond markets, stock markets, real estate, precious metals, currency values, tax laws, and retirement account regulations - everything will be in play.
Unfortunately, a common financial and retirement planning approach is to ignore the national debt, the coming benefit surge, and how they are intertwined. This includes investment and saving decisions - and Social Security claiming decisions as well.
Pretending this isn't happening, however, is a luxury that only works when the changes are in the distant future. What the numbers quite plainly show is that we will begin rapidly losing that luxury over the coming years. And plans that do not take this new and dominant reality into account - risk going entirely off track.
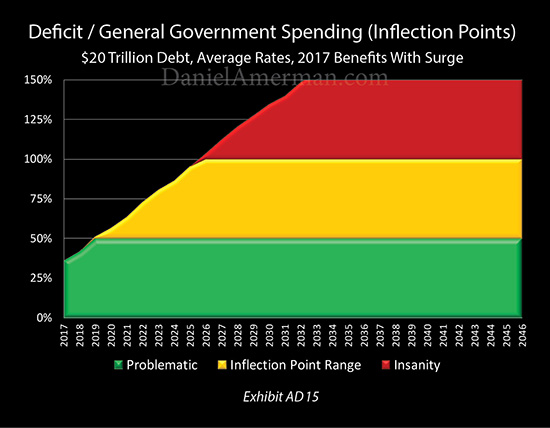
The speed can be seen in Exhibit AD15 above. If starting at the beginning of the 2017 fiscal year we had complete normality by historical standards, then the green zone only lasts through 2017 and 2018, the yellow zone is just barely entered into by the end of the 2019 fiscal year, and we are in the red zone by 2026.
Now, in looking at the graph above, it could be easy to make what is referred to below as "The Doomsday Mistake". That is while yes - a financial disaster scenario could happen, with potentially catastrophic consequences - there is no need for it to happen. It is in no way inevitable.
Exhibit AD15 is not a forecast - but an identification of constraints. If the United States starts with $20 trillion in national debt, pays historically average interest rates to fairly compensate savers for the use of their money, and makes all retirement benefit payments with full inflation indexing - it doesn't work. An impossible situation is created. And such a scenario falls apart with great speed.
We truly have not been in this place before. The old assumptions just can't work, not when we look at the intertwined relationships between the national debt, retirement benefits and interest rates.
However, if the constraints are followed and if those intertwined relationships are taken into account, then the future can be stable, and no doomsday or crisis scenario is needed.
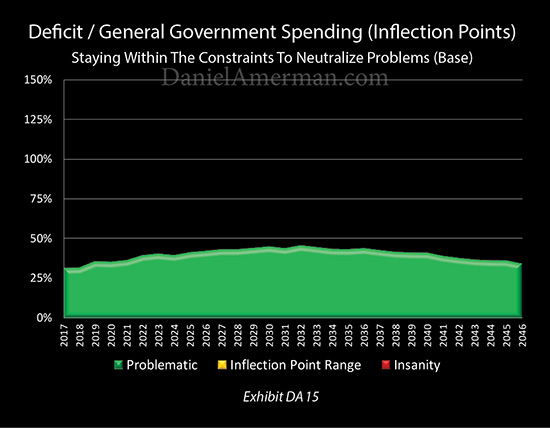
As shown above in Exhibit DA15 and analyzed in the "Five Ways Of Staying Within The Constraints" module within the research report, we can take the exact same economic growth and tax collections from the previous three scenarios, and stay entirely in the green zone for the next 30 years, never sending the deficits or the national debt out of control, even while making steadily increasing individual retirement benefit payments each and every year. Indeed, there are a number of different ways of doing this.
But we can't do that with the "old normality". It requires a "new normality", and the difference can change every aspect of retirement financial planning.
It also needs to be recognized that we are still in a relatively early stage compared to where we will be 5, 10 or 15 years from now. The farther out in time we go, then the more financially dominant the national debt and increasing national retirement benefit payments will become, and the greater the impact on individual savings and investments, as well as individual benefits.
(The analysis above is an introduction to "How The National Debt & Surging Benefits Will Transform Retirement Planning". The three volume research report itself goes into much more detail on the issues discussed herein, as well as many related subjects.)
Holistic Retirement Planning
There is a vast industry that is devoted to helping people prepare for retirement. This includes books, articles and the media as well as one-on-one discussions with advisors and financial planners.
Now, how often do those preparations begin with, "Let's start with by discussing what the national debt could be in 2025 or 2035, because that we can't talk about likely investment returns without taking that into consideration."?
Or: "Let's take a look at what it will take to protect your lifestyle and financial security during your 80s, but first we need to look at total potential Social Security and Medicare benefit payments during that time, because that may determine both your likely benefits and the inflation-adjusted value of your portfolio."?
Or: "We need to make some allocation decisions between stocks, bonds, real estate and precious metals. But first, let's look at how returns in each category may be transformed by the extraordinary increase in benefit payments over the next decade."?
While such considerations would seem to be a necessary starting point, the reality is, of course, that it is uncommon to take such factors into consideration.
There are at least a couple of reasons for that, and the first is tradition. The norm in the media and financial industry is to treat the national debt, future Social Security and Medicare payments, and future investment income as being three entirely separate subjects.
We know that isn't actually true for the years ahead, but it worked for decades in the past. As we explored with Scenario AA above - with much lower debt levels and much lower benefit payments, there doesn't need to be a linkage. And like generals always planning to fight the last war over again (with sometimes disastrous consequences), the accepted financial norm for long-term planning is to extrapolate from the past, our common experience.
The other issue is that of specific knowledge. Even for those who want to integrate these factors - what are the specifics? What is a good range for the impact in 5 years, 10 years or 20 years? How do all of these factors work together, and how can they be practically taken into account?
The Doomsday Mistake
There is an opposite kind of mistake that is being made as well.
That is, while it may not be the norm in the financial industry, many individuals have been thinking about these factors - and they often draw an emotional conclusion. They decide that we are doomed, with no way out. They may think that the U.S. government itself must necessarily become insolvent and that Social Security will end entirely.
A key take-away from the research report is that the future does not need to be a Doomsday scenario.
Yes, there are a number of different ways in which enormous pressures could break down the system, and some could take place much faster than most people have any idea. What it takes for this to happen - and how soon it could happen - are key parts of the research report.
At the same time, there are also many, many paths available in which things basically hold together - though not necessarily in ways that are pleasant for all retirees and retirement investors.
Indeed, a core part of the research report is exploring twelve different ways in which the future can "work", including under some very challenging possible future economic conditions.
The national debt does not necessarily spin out of control.
There may not ever need to be a hard reset of some sort when it comes to Social Security and Medicare, or even necessarily an increase in the retirement age - instead it may look a lot like we have been seeing in recent years.
There may never be a huge increase in federal taxes.
However, what has to be understood is that there are constraints. That is what the enormous national debt, the extraordinary sum of retirement benefit promises, and current very low interest rates are all about. They are constraints - and they are deeply, deeply intertwined.
So long as the constraints are honored, then the future can work. Oh, it may not be easy. As analyzed with specific numbers in the report - the doubling of the national debt will indeed likely reduce the average standard of living that can be supported by either retirement benefits or retirement investments, over a period of decades.
This does create potentially serious problems for both retirement beneficiaries and investors. These are challenges that are difficult to handle even if we see them coming - and most people don't.
A Three Stage Analysis Delivering Intuitive Understanding
The issue is that two of the most common approaches to retirement financial planning are flawed. On the one hand, following the traditional approach and ignoring the $20 trillion national debt and the coming surge in Social Security and Medicare benefits means ignoring what may be the largest determinants of the value of retirement savings, the value of retirement benefits, and retirement investment income.
On the other hand, giving in to pessimism and moving all savings into a financial bunker in the belief that financial doom is inevitable may be equally mistaken, and could unnecessarily lead to a materially lower standard of living in retirement if the future does not turn out that way.
There is a very good chance that the future will be somewhere in-between. A challenging environment where making good decisions is absolutely essential, with better decisions potentially changing our standard of living and financial security for years and even decades.
Indeed, the more challenging the future environment, the less likely that being average will be good enough, and the more crucial it is to be well-informed and make better decisions.
But there can be an essential issue with achieving that goal. Which is that this is complex stuff.
Understanding the relationships between future economic growth, deficits, national debts, interest rates, inflation, individual retirement benefits and individual retirement savings requires merging multiple interrelated exponential series together in a way that is not - initially - likely to be intuitive for most people. It requires serious and complex number-crunching, followed by extensive study.
Which means it is not realistic for most people to do this on their own, even though they need it. This is particularly the case for those without degrees in finance or economics.
The "How The National Debt & Surging Benefits Will Transform Retirement Planning" three volume research report serves to close that gap, and deliver the needed information in laymen's terms. This is done in a three stage financial analysis, with readily understandable explanations at each stage. So that by the time one has completed a review of the report - there is an intuitive understanding of these vital issues.
First Stage Analysis: The Nation
The first set of analyses explore in detail what many people have never seen or considered - which how everything works together. Various possibilities for economic growth, interest rates, inflation, government expenses, and benefits payments are all combined, with over 500 pages of supporting charts and graphs available in printed form in Volume Two.
And as you progress through the video presentation that comprises Volume One, how everything fits together will become increasingly clear, until you have an informed and thorough understanding.
There are 24 Exhibits in each Stage One analysis for the nation, and many can be seen in the Module A overview above.
Second Stage Analysis: Individual Implications
The second level of analysis is the personal implications for individual savers and retirees. There is a direct correlation between how the nation stays within the constraints - and the daily standard of living in retirement for most people. Change the constraints - and the standard of living that benefits can provide also changes.
Which then changes the needed contribution from savings to maintain a standard of living above what can be obtained from benefits alone. The reality-based complication that few retirement plans take into account is that the real return on savings - and the future amount of savings - are also dependent upon the specifics of how the nation stays within the constraints.
What is unique about the Second Stage analyses is that the exact set of circumstances for the nation are directly translated into the personal implications for an average saver or average retirement benefit recipient.
Year by year - how does the nation acting to avoid insolvency impact the dollar amount of benefits, and of normal savings? Furthermore, year by year - with an exact correspondence to the national numbers - what does that do to the purchasing power of benefits and the purchasing power of normal savings?
There are indeed a number of ways that a nation $20 trillion in debt can pay retirement benefits to a rapidly increasing retiree population for decades to come without ever going through a national emergency, or a hard reset, or even an open reduction in benefits that will be reported in the media. What they all have in common, however, is that none of them are free. There is always a price, regardless of whether the government ever explicitly says what it is doing, or whether the general public understands what is being done.
Without understanding both sources of retirement purchasing power - those of savings and benefits (and how the two interrelate) - how can there be any hope of making reality-based financial plans for 5 years or 10 years from now, let alone 20 years from now?
There are 10 Exhibits in each Stage Two analysis of the individual implications for savers and retirement benefit recipients.
Third Stage Analysis: Investment Implications
What the Stage One and Stage Two financial analyses establish is that the constraints on the nation as a whole directly create financial issues for individual retirement savings and benefits, to an extent that changes over time. What is numerically identified is that the challenges for individuals are likely to be greater than most are planning on, with the specific degree of impact depending on how far into the future we are looking.
If there are issues with both interest-bearing savings and benefits, then other than deferring retirement, there is only one way of closing the gap - which is that really good decisions have to be made about the other investment categories.
That said, making really good financial decisions can be challenging if one takes the traditional approach of completely ignoring the $20 trillion national debt and the imminent surge in Social Security and Medicare payments, while instead focusing solely on what history tells us about the performance of different investment categories to make the allocation decisions which then determine how our portfolio will perform.
In the aftermath of the financial crisis of 2008, the markets are already working in a quite different way than they used to. Central banks such as the Federal Reserve have far more influence over the markets than they did before. Interest rates are lower around the world than we have ever seen in recorded history. And these factors are profoundly influencing not just bond prices and yields, but also stock prices and dividend yields, and real estate prices and cash flows, as well as precious metals prices and asset/liability management strategy results.
Many assume a return to normality, with recent years just being a passing phase. But as explored in the first module (Scenarios AA to AD) we likely can't go there again, or at least not for some time. The $20 trillion national debt by itself prevents that. The imminent surge in Social Security and Medicare payments by itself prevents that. When both are combined - there simply isn't room for a return to the "normality" of previous decades, not if financial disaster for the nation is to be avoided.
What that means is that we are likely just getting started when it comes to investments and markets working differently than they have in the past. The larger the debt grows and the higher annual benefit payments climb - then the more dominant the governmental interventions become, and the greater the impact on investment performance.
This isn't necessarily a negative, but rather it is just... different. Indeed, some of the ways in which the nation as a whole stays within the constraints may create extraordinary profits in some investment categories for reasons that won't be apparent from studying historical returns - because this set of circumstances hasn't existed before.
The third stage of analysis in the research report is that of investment implications. It is a conceptual analysis of how what is explored in the first two analyses may impact specific investment categories. The potential impact on stocks, bonds, real estate, precious metals and asset/liability management strategies is explored. Some categories may thrive, others may be punished. Which means there may be strong reasons to change allocations, and thereby change investment results.
All three stages of financial analysis are correlated. How the nation stays within the constraints does directly impact individual savings and benefits - even as it also may change the relative performance of stocks, bonds, real estate and precious metals.
The Volumes, Modules & Scenarios
"How The National Debt & Surging Benefits Will Transform Retirement Planning" is organized into 8 modules, which contain a total of 25 scenarios. Each scenario is documented with 24 Stage One Exhibits for the nation, and 10 Stage Two Exhibits of individual saver and retiree implications, for a total of 850 table and graph Exhibits in Volume Two of the research report (592 pages).
Each Exhibit name begins with a module letter, followed by a scenario letter, followed by the number for the particular schedule. This common numbering and organization system makes it very easy to page through Volume Two and quickly find and compare particular graphs or numbers for the nation or individual retirees across different scenarios and modules.
The purpose of the Volume One video presentation is to deliver an intuitive understanding in an interesting and easy to follow manner - not to review schedules. Many of the Exhibits never appear on the screen, particularly those that are very similar to each other.
As with Volume Two, Volume Three (292 pages) also serves to support Volume One, but in a different manner. The report is the culmination of many years of work, and many years of research, analyses and articles. An understanding of this information and concepts is very helpful for fully benefiting from the video presentation.
In order to keep the video presentation at a manageable length, the relevant parts of many supporting analyses are brought in as deemed appropriate, but are not themselves reviewed in depth. For those desiring more information, Volume Three has in depth written reviews of those important concepts. Even as it supports the materials from in Volume One, Volume Three is in its own way every bit as valuable as either the video presentation or the core analytics, and covers a broad range of related topics.
An outline of the modules and scenarios follows.
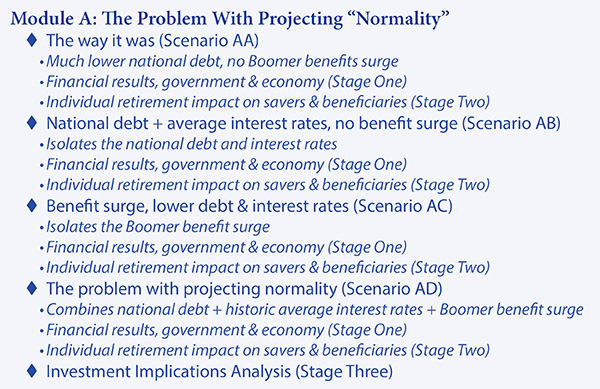
Module A: The Problem With Projecting "Normality" (Scenarios AA To AD)
A detailed description of the Module A scenarios, with many sample exhibits, is the introduction (above) for this description of the research report. The topic outline for Module A is below.
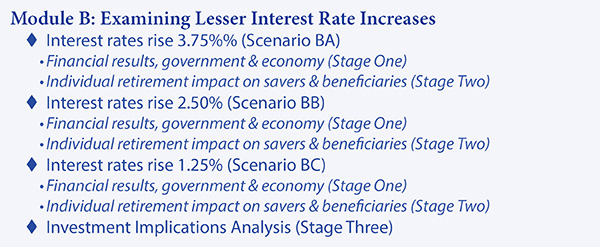
Module B: Testing Interest Rates (Scenarios BA to BC)
If a nation $20 trillion in debt can't afford to let interest rates return to their long-term averages - how high can they go? This is a far from trivial question, with world financial markets currently being dominated by the Federal Reserve's very slow and gradual raising of interest rates.
Scenarios BA, BB and BC take a look at three different potential increases in interest rates, in the wide zone that exists between the very low rates of today and the much higher rates of the past.
The Stage One analysis for each scenario looks at the nation as a whole. What can we afford? What does an increase in interest rates in combination with the scheduled surge in government retirement benefits do to the deficit? How fast does the debt then climb, and what are the new interest rate payments on that higher debt, and what does that then do to deficits?
(Changes to net federal interest payments are phased in over a number of years and at a pace consistent with the current weighted average life of the national debt.)
Without explicitly merging the national debt with retirement benefits, and interest payments on that debt - and working out the interrelationships going into the future - there is simply no way of determining what interest rates are affordable for the nation.
The Stage Two analysis for each scenario takes the results from the nation - and applies them to individuals. What is the amount of money that someone needs to have in savings today to have a given amount of money available 5 years, 10 years or 20 years from now? On a reality basis, if we are 55 or 65 today and we want to have a certain purchasing power from our savings at age 80 - how much do we need to have today?
Here's a complication to consider - if what we are counting on having available at age 80 would require returns that would send the nation into effective insolvency long before then, what are the chances that our assumption is going to be correct? Could this mean we need to be using an entirely different number?
These are little-asked questions - but they are crucial when it comes to attempting to make realistic plans for what will actually govern our future standard of living in a world where the national debt is already near $20 trillion and the surge in Boomer retirement benefits is only just getting started.
Now chances are good that we are not planning on using interest-rate based investments for the long-term, or at least not entirely. We may be planning on something else altogether, such as stock ETFs and REITs in combination with a bond fund, with perhaps a precious metals component as insurance as well.
That is where the crucial third stage analysis comes in, which is the conceptual discussion of the impact on investment categories. One thing that the last ten years has made clear is that interest rates have a pervasive impact on all the major investment categories. Not just bonds, but also stock market prices, real estate prices and precious metals prices.
What future interest rates are sustainable has very important implications for long-term performance in each investment category - as well as the allocation decision for how much to put into each category.
The topic outline for Module B is below.
Module C: The Trust Funds & The Two Sets Of Books (Scenario CA to CB)
As explored in this analysis, using exhibits from the research report, the United States government quite openly maintains two sets of financial books. In one set of books, such as those shown by the Social Security Administration, we have the Trust Funds - a vast national savings account that totals $5.4 trillion when Social Security and the various federal civilian and military employee retirement programs are included. Everyone's money was taken over a period of decades and invested in the safest of all securities - United States Treasury obligations, backed by the full faith and credit of the federal government.
This set of books reassures the general public that the money is there to pay them, that their savings do exist - and it would be absurd or even reckless to suggest otherwise.
There is a second set of books, such as those kept by the Congressional Budget Office (CBO) and the White House Office Of Management and Budget (OMB). In this set of books, only "publicly held debt" is treated as being real debt, and the only real cash expense going out into the future is "net interest expense" - with that being interest paid to the public.
Because the Trust Funds are money that the government owes to itself, it would be absurd to treat one part of the government paying another part as real cash flow for the government as a whole, or one branch of government paying another branch interest payments as real expenses or income. The only reasonable approach for a financial or accounting professional is to net out the Trust Funds and net out the interest payments on the Trust Funds as not really existing.
This is exactly what the CBO and OMB do with their budget projections. And it is also the most common approach taken by the financial media and major investment firms, who commonly report that the real national debt is less than $15 trillion, and "only" about a manageable 75% of GDP.
The contrast is quite open and quite sharp. In the long-term projections from the Social Security Administration, the principal amount of the Trust Funds and the interest income from them are the source of security for the payments of benefits long into the future - they are the foundation that is necessary to maintain the financial viability of Social Security. Yet, the CBO and OMB don't even include the various trust funds as real debt in their main projections, or include the interest payments as an expense, they are more of a footnote.
If these two sets of books were kept by a private company, it would likely be treated as fraud. A $5.4 trillion fraud to be exact, which would be by far the largest in financial history. And the reconciliation of the books when the fraud was uncovered - would be extraordinarily painful for the shareholders.
Now, this isn't legally a fraud because this is the federal government we are talking about, for whom it is by definition not illegal. Indeed, there are many aspects of governmental accounting that are different from private accounting.
But even so, as uniquely explored number by number and graph by graph in the research report, the two sets of books will necessarily reconcile over time. There will be a $5.4 trillion cost to doing so, even if it is never discussed as such or labeled as fraud. We know this day is coming and it has been coming for decades, it will finally be starting soon, and it will culminate when the Trust Funds have been spent in full.
As you will come to understand in detail, the Trust Funds are not a safety buffer at all - but rather the direct opposite. They do exist, and they are a national debt accelerant. A multi-trillion dollar accelerant whose costs will be paid in staggering annual increments when this process hits full gear.
Because it is so large - the coming $5.4 trillion spending down of the Trust Funds can change everything around it. The ability to make benefit payments and the ability to make interest payments will each change for the nation as a whole, as you will clearly understand from the Stage One analysis.
The direct impact on individual retirees and individual savers is discussed in the Stage Two analysis.
In the Stage Three analysis you will conceptually explore how this has the potential to be transformative for all the investment markets, with major implications for stocks, bonds, real estate, precious metals and asset/liability management strategies.
The topic outline for Module C is below.
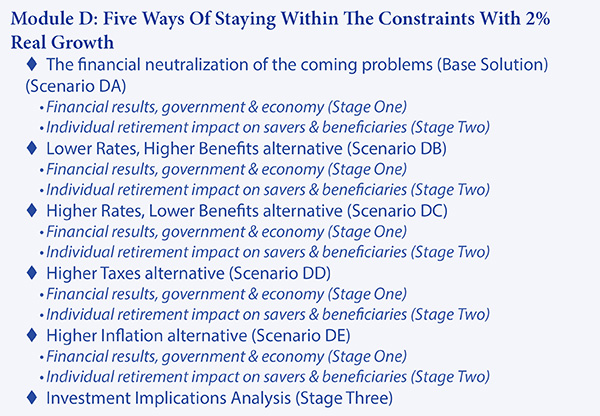
Module D: Five Ways Of Staying Within The Constraints (Scenarios DA to DE)
In the discussion of the "The Problem With Normality Module", we looked at a graph that went from the green zone to the yellow zone by 2019, and into the red zone of fiscal insanity by 2025. Meaning that a "hard reset" of at least retirement benefit programs, and possibly financial markets and the economy as well looked almost inevitable in the not too distant future.
The graph below is based upon the exact same rate of economic growth and exact same tax collections. So the money available to the federal government to cover benefit payments, interest payments and general government spending is identical.
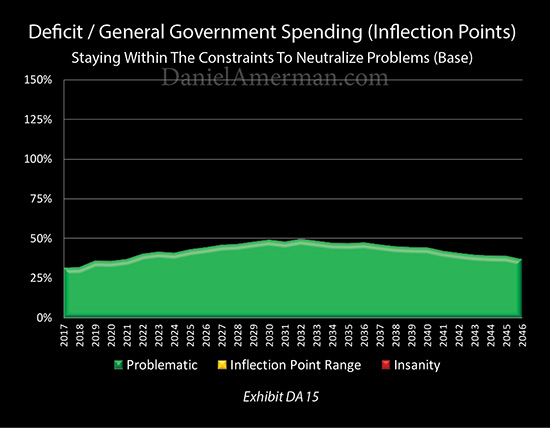
But there are many paths available that avoid those dangers, and one of them can be seen in Exhibit DA15 above. The nation never leaves the green zone over a period of 30 years, there is thus never a need for a hard reset.
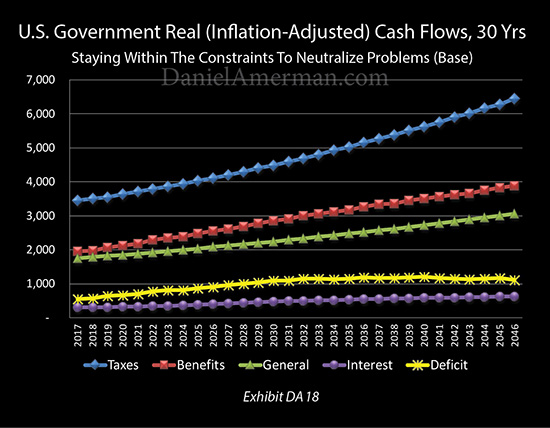
The deficits never truly explode. Indeed, in inflation-adjusted terms as shown in Exhibit DA18 above, they top out by the early 2030s, and then remain more or less flat, even as the economy and taxes continue to grow, meaning they are shrinking in real terms.
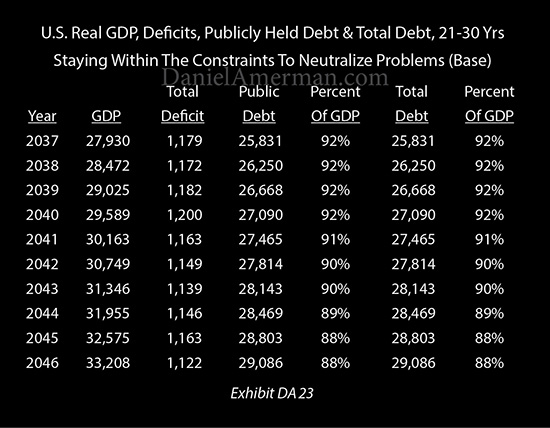
The national debt never goes out of control. As shown above in Exhibit DA23, by the 2030s and 2040s it could actually be shrinking in comparison to the size of the economy, becoming ever more affordable over time.
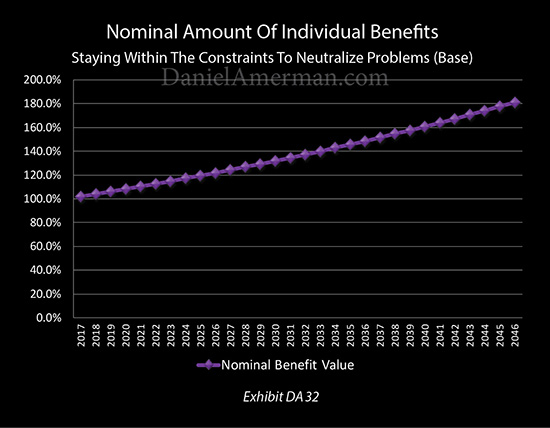
And this can be done without benefits ever being openly cut, or at least not in a way that will be reported in the headlines. As shown in Exhibit DA32 from the Stage Two analysis section, the amount of the Social Security and Medicare benefits for each individual retiree can increase in a smooth and unbroken progression for 30 year straight years - without the nation ever leaving the "green zone".
This goes back to what was originally discussed as being the complexity issue. The combination of surging benefit payments feeding into a national debt that starts at $20 trillion and climbs upwards from there - while intertwining with interest rates - is a bit complex. Once most people do think it through, however, the future may look impossible.
This simply isn't true at all. For once a person understands how all the elements work together - there are many different ways the future can "work", and without a high drama hard reset being needed. But the specifics of how the nation can stay within the constraints can be a bit complex, particularly when someone is trying to reason it out in their own head, without running the numbers.
The "How The National Debt & Surging Benefits Will Transform Retirement Planning" research report crunches the underlying numbers for you, and delivers the needed information in the form of a visual and even intuitive understanding of how all the pieces work together, as explained in Volume One on the screen in a step by step and easy to follow fashion.
Once we understand Stage One of how things can work for the nation as a whole, then we can move on to the Stage Two analysis, which is the impact on individual savings and retirement benefits. As explored in the research report, how the nation as a whole can stay within the constraints has a direct impact on the inflation-adjusted value of individual savings and individual benefits that is powerful and transformative over time.
Which just makes sense. Problems which add up to tens of trillions of dollars aren't mitigated without materially changing the lives of tens of millions of people over a period of many years. There is no way around this. It is true if these people fully understand what is happening - and is equally true even if they don't, and aren't anticipating or planning for it at all.
When the full and realistic challenges are understood - this can change the decisions that are being made today. It also heightens the focus on getting the best possible results from investment assets that go beyond just interest-bearing savings.
This is where the third stage analysis becomes crucial, which is the conceptual discussion of the impact on investment categories such as stocks, bonds, real estate, precious metals, and asset/liability management strategies.
What keeps the nation as a whole inside the constraints - also impacts each of the investment categories, and often in different ways, which means it potentially changes how much should be allocated to each category.
The Stage One analysis in Scenario DB shows a different way for the nation as a whole to stay within the constraints, and in the "green zone", while paying higher benefits than in the DA scenario. Which changes the numbers in the Stage Two analysis, in terms of the results for savings versus benefits. Which also changes the Stage Three conceptual analysis of the impact on each of the investment categories, and also potentially changes the best allocations between categories.
The Stage One analysis in Scenario DC takes the opposite approach and shows a third way for the nation to stay within the constraints, while in this case allowing the payment of higher interest rates. These numbers are directly taken into the Stage Two analysis of individual retiree savings and benefits, with a quite different impact than with either of the other two methods. Which then leads to a different Stage Three conceptual analysis, with different results in each investment category, and potentially different allocation choices.
The fourth approach covered in Scenario DD is the most obvious one, and that is to simply raise taxes. How much do taxes need to be raised to keep the nation as a whole "in the green" while delivering higher interest rates and higher benefits? If this path is taken, there is a dramatic impact on both individual savings and individual benefits, as seen in the second stage analysis. There is an equally important impact in multiple different investment categories and choices in allocating between categories, as covered in the Stage Three conceptual analysis.
The fifth alternative is the least understood by the general public but potentially the most powerful - to slightly raise the rate of inflation. This is attractive to the government, as history shows that approaches of this type can cause the least political damage. Yet, as explored in Scenario DE, this approach can not only have the largest impact on the purchasing power of individual savings and individual benefits, but may have the largest impact of all on each of the investment categories as well as allocation decisions between categories.
The reason for going through the scenarios is simple - knowledge is power. The government has a number of distinct and major ways of controlling deficits and the debt without ever openly cutting retirement benefits. And while everyone understands taxes, most of the public does not fully understand the other powerful methods. Which makes these approaches particularly attractive to the government - precisely because most voters don't understand them.
As the report shows, yes - raising taxes is effective. But as also explored, the particulars of how interest rates move relative to inflation - whether explicitly stated or not - is not only effective, but can be even more effective than raising taxes. And the particulars of how benefit increases work versus inflation is not only effective, but can also be even more effective over time than raising taxes.
Each time one of those is used instead of taxes - the purchasing power of retirement savings or retirement benefits also changes over time, which means your future standard of living in retirement may be changing as well. In ways that make perfect sense for people who see how things fit together - while repeatedly blind-siding the current and future retirees who have never studied those issues.
So the very heart of retirement financial planning is changing, in a way that is also changing long-term investments.
You will see on the screen graphic representations of exactly what is happening. You will get a clear explanation of what to pay attention to, why it is important to the nation and why it could be important to you personally. And as each scenario is explored - you will get a building intuitive understanding of the patterns, the relationships, and how interest rates, inflation and benefit inflation indexing as well as taxes all work together for the nation - and may necessarily transform your individual future and planning challenges as well.
Even as investment markets also change, and opportunities shift from one category to another in ways that few people have considered - because we just haven't been in this situation before.
The topic outline for Module D is below.
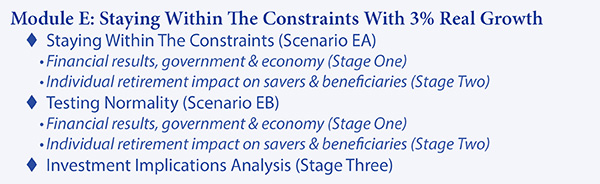
Module E: Faster Growth (Scenarios EA To EB)
The biggest variable of all is that of economic growth. It is the size of the economy that determines the societal wealth that is available to support retirees. And something that most of the public doesn't understand is that much of the wealth that is needed to pay for future retirement benefits - doesn't actually exist yet.
The current economy is much too small to support the promised payments in ten years or twenty years. This is true for Social Security, for Medicare and also for public pensions (as well as for stock markets).
When governments make long-term projections - those are done on the basis of assuming that a great deal of economic growth will occur. The assumption is that there are a lot more employed workers paying taxes, and they are on average earning more money (even in inflation-adjusted terms), which then generates the much larger tax revenues for the government to make the much larger benefits payments that are needed.
And if that assumed wealth of the future which does not exist today is not in fact created, as a result of economic growth rates that are lower than projected - then all bets are off. The financial problems with paying benefits grow much larger, and they vault forward in time as well.
What also needs to be considered is that government projections are as much political documents as they are economic models. The rosier the economic projections, then the less the future problems - and the less the need to take actions today which might be politically unpopular for those currently in power. So, it should come as no surprise that long-term government projections can be remarkably optimistic.
The prior modules were all based on a real (inflation-adjusted) economic growth rate of 2.0%, which is similar to but slightly less than the projections contained in the Congressional Budget Office Long Term Outlook (CBO LTO). (The long-term projections made by the Social Security Administration and White House Office of Management and Budget are generally more optimistic than those in the CBO LTO.)
Scenarios EA and EB take a more optimistic approach, and explore what happens if economic growth can average 3% over the coming years. How much can the constraints be loosened for the nation as a whole, and what does that do to individual saver wealth and retirement benefits? What is the impact on each investment category? With a higher growth rate producing much more tax revenues to increase benefits and reduce deficits - is there room to return to normality?
The topic outline for Module E is below.
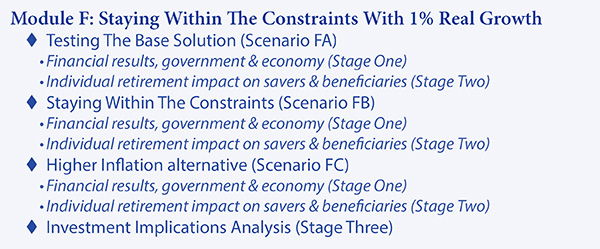
Module F: Slower Growth (Scenarios FA To FC)
On the other hand, if we combine an aging population with a heavily indebted nation, both of which tend to reduce economic growth rates, and we further take into account global financial problems as well as actual economic growth since 2008 - we might be doing good to average 1% real growth over the next 30 years.
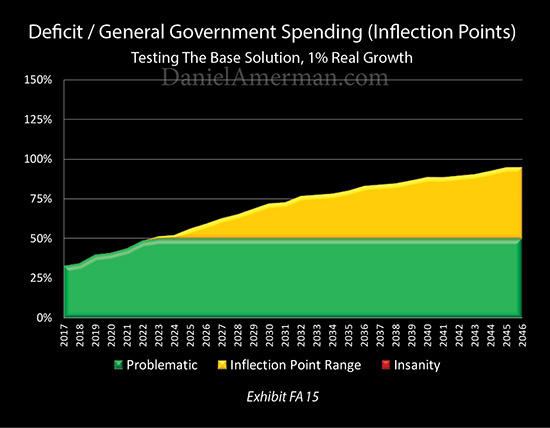
If we take our DA scenario, the base scenario for making the future work with 2% real economic growth, and we plug in a 1% real growth rate instead - we get Exhibit FA15 above.
With Scenario FA the deficits never do move into the red zone, though they are getting close towards the end. But they are continuously in the yellow zone and building ever higher from 2023 onwards. Meaning that the nation is in danger territory for over 20 years, where any unexpected crisis could force a hard reset for retirement benefits and possibly the economy and markets as well.
A 1% change in economic growth rate is all it takes to go from staying "in the green" for the next 30 years, to entering the danger zone in the next 6 years, with the danger growing every year thereafter.
However, even if growth does turn out to be lower, that doesn't necessarily mean any sort of Doomsday scenario is on the way, not at all. As explored in the Stage One analysis of Scenario FB, if we just change how the nation as a whole stays within the constraints of a lower growth rate, then the nation can indeed stay "in the green" for the indefinite future.
There is a price, however, which can be seen in the Stage Two analysis, where individual savings and individual benefits each incrementally change in a fashion that becomes quite powerful over time.
This increases the need for investment performance. However, as covered in the Stage Three conceptual analysis, lower growth and the changes in how the nation stays within the constraints caused by that lower growth, means likely changes in investment performance - in a way that differs across the investment categories.
Because slow growth is so much more challenging for the government, it also increases the likelihood of using a higher rate of inflation. Such an alternative can be highly effective while reducing the political costs relative to the other possibilities.
As analyzed in scenario FC, an increase in inflation in response to slower growth is transformative for the nation, for individual savings and benefits, and is likely to have a powerful effect on each of the investment categories.
The topic outline for Module F is below.
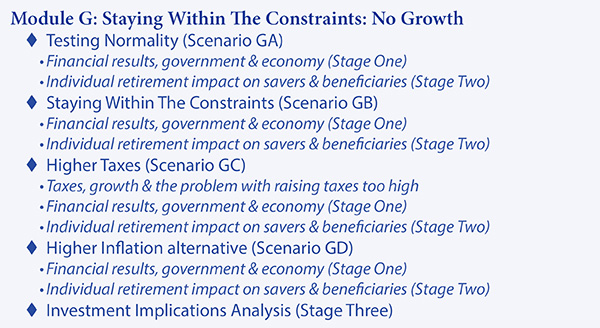
Module G: No Growth (Scenarios GA To GD)
What happens if there is no growth, and the retirement promises of the future need to be paid by an economy the same size (in inflation-adjusted terms) as today is the subject of Scenarios GA & GB.
Scenario GC explores an essential question: if the issue is that a low growth economy makes paying benefits quite problematic, and taxes are raised to cover the difference, but the increase in taxes slows economic growth down to nothing - how does that work out? How high would taxes need to go to pay all benefits?
Every taxpayer in the nation would be keenly aware of the draconian tax increases needed in Scenario GC, and there could very well be a political revolution of sorts, possibly leading to a hard reset of the Social Security and Medicare programs. On the other hand, there is a much more subtle way of accomplishing the same thing, which few people would fully understand.
To gain understanding requires making small changes that impact the relationship between the national debt, interest rates, retirement benefit payments and inflation. These are explored in the Stage One national analysis of Scenario GD, the higher inflation alternative for solving a no growth economy while staying within the constraints. The life changing implications for individual savings and benefits are explored in Stage Two, and the powerful investment implications in Stage Three.
As each Stage One national analysis is explored in the modules, with the corresponding Stage Two individual implications analysis, and the Stage Three investment implications analysis, something essential begins to emerge.
There is a growing familiarity and intuitive understanding of how everything works together. Yes, the numbers underlying the graphs are indeed complex. But the relationships and patterns that are being explained on the screen in primarily graphic form are quite understandable, with specifics that can be explored when it comes to both degree and time.
These patterns and relationships are not part of the usual approach to retirement financial planning. However, they could turn out to be some of the most important determinants of what standard of living and financial security actually are in retirement over a period of many years.
The topic outline for Module G is below.
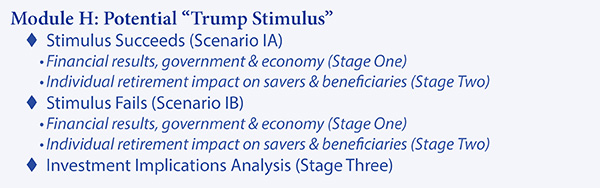
Module H: Potential Trump Stimulus (Scenarios HA to HB)
The central importance of economic growth is at the heart of a plan by Trump to simultaneously increase infrastructure spending and decrease taxes in order to stimulate economic growth. This combination would lead to much higher deficits, at least initially.
Now, on the one hand, this may sound like a remarkably bad idea for a nation that is already $20 trillion in debt with rapidly increasing deficits already on the way.
On the other hand - economic growth is the central question when it comes to the ability to make Social Security and Medicare payments five, ten and twenty years in the future. Can an increase in deficits in the near term actually pay off - perhaps several times over - if it does increase economic growth over the long term?
There have been stimulus programs in the past, but the stakes are particularly high this time around. For a nation as deeply in debt as the United States already is - deliberately increasing deficits is a high risk strategy, there is no getting around it. But there is a way for it work, and in a manner that could change the future for retirement benefit payments.
While the specifics of the stimulus plan and what Congress will approve were not known at the time the research report was prepared, assumptions have been made and two scenarios have been created to explore these issues and the potential future impact on retirees and investors.
Scenario HA shows just how a stimulus could change benefit payments over the next 30 years if it is successful. There are quite different implications for individual savings and individual benefits, and some surprising implications for investments as well.
Scenario HB shows the damage that an unsuccessful stimulus attempt would inflict upon individual savers and individual benefits, and also explores some investment implications.
The topic outline for Module H is below.
The First Shifting Of The Odds
The fundamental goal of the research report is to shift the odds of making better decisions in three important categories, corresponding to the three stages of analyses.
The first category is filtering and understanding the vast amount of information that comes out daily about the nation, retirement finances and investments. We all use our own filters to decide what is credible and what is not, what is useful and what is not, and what is important enough that we may make decisions based upon it.
The Stage One national analyses contained in the research report provide an additional and very powerful filter for you: is the writer or expert taking into account a $20 trillion national debt, the imminent surge in Social Security and Medicare payments, and how those interrelate with interest rates?

If they aren't (and most don't), then you will have the detailed knowledge to make another assessment - is the information or theories they are providing likely to survive an encounter with such a future?
Using better filters doesn't guarantee outcomes - but it does shift the odds in your favor.
The Second Shifting Of The Odds
The second category comes down to the very essence of retirement financial planning - which is being comfortable that we will be able to maintain a targeted standard of living and financial security for years to come. For most people, the two core components of that standard of living and security are benefits and savings.
As you will thoroughly understand after going through the Stage Two analyses - there are overwhelming incentives for the government to make both savings and benefits work in a different manner over the coming years and decades than most people are taking into consideration.
Indeed, once we know what to look for, we can see it today. What has been happening in recent years with both interest rates and increases in Social Security benefits is not coincidence - they are tightly related to the national debt and the coming surge in retirement benefits. These issues will only become more powerful as both the debt and the scheduled benefit payments grow.
Which raises the question - how useful is financial planning that does not take an accurate look at either savings or benefits? Are we likely to get what we expect?
The more accurate the detailed understanding of the ranges for individual benefits and savings in future years that are the byproduct of maintaining national financial stability - the better the odds of using good numbers for achieving the desired lifestyle and security. This is true whether we are looking at our own retirement, or at the needs of clients.
Again, this is not a guarantee of outcomes, but an improvement in the odds when it comes to the core issue of retirement financial planning.
The Third Shifting Of The Odds
If there are issues with benefits and normal interest-bearing savings, then this dramatically increases the need for superior performance from other types of investments. We need more income from stocks, bonds, real estate, and precious metals - and a better understanding for how to allocate between those categories.
Since the financial crisis of 2008 - we have already seen a transformation in how markets work. What is happening with interest rates, the relative importance of central banking decisions, and the impact of central banks and rates on stock and real estate prices are all quite different than they used to be.
And while some hope for a return to the "normality" of days gone by - the combination of a starting $20 trillion national debt and an imminent multi-trillion dollar surge in Social Security and Medicare payments would seem to suggest the direct opposite. We may just be getting started here, when it comes to changes in markets and what determines investment performance.
The Stage Three conceptual analyses identify and discuss this potential transformation, and quite explicitly take into account how some of the ways in which we know the future will be different from the past may be expected to change investment risks and opportunities across the different categories. Which then potentially changes allocation decisions.
Making investment decisions that incorporate the national debt, benefit payments and the intertwined relationship with interest rates does not guarantee outcomes - but it does shift the odds in our favor, if we do believe those are likely to be dominant influences.
What financial planning for retirement involves is decades of hard work and deferred gratification when it comes to building savings and an investment portfolio. The intent is to deliver a higher standard of living and more financial security in retirement - and this is also potentially over a period of decades.
The bridge between the decades of savings and the decades in retirement - is built by the decisions that we make today. The "How The National Debt & Surging Benefits Will Transform Retirement Planning" research report provides the in-depth and understandable information needed to raise the odds that we will make better decisions in three vital areas.
Which in combination can materially increase the odds that our decades of building savings will indeed lead to the standard of living and financial security that we are seeking in the years ahead.
Purchase the Research Report
Satisfaction guaranteed or your money back.
(30 day return period, see the purchase page for more information on the guarantee and value packages.)
Disclaimers
Please note that the research report is of a strictly educational nature, rather than the rendering of professional advice. The future is uncertain, and there are no guarantees or promises of success or particular outcomes. As with any financial decisions, there is a risk that things will not work out as planned, and with hindsight, another decision would have been better.
The research report will not include specific investment, legal or any other form of professional advice. If specific advice is needed, it should be sought from an appropriate professional. Any liability, responsibility or warranty for the specific results of the application of the general educational principles contained in the research report, either directly or indirectly, are expressly disclaimed by Daniel Amerman.