
How The National Debt & Surging Benefits Will Transform Retirement Planning
By Daniel R. Amerman, CFA
TweetWe know three things about today, the next ten years - and next thirty years - that are very different than the past.
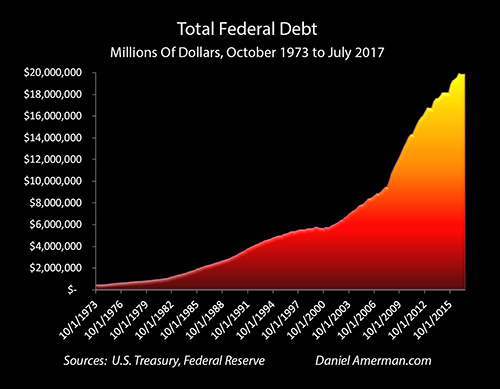
First, we know that the total United States government national debt is currently about $20 trillion, and that it is equal to about 105% of the size of the national economy.
Second, we know that interest rates around the world are still close to the lowest levels in recorded history, and in the United States are still far below those of previous decades.
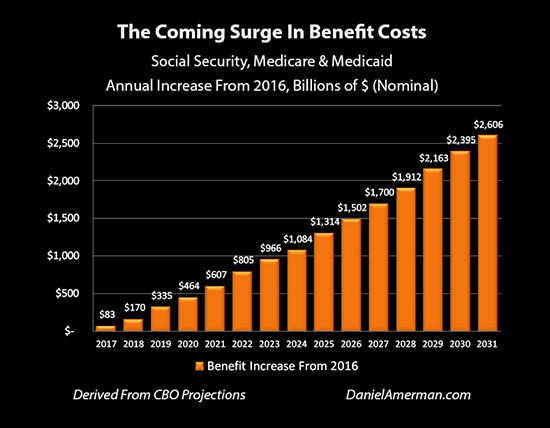
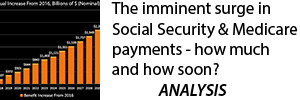
Third, we know that there will be a tremendous acceleration in Social Security and Medicare benefits payable over the next 10 years and beyond. As introduced in this analysis, the amounts involved are staggering - and these expenses will arrive much faster than most people realize.
We have never before experienced this powerful three-way combination; it will be a new set of circumstances for retirees, savers and the markets.
It is routine among some commentators to dismiss concerns about the size of the national debt - with such dismissals often serving various current political and financial agendas.
However, when the United States national debt doubled in the aftermath of the financial crisis of 2008 - it necessarily transformed how retirement finances as well as investing in general will work in the 2020s and 2030s (and beyond). One impact of the increase in the national debt will likely be to change the daily standard of living of tens of millions of retirees over a period of decades.
There is a fundamental problem with the way that many people are preparing and planning for their retirement in particular, or long-term investing in general. That is, it is the norm to look to the past to determine what is reasonable to expect for the future. But the issue is that the past - if we look at the averages of previous decades - can't repeat itself. The math simply doesn't work.
To see why this is the case, in this three stage analysis we will 1) first look at the national debt in isolation, 2) then examine the costs of the coming surge in Social Security and Medicare payments in isolation; and 3) combine the national debt and increasing benefits to see why the future is likely to be quite different from the past.
Stage One Analysis - The National Debt By Itself (Scenario AB)
For our first analysis (scenario AB) we keep the total national debt at its current sum of near $20 trillion. However, instead of very low interest rates, we assume that interest rates return to their historic averages, which were about 5% higher during the period from 1962 to 2007 (before the financial crisis). Because the federal debt has short, medium and long term components, this increase in interest rates takes a number of years to fully take effect, with interest payments gradually increasing over that time.
We also remove the coming surge in retirement benefits, and leave them level as a percentage of GDP at 2009 levels into the indefinite future - the same place where we were before the first of the Boomers reached the traditional retirement age of 65. This isolates the increase in the national debt, separating out the coming surge in Social Security & Medicare payments.
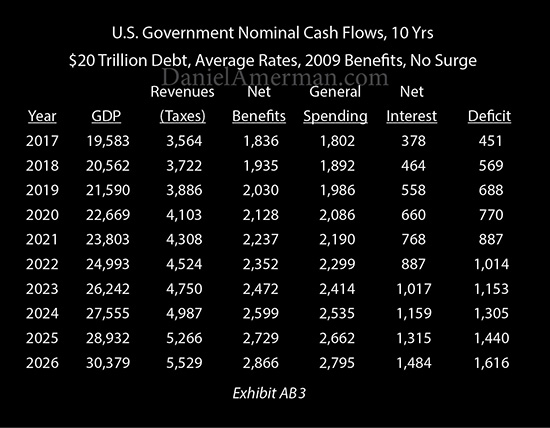
The column in Exhibit AB3 to pay particularly close attention to is the "Net Interest" column. Interest payments on $20 trillion in debt start where they are now, and as federal debt is rolled over and refinanced at historically average interest rates, the interest payments steadily climb upwards. This sends the deficit into a rapid climb. The increased deficits increase the national debt, which then further increases the interest payments, which further increases the deficits, and that then increases the debt at a still faster pace.
Simply returning to paying historically average interest rates on a $20 trillion debt would create a situation where by 2024 the annual budget deficit would exceed 50% of normal government spending, meaning a dangerous range has been entered. (From 1962-2007, ten year Treasury yields were an average of 5% higher than the fall of 2016.)
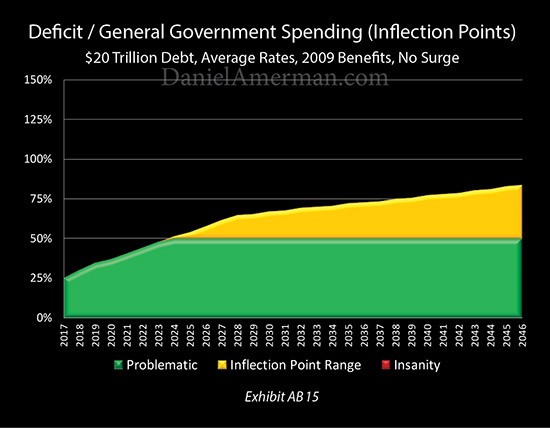
In that range, represented by the yellow above, the financial situation of the United States government grows a little more precarious each year.
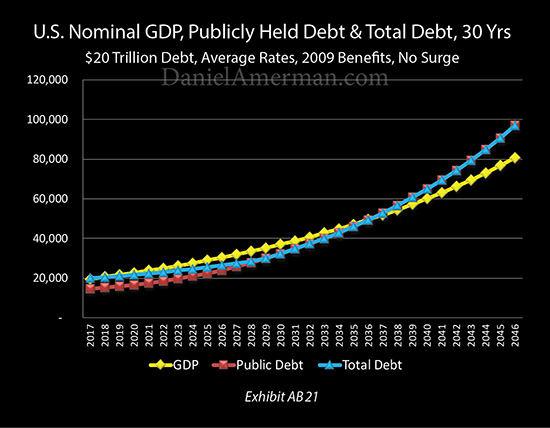
The full impact on the size of the debt can be seen in Exhibit AB21. The national debt now doubles to over $40 trillion (in nominal dollars) by 2033, and doubles again to over $80 trillion by 2044. It also grows increasingly unaffordable relative to the yellow line of the size of the national economy.
(These exhibits are excerpted from the research report "How The National Debt & Surging Benefits Will Transform Retirement Planning". A full description of the research report is linked here. Key assumptions for the A module scenarios shown herein include a 2% real long term economic growth rate and a 3% long term average inflation rate.)
Stage Two Analysis - Isolating The Coming Surge In Benefits (Scenario AC)
Now, whether the national debt had doubled or not - we have known for decades that major financial challenges were on the way. What scenario AC examines is what would have happened if the national debt had not doubled - but we did have to pay for a surge in retirement benefits as the Boomers aged.
Even without a much higher national debt - this is still quite problematic. As of 2017, we are still very much in the early stages of paying for the retirement of the Boomers. Regardless of the national debt, things were about to get much more expensive anyway, and at a rapid rate.
To isolate the surge in Social Security and Medicare payments from the $20 trillion national debt, the national debt is brought down to $9 trillion, and interest rates are increased by a much more modest 2%, meaning they remain quite low compared to long-term historical averages. Social Security and Medicare (and Medicaid) begin not at their 2009 levels as in the previous scenario, but at the significantly higher 2016 levels, and they increase in fiscal year 2017 and each year thereafter, as further analyzed here.
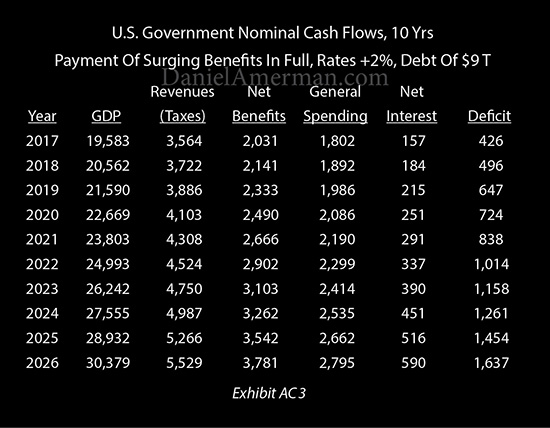
As can be seen above, the deficit problems arising from the "Net Interest" column have been greatly reduced. But now there is an issue with the "Net Benefits" column. Social Security and Medicare expenses rise from $2 trillion in fiscal year 2017, to almost $3.8 trillion per year by 2026.
This is enough to drive deficits up to over $1 trillion per year by 2022, and over $1.6 trillion per year by 2026.
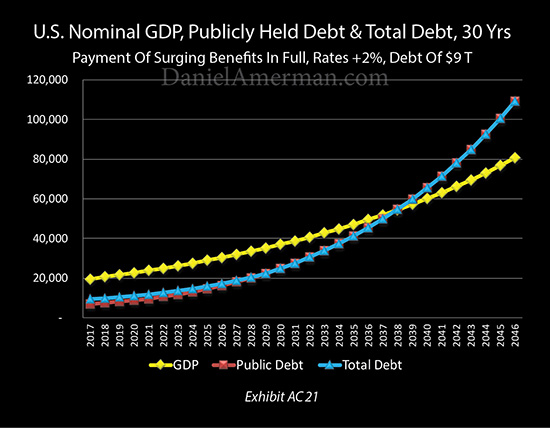
As shown in exhibit AC21, just the increase in benefits by themselves are transformative. The debt doubles to over $40 trillion by 2035, and doubles again to over $80 trillion by 2043.
This creates a situation by 2040 where benefits and net interest payments by themselves would consume all government revenues. One hundred percent of all "normal" government spending, including everything from defense to housing to paying all federal employees to keeping the lights turned on at the White House - would all need to be borrowed each year.
That is unsustainable for any period of time. Indeed, the word "insane" could reasonably apply to such a situation as well; situations like that have never turned out well in any nation. That is the reason for the AC15 exhibit below, which is designed to be an intuitively understandable one page summary.
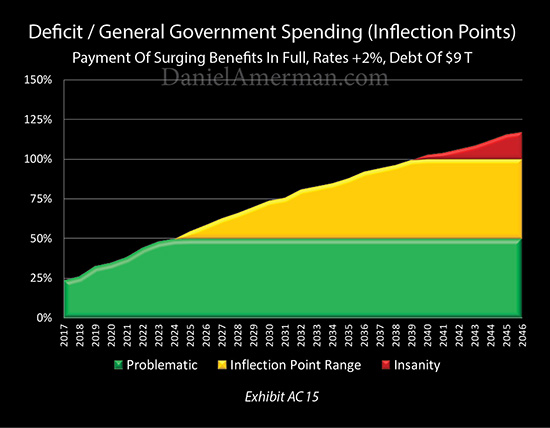
If the nation reaches the red zone, where annual deficits exceed all normal government spending (exclusive of benefits and interest) - then the "insanity inflection point" has been passed, and that is a prescription for an imminent financial disaster scenario in the 2040s.
The yellow zone is the "insanity inflection point" range where the deficit is between 50% and 100% of normal government spending. It is (just barely) reached by the end of fiscal year 2024 in this scenario, and it is in a dangerous range from that point forward, where the national debt rapidly mounts, putting ever more pressure on benefits and interest rates. An "inflection point" where government finances quickly spiral out of control could be reached at any time. But there can still be a path out.
The green zone deficits are where less than 50% of normal government spending is borrowed, and it too can be quite problematic. But this can also be sustainable over time, and government debts may decline as a percent of GDP in this range. (The colors and round number percentages are intended to provide an intuitive single visual measure to easily compare otherwise complex scenarios with many components moving relative to each other over many years.)
Long before the financial crisis of 2008, many Boomers (and younger) had been skeptical about getting their benefits in full in the way promised. As shown above - they had good reasons for those concerns, even based on what we knew then.
Stage Three Analysis - Combining The National Debt & Surging Benefits (Scenario AD)
The current reality, however, is that we face both issues simultaneously. The national debt did double. It is not 2009 anymore, retirement benefit expenses are already much higher, and we are now on the verge of the ramp-up period where Social Security and Medicare payments begin soaring upwards every year.
Exhibit AD3 of the research report shows what happens when we combine the same economic growth rates, the same tax collections, the current national debt, the costs associated with making future benefit payments in whole, and from this day forward pay historically average market interest rates (1962-2007) on all maturing and new Treasury debt, as it rolls over or is issued.
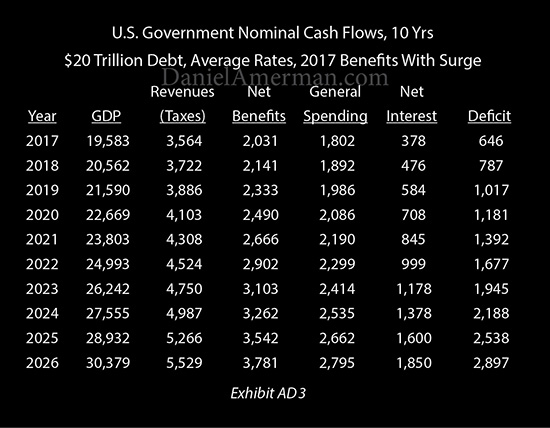
The "Net Benefits" and "Net Interest" columns are now working in tandem, and simultaneously increasing the deficit. This causes the deficits to explode upward, reaching $1 trillion per year by the end of the 2019 fiscal year, $2 trillion per year by 2024, and almost $3 trillion per year by 2026.
As plainly shown above - we have two major financial issues and they reinforce each other to create something that is far worse than either by itself.
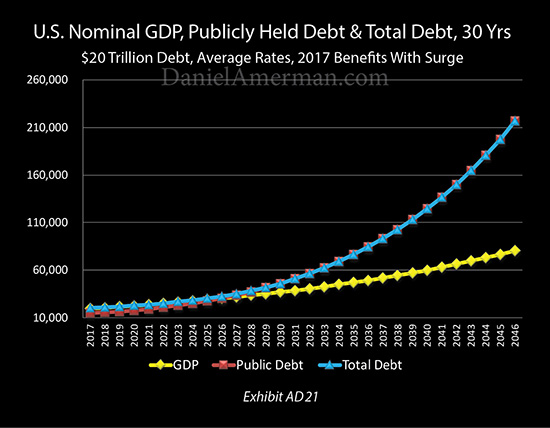
As shown in Exhibit AD21, the surge in deficits means that the national debt now climbs much faster, doubling to $40 trillion by 2029, and doubling again to well over $80 trillion by 2036. And the higher the debt goes - the larger the interest payments, which further increases the annual deficits, which are also simultaneously being fed by the ever increasing retirement benefits, which leads to an even faster increase in the national debt.

There is no getting around the fact that for the nation as a whole, the three factors of the national debt, retirement benefit payments and interest rates are deeply and inextricably intertwined.
There is also no getting around the situation that for individuals, the two major components that will determine standard of living in retirement are benefits and savings. And if the assumptions are not correct about benefits and savings - then on a reality basis, many individual retirement plans may be completely mistaken.
The tight linkage between their future interest earnings, their future benefit payments and the future size of the national debt could be the number one determinant of actual standard of living in retirement in the next 5,10 and 15 years for many millions of people. Yet, relatively few people have thought this through, let alone explicitly incorporated it into within the heart of their retirement plans.
Because the numbers are so large - they will likely impact everything. From economic growth, to deficits, debts, interest rates, bond markets, stock markets, real estate, precious metals, currency values, tax laws, and retirement account regulations - everything will be in play.
Unfortunately, a common financial and retirement planning approach is to ignore the national debt, the coming benefit surge, and how they are intertwined. This includes investment and saving decisions - and Social Security claiming decisions as well.
Pretending this isn't happening, however, is a luxury that only works when the changes are in the distant future. What the numbers quite plainly show is that we will begin rapidly losing that luxury over the coming years. And plans that do not take this new and dominant reality into account - risk going entirely off track.
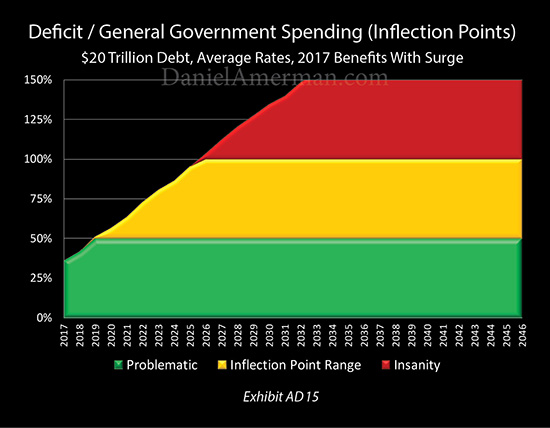
The speed can be seen in Exhibit AD15 above. If starting at the beginning of the 2017 fiscal year we had complete normality by historical standards, then the green zone only lasts through 2017 and 2018, the yellow zone is just barely entered into by the end of the 2019 fiscal year, and we are in the red zone by 2026.
Now, in looking at the graph above, it could be easy to make what is referred to in the full research report description as "The Doomsday Mistake". That is while yes - a financial disaster scenario could happen, with potentially catastrophic consequences - there is no need for it to happen. It is in no way inevitable.
Exhibit AD15 is not a forecast - but an identification of constraints. If the United States starts with $20 trillion in national debt, pays historically average interest rates to fairly compensate savers for the use of their money, and makes all retirement benefit payments with full inflation indexing - it doesn't work. An impossible situation is created. And such a scenario falls apart with great speed.
We truly have not been in this place before. The old assumptions just can't work, not when we look at the intertwined relationships between the national debt, retirement benefits and interest rates.
However, if the constraints are followed and if those intertwined relationships are taken into account, then the future can be stable, and no doomsday or crisis scenario is needed.
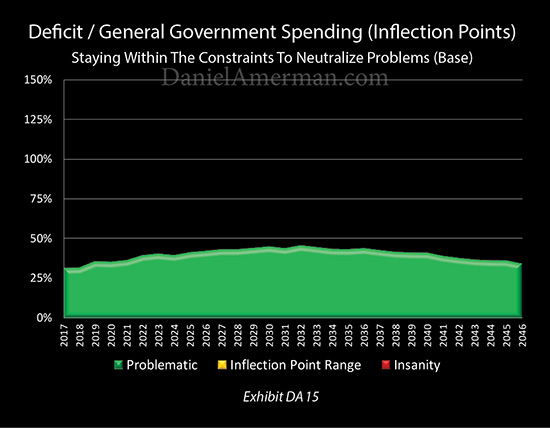
As shown above in Exhibit DA15 and analyzed in the "Five Ways Of Staying Within The Constraints" module of the research report, we can take the exact same economic growth and tax collections from the previous three scenarios, and stay entirely in the green zone for the next 30 years, never sending the deficits or the national debt out of control, even while making steadily increasing individual retirement benefit payments each and every year. Indeed, there are a number of different ways of doing this.
But we can't do that with the "old normality". It requires a "new normality", and the difference can change every aspect of retirement financial planning.
It also needs to be recognized that we are still in a relatively early stage compared to where we will be 5, 10 or 15 years from now. The farther out in time we go, then the more financially dominant the national debt and increasing national retirement benefit payments will become, and the greater the impact on individual savings and investments, as well as individual benefits.
This analysis is an excerpt from the full description of the research report, "How The National Debt & Surging Benefits Will Transform Retirement Planning". The three volume research report itself goes into much more detail on the issues discussed herein, as well as many related subjects. More information is linked here.