

The Secret History Of A 70% Market Loss - What A Secular Bear Market In The 2020s Could Look Like
By Daniel R. Amerman, CFA
TweetCan the U.S. economy actually be turned on and off like a light switch? What are the implications for investors if it can't?
The shutdown of much of the American economy in response to the COVID-19 pandemic has already created what is by far the single largest increase in unemployment in U.S. history in such a short period of time.
We are experiencing two quite distinct but interrelated forms of supply shortages that may just be in their early stages. One is the combined result of the collective (and very short-sighted) decision to make much of the world's supply chain dependent on one nation, that of communist China, even while slashing the supply of inventory down to "just in time" levels, with no room for error.
All else being equal - shortages usually translate to inflation, and major exogenous supply shocks can lead to rapid inflation. And if when the system rebuilds, for at least a few years things like national security and robust supply chains are taken into account, rather than a pure focus on fragile efficiency to the exclusion of all else, well, that also leads to higher prices, which also leads to inflation.
The other major issue is that the economic shutdown has cut off the production of goods of many kinds in the U.S. In most areas, simply going to the grocery store is already enough to see both shortages, and soaring prices. A current example is eggs having gone up to $5 a dozen locally, a 400% increase over the usual sales price in February - and they are still getting harder to find. The number of items with shortfalls and the degree of the increases are likely to be increasing in the weeks ahead.
Now, many of the specifics remain to be determined, and many arguments can be made. The problem is that we are still falling, fast, and until the medical reversal happens and economic stability is reached, no one knows had bad it will be at that point.
For those expecting a very profitable market rebound as a near certainty in the next 1-3 years - well, maybe. Watch the Federal Reserve. But absent extraordinary interventions ( a certainty) and assuming that they succeed (far from a certainty), we have a very good example of long term stock market performance with a far lesser supply shock, and less unemployment.
This analysis is part of a series of related analyses, which support a book that is in the process of being written. Some key chapters from the book and an overview of the series are linked here.
How Inflation Hid A 70% Market Loss: 1968-1982
The danger is that history shows us is that once control is lost - it is very hard to bring inflation back under control, and it can be very hard to bring unemployment under control. The U.S. is currently creating a simply unprecedented combination of production shutdown and staggering job losses. Can a switch simply be flipped, and both just return to normal?
There is no example of this switch being flipped and a swift return to the prior situation - because this situation has never happened, and it is pure speculation to say it would. However, history in the modern era in the United States does contain a very good example of what can happen to long term investment returns when control has been lost over inflation and employment. Consider the following graph.

As shown in the yellow/orange, the Dow Jones Industrial Average reached 919 in May of 1968, and by August of 1982, had fallen to a level of 777, for a loss of 15%.
Many investors recall this "Lost Decade" for the stock market when the market stayed flat to somewhat down - moving sideways but never persistently up, and what is seen in yellow is consistent with that market perception. It also looks obvious that this overall flat market with a great deal of volatility would have generated some really good opportunities for astute market timers.
However, reality is that a 15% loss in a long-term sideways market isn't what happened at all, not when we look at what a dollar would buy. That is, in 1982 the US dollar was only worth 35 cents compared to what it would have bought in 1968, because the dollar had lost 65% of its value to inflation.
As shown in blue in the graph, when we adjust the August, 1982 Dow index of 777 to account for a dollar being worth 35 cents, then the real value of the Dow drops to 274. So when we consider the purchasing power of the dollar, then our stock portfolio wasn't flat, not even remotely close. Instead, it had dropped by a staggering 70% in fourteen years, from 919 to 274.

Now while this 70% decline in the value of what our assets would buy for us was entirely real, to this day many of us don't realize just how bad it was. That is because inflation in prices was hiding deflation in investment values. The 65% plunge in the value of the dollar "hid" the 70% plunge in the value of stocks, with most of the surface value of the Dow index by 1982 consisting of dollars that were worth far less than what they had been before.
Those 14 years are the best modern era example we have of what happens when control is lost over both inflation and employment at the same time. There were no magic switches involved that swiftly brought everything back under control - the government and Fed were trying everything they could, and there were still many painful years until stability for prices and jobs were regained.
Indeed, this secular bear market and staggering 70% real loss could be called the only example for what happens when a situation even vaguely like this occurs. There is zero precedent for a fast restart - and while arguments can be made for that, these arguments have to be seen for what they are at this stage - theory and speculation.
It's not that a fast restart can't happen, nobody knows at this stage as the shutdowns continue. But to act as if a fast restart is the most likely course and a reasonable and prudent person can therefore confidently invest on that basis - is arguably a bit on the absurd side, particularly for someone in retirement or nearing retirement and who is supposed to be investing conservatively with the body of their savings.
Three False Peaks & Inflation Hiding Deflation
Even though long-term asset deflation of 70% (in real terms) was the result of persistent high unemployment coupled with inflation, many investors and newspaper readers of a certain age may not remember the 1970s that way at all. Instead they may recall three powerful bull markets when the Dow repeatedly flirted with the "magical" 1,000 mark. Each surge filled innumerable financial columns with the hopes that the good times and a long term bull market had returned again, with those hopes being quickly dashed as the market repeatedly proved unable to sustain itself above the 1,000 level.
Perceptions don't change reality, however, which is that there never were three bull markets, but rather only an inflationary illusion fooling the public. Indeed when we look closely, instead of seeing three peaks, we will see three historical object lessons in how destroying the value of money can hide the destruction of the value of assets - and repeatedly fool the headline writers along with much of the investing public.

The cold reality of the Dow adjusted for inflation is shown in blue. There aren't three interim peaks, but merely a market moving steadily and powerfully down.
The "bull market" that peaked in January of 1973 when the Dow hit 1,047 - was in a reality a fall to Dow 848 (asset deflation in inflation-adjusted terms), that was masked by the dollar being worth only 81 cents when compared to May of 1968 (monetary inflation). Inflation had created an almost 200 point illusion in the Dow.
The "bull market" that peaked in September of 1976 at 1,014, really represented the Dow falling by over 300 points - translating to asset deflation of 34% - which was hidden from savers by the illusory profit created as a result of the dollar dropping in value by 40% (monetary inflation).
The cruelest illusion of all was the "bull market" of April of 1981, when the Dow finally reached 1,024. Because the real value of the market had fallen to 399, and a 57% destruction of the purchasing power of investor assets was being entirely hidden by the 61% destruction of the value of investor dollars.

Fully understanding this relationship of simultaneous monetary inflation and asset deflation is absolutely essential for financial survival, because there is a reasonable chance that we may all be seeing the greatest "bull market" in stocks that we have ever seen in the 2020s - but it won't necessarily work the way investors today think it will.
(We will use "monetary inflation" interchangeably with "price inflation" herein.)
Three Wealth Destroyers vs "Perfect Timing"
In my opinion, the greatest threat to long-term and retirement investors is the wealth-destroying triple combination of monetary inflation, asset deflation, and inflation taxes.
One of the most common investor approaches to a truly difficult market is to attempt to "outrun" the problems. Just make better decisions than the rest of the public, and make so much money that the problems can be overcome and wealth kept intact.
How well does that work in practice and just how good do you (or your financial advisor) have to be?
To answer that question, we will go back in history and assume that through the use of a time machine (or peerless skill, or uncanny luck) we did a perfect job of long-term market timing during an environment of asset deflation and monetary inflation.
Aided by this time machine, we put every dollar we had into the market on May 26, 1970, when the Dow closed at 631. What makes this day remarkable is that 631 is the lowest level the Dow index closed at between November 20, 1962 and September 12, 1974. It was the single cheapest day to buy stocks over an almost 12 year time period, and at the time, the lowest that stock prices had been at in more than 7 years. Perfection.
Subject to the conditions that 1) as long-term investors we need to be in the market ten or more years, and 2) that we want to stay within the 1968 - 1982 period of sustained asset deflation and high monetary inflation, we instruct our time machine to find the best possible place to sell. This turns out to be April 27, 1981, when the Dow closed at 1,024.
April 27, 1981 was the single highest close for the Dow index between January 22, 1973 and October 19th, 1982. So we buy in on the exact day with the lowest stock prices in an almost 12 year period, and we sell everything out on the exact day with the highest prices over an almost a ten year period. Double perfection!
So then, how did we do? As shown in the following graph, which begins on our purchase date and ends on our sale date - our time machine allowed us to get the best possible results in a thoroughly bad market. If our returns had exactly tracked the Dow between when we bought and sold, our perfect timing would have taken us from 631 to 1024, for a 62% price gain in the midst of one of the worst markets in memory.
A whopping profit indeed! Before we adjust for inflation, that is, so let's do that. A dollar on our sale date in April of 1981 was only worth 43 cents compared to what it was worth on our purchase date in 1970. When we adjust for what our assets will buy for us - we have Dow 440, not Dow 1024. So even the absolutely perfect timing delivered by our time machine leads to a 30% asset deflation loss in real terms, not a 62% gain.

The Internal Revenue Service did not "see" these losses, however. To the contrary, it was quite impressed by our remarkable investment prowess. Moreover, taxes were higher back then (when we confine ourselves to federal income tax rates, even after the tax hikes at the end of 2012, we are still at a relatively low level now compared to much of the modern era). Assuming we were in the highest income tax bracket, and traded often enough to pay ordinary income tax rates, then given that the average top income tax rate over that period was 68%, this means that we would have paid out 267 in taxes on our 393 gain.
These taxes on effectively non-existent income are known to economists as "inflation taxes", and they can be devastating.
Subtracting out real taxes on imaginary income leaves us with Dow 757 in after-tax terms, and Dow 325 in after-inflation and after-tax terms. Thus, even with our quite unrealistic assumption of absolutely perfect market timing - which allowed us to radically outperform almost every other investor in the nation - we still lost almost half (48%) of the purchasing power of our net worth.
Lessons Learned & Implications For Today
The most important takeaway from our time machine scenario is not about 1970 or 1981, but about what investors face today.
History does show what can happen next for an entire nation with a deeply troubled economy. For more than a decade, the markets and investor wealth can be dominated by the deadly combination of:
1) a crippling destruction of the purchasing power of investment assets;
2) a masking of this asset deflation by the destruction of the purchasing power of money; and
3) this masking then generating illusionary "profits", upon which taxes have to be paid, which then compounds the damage.
Moreover, history shows us quite clearly that when all three of these major wealth destroyers are working together in the real world - conventional investing methods cannot withstand the destruction of investor wealth that occurs across the nation and over the long term. Even when we used the extraordinary assumption of perfection in timing - there was still a crippling asset price loss in real terms. Of course, real world investors who didn't have the benefit of assumed perfect timing lost even more money.
Secular bear markets are entirely real - they are the reality of history, and what we just reviewed is only one example. It is the idea of a bear market being a brief and reliable buying opportunity that is myth, over the long term.

As shown in the graph above of expansions and recessions from Chapter 2 - when we look back over time, what we had been living in could in some ways be called the aberrant exception. Recessions always happen, given enough time.
From a long term perspective - the so-called "once in a lifetime" recession associated with the financial crisis of 2008 was not actually all that unusual or all that bad, as can be seen when we look at the frequency and size of the yellow bars on the left side of the graph. People who think it was something incredibly unusual, just don't know long term economic history (and most don't).
We were at record stock highs, in no small part due to heavy-handed interventions by the Fed, keeping interest rates at historically abnormal lows even before the swift recent return to 0%. We are currently in the process of taking it on the chin with one of the heaviest economic blows that we have ever seen, and we are still in the early stages at this point. We simply don't know how long it will last, or whether there will be a second wave and a second shutdown, as China appears to currently be experiencing in at least some provinces. Japan is also experiencing a second wave after good control with the first wave, and it is taking bigger measures to contain this second wave.
It is also worth noting as seen in the secular bear stock markets of the early 1900s, the 1930s and the 1970s - both recessions and bear market downturns can occur in waves as well. Setting aside the specifics of pandemics occurring in waves (the second wave of the Spanish flu pandemic was by far the worst), new lows in secular bear markets could almost be called the rule rather than the exception, when new bottoms are set in waves that can occur years apart.
We can very much hope for a fast recovery, and I very much do. But, the idea that history shows that we can treat this as a reliable buying opportunity with a bounce back in the next few years - is based on an almost complete misunderstanding of actual financial history.
Consistent & Long Term Cycles, Not One-Off Front End Events
Particularly for someone who is retired or near retirement at this stage - if we are indeed entering a secular bear market for stocks, then instead of being a short term deviation, the current bear market and recession could become dominant events over an entire retirement. Now, that doesn't mean "end of the world" or "doom & gloom", but for many people this could be a very good time for a complete reassessment of assumptions and planning.
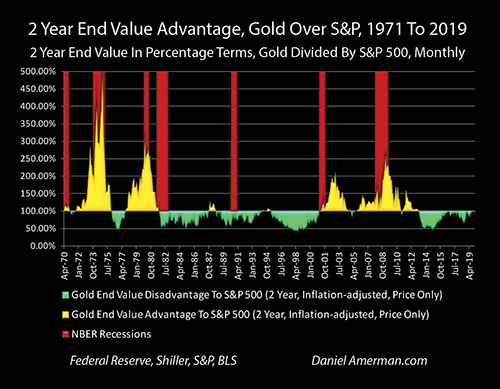
The above graph is from Chapter 19 (link here), and it shows the rolling advantages to investing in stocks or gold on a two year, inflation-adjusted price basis. The yellow areas are advantage to gold, the green areas are advantage to stocks.
Two particular items to note: during the horrific time for stocks during the 1970s as covered in this analysis, look at the spectacular height of the spikes upwards for the contracyclical asset class of gold. Then examine the yellow area in the 2000 to 2012 era, and the twin stock market blows of the collapse of the tech stock bubble and the financial crisis of 2008.
Whether someone was in stocks or gold was of extraordinary importance during each secular bear market in stocks, and each secular bear market in gold.
What is even more important as covered in the linked analysis, is the consistency of the advantages. Those are rolling two year comparisons, so the initial advantage to gold over stocks is gone within two years of the first start of the bear market. Yet, the rolling ongoing advantage of gold over stocks just rolls on and on, as the secular bull market of the contracyclical asset of gold continues year after year, even as the secular bear market for stocks rolls on year after year.
What history clearly and convincingly shows us is that when a turn occurs - it isn't just the front-end surprise and transition that matters. The great majority of the relative advantage of gold to stocks in the yellow graph area occurs long after the initial shock and change, just as the great majority of the rolling relative advantage of stocks to gold in the green area just goes and goes. These are long term relationships, the front end just sets the stage.
So, when we look at the advantage of being in gold over stocks on an inflation-adjusted price basis, most of the 12 to 1 advantage of the 1970s occurred years after the initial stock bear market. Even as most of the cumulative 325 to 1 advantage over the first 30 years, for those who pivoted from gold to stocks in 1980, was accrued long after 1980.
One way of adapting to a potential secular bear market in stocks is to go all in - sell all stocks, buy all gold, and patiently buy and hold for many years, before trying to identify the next secular bull market in stocks. What history shows us is that if someone had done that successfully over the last 50 years - they would have done spectacularly well.
But that said - there is no need to do anything that radical. All we have to do is recognize the compelling historical relationship between the contracyclical assets, allow for the reasonable possibility that we are entering a secular bear market in stocks that could dominate the next ten or more years - and consider whether we are set up for that? (An alternative way of asking the question is whether someone is so sure that we are not entering a long term bear market for stocks that they are willing to bet their standard of living and security in retirement upon it?)
How many retirement strategies are set up to handle a true secular bear market for equities, where stock prices could be lower in inflation-adjusted terms in ten years than they are today? This is a fascinating question because the usual answer is to simply assume the possibility away, as in reasonable people don't think that.
However, what actual history (which can be a very different thing from prevailing market paradigms) shows us, as captured in the green and yellow graph above, is that more than 40% of the last 50 years were secular cycles of relatively poor performance for stock prices on an inflation-adjusted price basis, where gold did better on a relative basis, year after year after year.
If that perspective can be accepted at all - what actually happened - then there is a strong case not for panicking, not for necessarily selling all stocks, but to step back on a very deliberate basis and reassess. If there is a reasonably strong possibility but not yet a certainty that there could be a third round of a secular bear market in stocks, are there ways of significantly reducing risks while hopefully still generating substantial profits on an inflation-adjusted basis over the years?
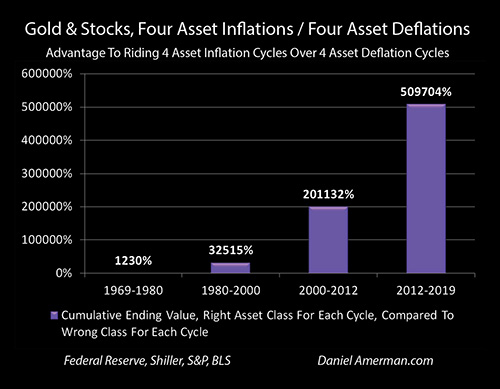
Once the contracyclical relationship is accepted, then three risk-controlled methods of improving returns are 1) using simple annual averages rebalancing techniques that are asset neutral (50% stocks / 50% gold); 2) using tilted (not 50/50) contracyclical ratio strategies to seek gains in the favored class while using the insurance component of the contracyclical asset to greatly reduce asset choice and timing risks, and 3) using secular rebalancing techniques for tilted or neutral contracyclical ratios that improve returns and reduce asset choice risks while neutralizing timing risks.

As can be seen in the purple bar in the graph above (explanation in the analysis link here), just going to a basic 50/50 ratio of the contracyclical assets with annual averages rebalancing would have over the 50 years studied increased total inflation-adjusted price returns by about 50% over either of the individual asset classes of stocks or gold. Sticking to a market neutral 50/50 ratio but going to a more sophisticated rebalancing method specifically designed to benefit from secular cycles for contracyclical assets, would have led to an almost 150% advantage over either underlying asset class on an inflation-adjusted price basis, as can be seen with the blue bar on the right.
A Third Cycle Of Crisis & The Attempted Containment Of Crisis
Will there be a secular bear market? Based on normal history - the answer is probably yes. However, we are not in normal times, nor have we been for some time.

As introduced in Chapter 1 (link here) and developed at length in later chapters, the Federal Reserve's extraordinary and increasing interventions did indeed contain the previous two cycles of crisis. The Federal Reserve followed what could be called a "playbook" in containing the two previous crises - and as anticipated, it is doing the same on an amplified basis with the current crisis.
Four distinct elements that I developed in a series of analyses and chapters well before the Coronavirus pandemic, were to expect when a new recession hit (from any source) a 1-2-3-4 of 1) zero percent interest rates; 2) massive new monetary creation by the Federal Reserve; 3) record long bond prices and profits; and 4) record new deficits, to try to limit the market and economic damage from new recession.
That is exactly what has been happening. The Federal Reserve is following the anticipated playbook, using extraordinary tools to try to contain recession and market damage. The U.S. government is doing the same.
The plunge in the stock market was at least temporarily contained - but it wasn't anything "natural" or something to be expected from a long term study of economic history or stock market history. The markets were very specifically reacting to the forcing of rates to zero percent, the announcement of unprecedented monetary creation by the Federal Reserve, and the announcement of unprecedented deficits and stimulus spending by the U.S. government (that are ultimately likely to be funded by Fed monetary creation).
There is no long term stock market history for the Federal Reserve creating money by the trillions to try to contain a crisis - that never happened before 2008. We have no precedent for massive government stimulus spending that is itself funded by central bank monetary creation successfully overriding the economic cycle.
However, it is this actual and promised monetary creation funding of both the Fed's massive interventions, and the government stimulus spending as part of an attempted 3rd cycle of the containment of crisis, that has been actually dominating the markets.
This is all an experiment. The coronavirus pandemic itself was a wild card, but for those who have been paying attention, as explored in advance in the free book, we have known that this extraordinary experiment that would ultimately determine retirement investment results for the nation was on the way.
What is likely to determine whether the stock market goes into a secular bear market or not is the battle between two titanic and unprecedented forces: the recession (or depression) produced by shutdowns associated with the attempted medical containment of the spread of the coronavirus, and the attempted containment of the associated economic and market damage.
There is nothing natural about that battle between two unprecedented containment efforts, one medical and one economic.
If we do recover and rebound within the next 1-3 years - it will be because the extraordinary interventions funded by unprecedented degrees of rapid monetary creation succeed. If so, then as developed at length in the free book, we could indeed eventually see the highest stock, bond and real estate prices to date, not in spite of the coronavirus, but as an eventual result of the extraordinary interventions used to contain the economic damage.
If this unprecedented attempted containment of economic damage fails - perhaps as a result of a potential future breakdown of the containment of the coronavirus and a second wave - then there is a very strong possibility of another secular bear market in stocks, perhaps like the 70% inflation-adjusted loss that was experienced between 1968 and 1982, or perhaps even worse. It should also be noted that using monetary creation to fund massive government spending as the primary tool to contain crisis is a truly incendiary combination for creating inflation potentially worse than the 1970s, if it eventually turns out not to work after all.
We can't know which will prevail at this time. But we can recognize what forces are in play, and watch them carefully, while assessing what the implications are and how this may change our choices. Hopefully this analysis has been helpful for you in that regard.
Learn more about the free book.
***************************************************
Read Chapter One Of "The Homeowner Wealth Formula"
Read Chapter One Of "The Eight Levels Of Homeowner Wealth Multiplication"