Using A Contracyclical Rebalancing Hedge For Stocks & Gold To Increase Inflation-Adjusted Returns From Price Changes By 50% While Lowering Risks
By Daniel R. Amerman, CFA
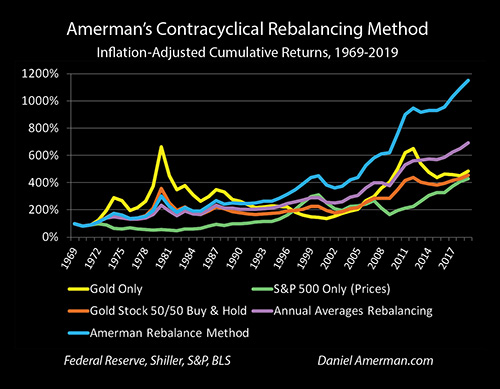
TweetIn this analysis, I would like to show you something simple and powerful that produces better results than it should be able to. It is a system that is market neutral, requires no special timing or market calls, has no need for technical charts, or even for any particular knowledge of finance or economics. But as shown below, on an inflation-adjusted basis over the 50 years from 1969 to 2019 it would have produced 42% to 62% higher returns from price changes than either of the asset classes that make up the hedge, and it would have done so with less risk than that of either asset class.
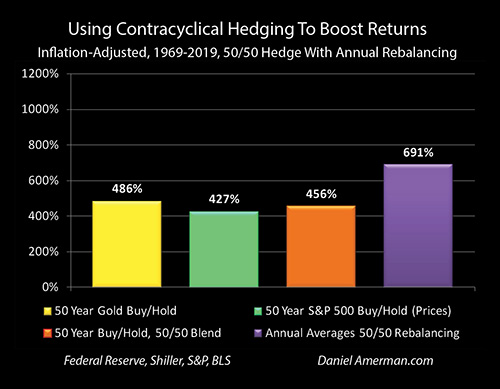
The two asset classes are stocks and gold, and the investment tool is to construct a contracyclical hedge with annual averages rebalancing. As shown above, gold prices climbed 486% in inflation-adjusted terms over that time, and the S&P 500 index rose 427% (not including dividends). If someone had put half their money in gold and half in stocks (as represented by the S&P 500), and left those initial investments in place for the next 50 years, they would have ended up with a 456% investment gain. This is the average of the gains for gold and stocks, as would be expected.
The almost 700% inflation-adjusted gain produced by the purple bar is the result of something quite different. It is a contracyclical hedge that uses annual averages rebalancing at a market neutral 50/50 ratio (more on how that works below).
Notice that the results of this simple tool are much better than any of the other bars. The contracyclical hedge with annual rebalancing produces much better results than gold by itself, much better results than stock index gains by themselves, and an additional 235% of inflation-adjusted gains when compared the average of stocks and gold.
It is also important to note that gold is often purchased as a long term protection against inflation. While it may come as a surprise to many people, the amount of inflation protection that was produced by the contracyclical hedge of stocks and gold over 50 years with annual rebalancing produced 142% of the inflation fighting power over gold by itself, and 151% of the inflation fighting power of a simple buy and hold strategy for gold and stocks.
Each dollar initially invested would become almost $7 of purchasing power over time. A dollar in 1969 would be worth only 14 cents by 2019. In simple or nominal dollars, $100 invested in the contracyclical hedge would have become worth $4,816 over the years, which when adjusted for the 86% loss in value for the dollar, becomes the $691 in purchasing power shown, which is far better than simply owning gold over that time.
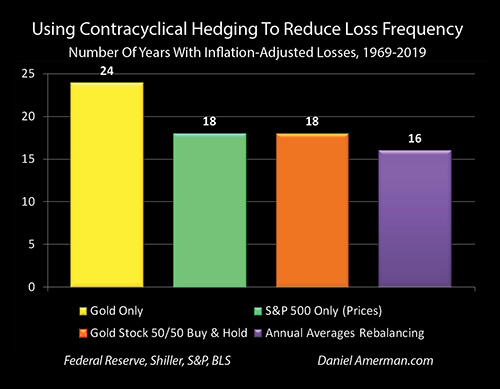
This much larger gain is accompanied by a lower chance of losing money in any given year as shown above.
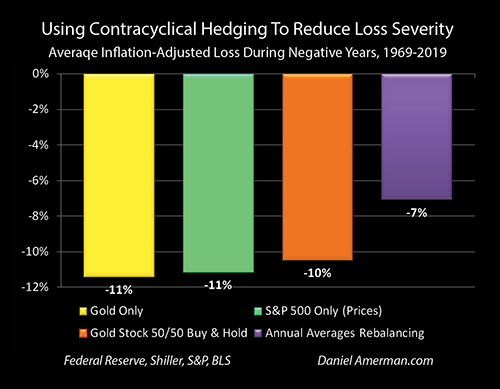
In those fewer years when losses do occur, the average degree of losses are also lower, as shown in the graph above.
That is quite the combination:
1) Much higher returns than either of the hedge components (price only);
2) Much better inflation protection;
3) Less chance of losing money in any given year; and
4) Lower average losses when they do occur.
How does it work and why does it work?
This analysis is part of a series of related analyses, which support a book that is in the process of being written. Some key chapters from the book and an overview of the series are linked here.
A Contracyclical Asset Hedge
Generally speaking, rebalancing is a portfolio tool that is used to keep investments in desired ranges for diversification purposes. As an example, someone might be diversifying 60/40 between stocks and bonds, or 75/25 between real estate and gold.
If stocks went up by 10% but bonds went down by 10%, then it would be a 65/35 portfolio, and the investor would rebalance, selling stocks and buying bonds until they were back to their target 60/40. Because those using rebalancing are selling part of what is doing well to buy more of what is not doing as well, there is a bit of a contrarian skew that is naturally built into the process, gradually selling an asset that is becoming richer in value while buying what is becoming cheaper.
This analysis and the graphs herein are from my new "Gold Out Of The Box, 2020s Edition" materials (brochure link here), and are a small - but potentially quite useful - spinoff from that much broader body of work. I do appreciate all of my readers, and there is no need to buy anything to learn how this hedge works, I will be explaining it here (though I will also provide a look at the results of a more sophisticated strategy as well). Because this is a brief outtake, there isn't the room to explain everything, but enough can be explained for this analysis to be independently useful.
A core part of the "Gold Out Of The Box" materials is stripping out price inflation (changes in the purchasing power of money) and focusing on asset inflation and deflation (changes in the purchasing power of assets), in order to maximize the actual best uses for gold, whether it is as a protection against price inflation, or a way to multiply the gains from inflationary cycles, or to increase the gains from economic and market cycles, or in this case, to play two assets off against each other and to benefit from the contracyclical behavior over time.
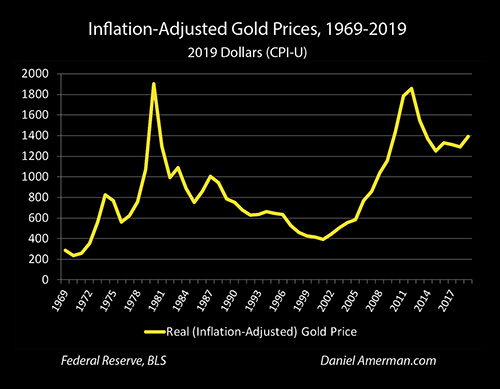
Very briefly, when we look at the gains and losses for gold in inflation-adjusted terms in the graph above, and the inflation-adjusted gains and losses for the S&P 500 in the graph below, they look very different.
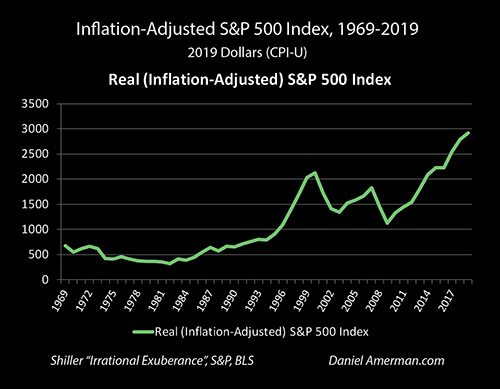
Indeed, once we adjust for inflation, the two asset classes of gold and stocks don't just move differently, but seem to often move in opposite directions over time.
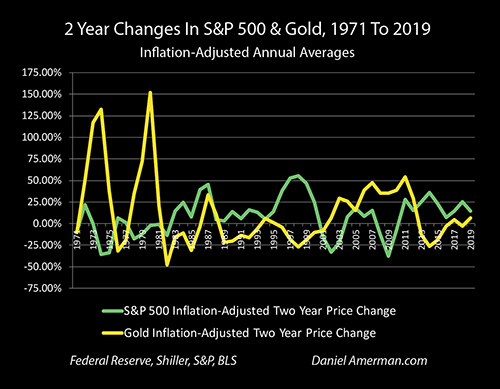
This contracyclical behavior is confirmed in the graph above. While it is not a perfect relationship for each period, for the most part over the years, either gold is moving up while stocks are moving down, or stocks are moving up while gold is moving down. When we look at the scale and the degree of differences between the asset categories - the difference in outcomes for the investor is enormous.
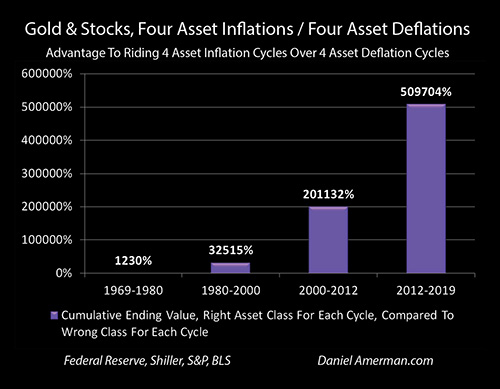
The almost astonishing degree of importance that is involved in being the right asset class at the right time, instead of the wrong asset class at the wrong time, is shown in the graph above. Four long term markets are considered: 1969 to 1980, 1980 to 2000, 2000 to 2012, and 2012 to 2019.
If someone was in the contracyclical asset of gold for the first cycle, they would have ended up 12X better off than if they were in the usual cyclical asset of stocks (annual averages and price changes only).
If someone did that correctly for the first cycle, and then moved to being correctly positioned for the second cycle (gold and then stocks), then they would be 325X better off than someone who was in the wrong asset class for each cycle (stocks and then gold). That is an amazing number for just two trades over 31 years - being a passive buy and hold the rest of the time - and it shows how powerful the counter-cycles are.
Now, let's add a third cycle and a third trade. If someone flipped to gold in 2000 and held it through 2012, then just those three trades in the right order over 43 years would have gained a 2,000 to 1 financial advantage, relative to the ending financial position of someone whose three trades had consisted of stocks to gold to stocks.
If we go all fifty years, and add a 4th trade in 2012, then someone who just made 4 trades over those 50 years, and did the counter-cycles just right with gold to stocks to gold to stocks would have over 5,000 times the money of someone who did stocks to gold to stocks to gold.
Impressive as it is, if we look at this in terms of this perfect hindsight games, of course, there are many different ways of doing far better, particularly if we are looking at things like individual stocks.
What makes things different is that we are dealing with generic numbers for two massive asset classes over the four biggest financial and economic stories of the last fifty years. Over the long term, gold and stocks made massive moves in opposite directions in each holding period, whether we are looking at the havoc wreaked by inflation and the repeated recessions of the 1970s, the comparative calm for the next 20 years, the havoc of the cycles of crisis of 2001 and 2008, and the comparative calm as the containment of crisis prevailed from 2012 to 2019.
So, the then question becomes - if we lack perfect timing or foreknowledge, are there still ways of playing the fundamentals of the counter-cycles, and peeling off at least little bits of that 5,000 to 1 contracyclical relationship over the long term?
As it turns out, there are many ways, and this is one market neutral example, with no market timing whatsoever.
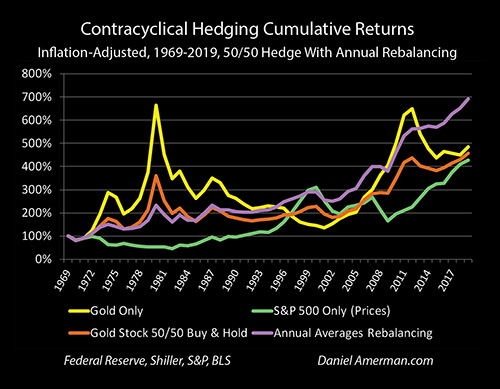
The explanation for how this works can all be seen in the graph above - if one knows what to look for. There are four possibilities, all gold, all stocks, a 50/50 passive blend, and an annual averages rebalancing that resets the 50/50 blend, selling one asset while buying the other to do that.
The purple line of rebalancing goes through the first cycle of 1969 through 1980 in third place, and that is exactly what one would expect. The perfect timing asset of gold is having a spectacular decade, while the contracyclical asset to gold - stocks - is having a horrible decade in inflation-adjusted terms.
What the rebalancing does is to sell ever more gold every year at ever richer prices, and buy ever more shares of stock each year, at ever cheaper prices. Because rebalancing means steadily reducing what is doing well, while steadily buying more of what is not, the purple line of rebalancing cannot keep up with the orange line of a 50/50 completely passive portfolio. Keep in mind, however, that the rebalancing strategy does far, far better than the green line of pure stock ownership - this is a contracyclical hedge, and it more than protects against having gambled everything on the wrong asset class for the cycle.
Because of the ongoing rebalancing - the investor ends the cycle on an automatic basis with a lot fewer ounces of expensive gold than they otherwise would have, and a lot more shares of very cheaply acquired stocks than they otherwise would have.
There was a complete, smashing reversal of course over the next two decades. Gold lost 78% of its value in inflation-adjusted terms. Stocks performed spectacularly well, particularly in the second half of the 1990s. The counter-cycles for gold and stocks completely flipped, with huge consequences for investors.
The yellow line of gold plunges, and so does the orange line of our passive 50/50 portfolio. For stock investors - the green line of stocks does great. For someone with perfect timing - just that one trade at the annual average prices of 1980, one flip from gold to stocks, and they would have been on their way to that 325 to 1 advantage over someone who did the opposite.
For the rebalancer who is not attempting any form of timing, they are pulled down by the plunging gold prices, but because they own far fewer ounces, the damage isn't as bad. On the other hand, all those very cheaply acquired shares of stocks are starting to do very well indeed.
In the year 1985, five years into the counter-cycle to the first cycle, something critical happens. The purple line of the rebalancing strategy moves into 2nd place, passing the passive 50/50 strategy - and it never goes below 2nd place again. Why? Five years into that 2nd cycle, the systematically executed rebalancing has peeled off a little bit of the 5,000 to 1 advantage, just a little tiny bit but enough to move it ahead, and for the next 35 years, the gap between a simple two asset blend and a contracyclical rebalancing strategy just gets larger and larger.
The rebalancing strategy does very well over the 20 year cycle, and indeed produces better cumulative results than gold, stocks or a simple blend for the four years of 1995 through 1998. However, it doesn't do nearly as well as it could, because with each rebalance, more of the stock shares that are doing so well are being sold off, and more of the gold ounces that are doing so poorly are being bought.
Even with those "bad trades" slowing it down, the rebalancing is still ahead of pure stocks (price only) on a cumulative basis through 1998, but it can't keep up with a pure stock strategy at the end of the 1990s, particularly since the gold market was in terrible shape at that time.
On the other hand, when the stock market crisis in 2001 hit, all those years of systematically executing "bad trades" meant that the rebalancer owned far fewer shares of stock than they otherwise would, and they had picked up a large number of ounces of gold at bargain basement prices.
Still, enough stock shares were owned where there was a significant hit in 2001, and a very small loss (in inflation-adjusted terms) in 2002. But the losses were far less than with the stock only strategy - and all those ounces of gold that were systematically scooped up over the years at very low prices were starting to do really, really well.
With this second turn in the cycles, another little sliver of the 5,000 to 1 perfect timing advantage was peeled away, and it was a big enough sliver (in combination with the first sliver) where rebalancing would have the best cumulative returns of any of the strategies for 16 out of the next 19 years.
During this third cycle, while the portfolio as a whole was highly profitable, systematically selling gold to buy stocks with each rebalance did hold down returns just enough, that a pure gold investor who was 100% vested in the spectacular gold bull market of 2000 to 2012 would have passed a rebalancer for the years 2010 through 2012.
However, when the third turn in the cycles occurred in 2012, all those years of systematically selling off little bits of gold at ever richer prices to buy cheap shares of stocks in bear markets - began to pay off in a major way. A third little sliver of the 5,000 to 1 contracyclical advantage was peeled off in the years that followed, as gold losses were lower than they otherwise would have been, while the shares of stock bought cheaply did extremely well in the bull market that few in 2010 or 2012 would have seen coming.
In this fourth cycle - it was entirely the rebalancing strategy in the #1 slot, pulling away from the other strategies. Even with the major gains in the stock market, the rebalancing strategy was so far ahead of the pure stock and 50/50 passive blend strategies that they couldn't catch up, despite the rebalancing strategy having a 50% gold allocation in 2012 and each year thereafter. Unlike the gold strategy, the rebalancing strategy experienced inflation-adjusted positive gains in every year since 2012 (indeed, since 2009), and a rebalancer in 2019 would have been 23% better off in 2019 than in 2012 - despite years of selling stocks to buy gold in the interim.
As noted above, this approximately 50% higher return, and substantially better degree of protection against inflation, is achieved with fewer annual losses than any of the other three alternatives, and with those losses being smaller in the years that they do occur.
A Graphic Look At Another Way Of Doing This
As also previously mentioned this is a small spin off from a much larger set of materials. One issue is that while what is shown above is relatively simple to understand, it does work, and it does have some major advantages - it isn't really designed for getting the most benefit from the contracyclical relationship. What is shown above is really no different from a typical diversification type rebalancing strategy, that when applied to contracyclical assets does indeed "peel off" enough of the cycles and counter-cycles to do really well over the long term.
So, the question occurred to me as I was immersed in these analyses: if the intention of the rebalancing system was not to maintain constant diversification allocations, but it was instead intended to grab a bigger piece of the dramatic back and forth swings in wealth between two assets going through opposing drastic changes in prices in cycles, could we could change the methodology to target getting a bigger sliver at each turn of that "perfect timing" 5,000 to 1 advantage, while still preserving inflation-adjusted capital and without giving up on using a completely market neutral and evenly weighted rebalancing system?
Asking the right questions can be crucial, and yes, it turns out this can be done.
The graph above is part of the new Chapter Five of the "Gold Out Of The Box, 2020s Edition". Because of the focus on increasing the "buy low, sell high" play on the counter-cycles in a market and asset neutral manner, the methodology is able to move into a dominant position based upon just the first 1980 turn in the cycles, becoming the #1 strategy by 1991 and consistently keeping it for the next 28 years.
This better ability to keep a neutral "sliver" of buying whatever contracyclical asset is low and selling it high in the next cycle, then over time substantially boosts the inflation-adjusted wealth advantages over all the other strategies when the methodology gets the 2000 turn in the cycles to work with, and then the 2012 turn.
Another way of looking at this is that as the down asset in the initial cycle, stock prices are never able to overcome their initial years of inflation-adjusted losses relative to this form of rebalancing, and the rebalancing strategy always dominates the green line of a pure stock strategy (not including dividends) over the fifty year historical period. This is a long term version of "sequence of returns" risk by the way - the particulars of when you start and when you end can be extremely powerful even over the long term - and it could be life changing for many stock investors if we were to get another down cycle for stocks over the next decade or so that was anything close to the 1970s, let alone something worse. On the other hand, a 50% ownership of stocks within the contracyclical rebalancing system shown above can do very well with an exact repeat of the 1970s for gold and stocks, with 1970 to 1980 producing a 272% inflation-adjusted gain (and a still quite attractive 187% inflation-adjusted gain with the simple annual averages rebalancing system.)

It is also interesting that in inflation-adjusted terms, the improvement over a base 50/50 buy and hold blend moves from being 51% better to being 153% better (and this is before dividends).
The video introduction above has more on this and quite a few other approaches. (Brochure link here.)
Other Considerations & Dividends
The numbers shown are based on annual averages rebalancing which is the smoothest and most representative form of rebalancing, but not necessarily the best form in practice for any individual. To sell each asset at the annual average price, and buy each asset at the average annual price, would in practice mean doing small rebalances each day that the markets are open over the course of each year, at the prices of that day.
That isn't necessary. Rebalancing could be done weekly, monthly, quarterly, semiannually or annually (or annually plus a day). The big picture remains the same, but the less frequently one rebalances, the greater the "noise" that is potentially introduced, in terms of prices on that day each year differing from the smoothed annual averages.
Now, this "noise" is random relative to annual averages, and the chances are equal that buying and selling on January 2nd of each year (or July 1st, or September 15th) will yield a better result or worse result than the annual averages would suggest. If there is a really big event on a given day or week, a market collapse or the like, then the difference could persist over many years with annual rebalancing, with it again being random whether that would be a plus or a minus. The more frequent the rebalancing, the less the distorting effect when compared to annual averages. In general, things should mostly smooth out as time goes by, with normal market changes.
Taxes and inflation taxes can be an important consideration. If all the assets are held inside a tax-advantaged retirement account, this can be generally disregarded. If held outside a retirement account, then there is a case for only trading at intervals of longer than a year, at least a year and a day, so that taxes are paid at a long term capital gains rate, rather than a short term rate. There are many situations and many considerations, and this one paragraph in this one analysis cannot begin to consider the many variations.
Physical gold is another consideration when it comes to trading frequency, that would be entirely dependent on the individual's circumstances and preferences in terms of how best to deal with that.
As I have written about extensively in the past, dividends and the assumed reinvestment of dividends have over the last 50 years been by far the largest and most reliable source of wealth creation for stock investors. This analysis is intended to be a study of using rebalancing to benefit from contracyclical price movements while preserving the inflation-adjusted purchasing power of capital, rather than a definitive treatment of stocks versus gold over the long term.
Overall, this is a very conservative treatment of identifying and profiting from contracyclical asset inflation and deflation. Each time we move towards a more normal treatment - the results get much better. Stop netting out inflation, and it becomes much harder to see the counter-cycles, but the results look a lot better, with a 48 to 1 return instead of a 7 to 1 for the simple annual averages strategy. Add in dividends and the compounding of dividends on the stock side - and the results look far better still.
It is also worth noting that there are two major distortions that can be introduced by using a 50 year stock and dividend history. The first is that the high dividend levels that created so much wealth in the 1970s and 1980s are long gone, and taking those high dividends and using them to project results from here forward, with the much lower dividend levels of today, is to rely on a phantom asset that no longer exists when it comes to most of the wealth creation and most of the advantages to stock ownership in the future (a summary of some of my previous work on this subject is linked here).
The other issue is the subject of much of the free book and my other analyses, and that is the pervasive distortions that have been introduced by the Federal Reserve's unprecedented use of monetary creation, which has created elevated asset prices, and distorted the price results shown in this analysis. This is not necessarily a problem, but can be quite an opportunity when it comes to future major asset price swings.
Of course, this analysis is entirely based on the last fifty years - and whatever the next fifty years hold, they are likely to be different than the last fifty years. That said, what was explored herein was to set out a simple 50/50 balance in 1969, with no idea what was coming and explore in detail how it handled what actually happened. So long as the future holds both good times and bad times, cycles and counter-cycles with stocks and gold continuing their (quite logical) contracyclical relationship, then this fundamental and asset neutral ability to "peel off" little bits of the "buy low and sell high" cycles should indeed be able to deliver some very advantageous results over long holding periods, while keeping the focus on the preservation of inflation-adjusted capital.
This was an intriguing analysis to prepare. I hope you have found it to be helpful and of interest.
Learn more about the free book.
********************************************
My newest set of DVDs is "Gold Out Of The Box, 2020s Edition". Video Chapter One is about the common perspective of gold acting as a stable store of value, and Chapter Two is an uncommon examination of hidden gold taxes. Uncommon approaches for outperforming inflation by enough to come out ahead of those taxes? Those would be among the subjects of video Chapters Three though Twelve of the 2020s edition, as well as the red DVD from the 2010s edition in the right corner. More about the DVDs can be found in the brochure, linked here.
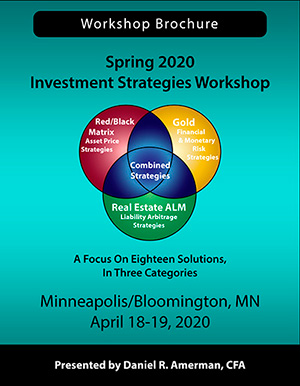
Uncommon explorations of how gold can outperform inflation are also the subject of six of the topics and one of the categories of the "Eighteen Solutions In Three Categories" that will be a crucial component of the April two day workshop in Minneapolis (brochure link here).