

Funding Of U.S. Deficits By Monetary Creation Reaches 90% In Late 2019
By Daniel R. Amerman, CFA
Tweet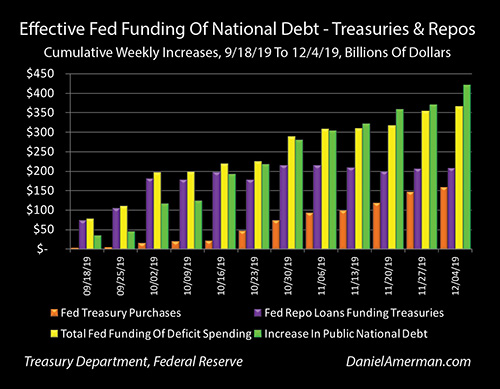
As can be seen in the graph above, for the last 12 weeks there has been a stunning visual correlation between the yellow bars of the total weekly funding of deficits by the Federal Reserve, and the green bars of the weekly deficit spending by the United States government.
Total deficit spending, the extent to which monies spent by the federal government exceeded taxes collected, was a staggering $422 billion in just the last 12 weeks. In total, $367 billion of the funding for this increase in the national debt was provided at very low interest rates, via the mechanism of the Federal Reserve simply creating the money needed to fund the government spending.
Neither the Treasury Department nor the Federal Reserve will admit to what is happening. The Fed is using two separate programs to accomplish this, with a sufficient degree of complexity that it becomes difficult for average citizen to follow where the money is coming in from and what it is being used for.
In this step by step analysis, we will put together the week by week numbers from the Fed and the Treasury, uncover what is being hidden behind a veil of complexity, and show the simple truth - about 90% of recent federal government deficit spending has effectively been funded at below market rates by simply creating the new money.
This analysis is part of a series of related analyses, which support a book that is in the process of being written. Some key chapters from the book and an overview of the series are linked here.
Deficit Spending Has To Be Funded By Somebody
As 2019 ends, we are in a time of potentially rapid change for markets, interest rates, investment prices and the funding for the national debt. As reviewed in recent analyses, we have moved back into a time of $1+ trillion annual deficits, and this is currently projected by the government to extend into the indefinite future.

The Congressional Budget Office is projecting over $12 trillion in deficits over the next ten years, and for the average person that is such an astoundingly large number that it may sound quite theoretical. What needs to be understood about deficits, is that they are not the slightest bit theoretical.
The government spends massive sums of money. What it doesn't take in from taxes it has to borrow. Every one of those 12+ trillion dollars shown above has to exist - it will be spent. At the time it is spent, it will be every bit as real as the dollars in your checking account or money market account. And those real dollars for new spending have to come in from somebody. (Funding new deficits each week and each year is a very concrete process that is much more dangerous than looking just at the $23 trillion total of the national debt, even if most people are not aware of this.)
This money has to be there, and it has to be available at abnormally low interest rates, or as reviewed in previous chapters, market stability is imperiled along with the values of the nation's retirement accounts and homes.
Beginning in October of 2019, the Federal Reserve made an abrupt turn, and for emergency reasons began using monetary creation to get the money to buy $60 billion per month in U.S. Treasury obligations, as explored in much more detail in Chapter 18 (link here).
The Federal Reserve does not directly purchase those Treasury obligations from the U.S. Treasury Department itself, nor does it issue press releases talking about how it is creating new money to finance deficit spending and the growth of the U.S. national debt.
But effectively - that is exactly what it is doing. The Fed is creating new money, and using it to buy massive amounts of government obligations at very low interest rates, so that the U.S. government does not need to raise the money from private parties (like it is supposed to), who might require higher interest rates. Now that this astonishing program has been running for going on two months, it is worth taking a look at what has been happening in practice.

As can be seen in the graph above, the orange columns represent the net increase in Treasury obligations owned by the Federal Reserve in each week, and the green columns represent the increase in the public portion of the U.S. national debt in that same week.
As is visually obvious - there is a very strong relationship between the Treasury getting new money each week to finance government spending that is over and above what taxes pay for, and the Federal Reserve creating new money each week to finance a big chunk of that extra spending.
The first week when this process really got going was that ending on October 23rd. The Fed purchased $26 billion in new Treasuries (through the markets), and the Treasury sold $26 billion in new debt. Since neither the Federal Reserve or the Treasury Department openly admits what is happening here - that is quite the amazing coincidence, isn't it?
Of course, $60 billion a month in Treasuries purchased with created money is not enough to fund a $1+ trillion per year deficit, so over the following weeks we see a partial funding. By the week ending on November 13th, the Federal Reserve had purchased about $78 billion in new Treasuries, and the Treasury Department had issued about $129 billion in new debt.
When we look at the cumulative total through December 4th of 2019, the Federal Reserve created $137 billion in new money and (effectively if not openly) used that to finance deficit spending. This compares to the Treasury spending $229 billion more than it took in. So, the Fed didn't finance everything (through this first program) - but the Treasury did on an effective basis, only have to find $92 billion in outside money to fund government spending, instead of the $229 billion it would have otherwise had to raise, while potentially paying higher interest rates to get that money.

If we look at the effective funding on a cumulative percentage basis then we get the blue bars in the graph above.
The Federal Reserve effectively funded 100% of government deficit spending the week ending October 23rd. Through November 13th, the Fed funded 61% of the growth in the national debt, and through December 4th, 60% of the seven weeks of government deficits had been funded by the seven weeks of monetary creation.
So while the numbers have been bouncing up and down a little bit on a week by week basis, it is a fair statement to say that the Federal Reserve is effectively funding about 60% of the government spending that is in excess of taxes collected.
***************************************************

Read Chapter One Of "The Homeowner Wealth Formula"
Read Chapter One Of "The Eight Levels Of Homeowner Wealth Multiplication"
***************************************************
The Role Of Repos In Funding The National Debt
The other major source of Federal Reserve funding for the government is via "repo" lending, and this source is much less understood - but every bit as important as the purchase program. The "repo" or repurchase agreement market is not something that most individuals are familiar with - but it underpins the U.S. financial system, and is an extremely important source of cash for many banks and institutional borrowers. It is also an important source of funding for the national debt.
A repurchase agreement is essentially a secured loan, that is legally a sale. Collateral - generally U.S. Treasury obligations - is sold to a buyer (who is effectively a lender, and is the Federal Reserve in this case). There is a simultaneous agreement at the time of the sale to repurchase the collateral at an agreed upon price and time, which is usually the next day. The difference in price between the sale price and the contractual repurchase price is effectively the repo rate of interest.
The Fed does not usually lend via the repurchase agreement market, and had not done so on a significant scale since the 2008 financial crisis. However, there was a crisis in the repo market in the week of September 16th, 2019, which led to major Federal Reserve interventions, which have continued through December. Crucially and as covered in much more detail in Chapter 18, the Federal Reserve itself says that the source of the repo crisis was when the U.S. government tried to pull too much money out of the system in one week, both via corporate taxes and new deficit borrowing. Below is a direct quote from Fed chair Powell on September 18th, as the crisis was developing:
"...pressure emerged as funds flowed from the private sector to the Treasury to meet corporate tax payments and settle purchases of Treasury securities. To counter these pressures, we conducted overnight repurchase operations yesterday and again today."
How did the Fed deal with a market crisis caused by the government trying to pull too much cash out at one time for taxes and deficits? By creating the money to fund the cash shortfall on an emergency basis. That is a very direct connection that continued and grew from there forward, even if it has not gotten anywhere near the attention it deserves.
Now, it is accurate to say there that are multiple sources of the turmoil in the repo market, with some of them being closely tied to year end banking reserve requirements or hedge fund activity - but it is equally accurate to say that the Fed creating money to fund repo loans accomplishes multiple goals.
The first level of understanding is that when the Fed lends via the repurchase agreement market - it is quite literally buying and paying for the U.S. Treasury collateral. So, when the Fed funds $200 billion in repurchase agreements, it owns another $200 billion in U.S. Treasury obligations. The borrower enters into a legal agreement to repurchase, usually the next day, but in the meantime the Federal Reserve owns the Treasuries. Because these repos are usually rolled over every day, that means that the Fed owns the Treasuries each day.
The next level is to look at repos in the way that they are generally treated for accounting and regulatory purposes, which is as a lending market. To access this market, the starting point is for the repo borrower to have the U.S. Treasury obligations to serve as collateral. This ownership is effectively paid for on a daily basis as the loan rolls over, by the repo lender. So, when the Fed creates $200 billion in new money to extend $200 billion in new loans, that are collateralized by $200 billion in Treasury obligations - the Fed is effectively funding those Treasury obligations via the new money.
Now, let's look at on both levels. Legally, the Federal Reserve owns the U.S. Treasury obligations, it created the money to buy them, and the repurchase agreement is the obligation by the seller to buy them back. In practice, repos are loans that are funded by the Fed, using created money, and the Fed is fully funding the Treasury obligations. Either way - the Fed funds the deficits with created money, it is doing this on an emergency basis specifically because of the rate of government spending, but it is doing so behind a veil of complexity, in a market that most people have never heard of and that can only be understood with the use of a specialized vocabulary - so the public has no idea what is happening.
In total, the repurchase agreement market provides a substantial portion of the domestic private funding for the growth in the national debt, and this is not an accident. The U.S. government has created a regulatory framework where the repo market is cheaper and easier to access when U.S. Treasuries are used as the collateral, and this then provides an ongoing source of low cost funding for the national debt and the annual deficits.
There is another crucial layer as well, which is that the repo market effectively competes with other markets for the dollars of investors seeking very short term, very high quality places to invest money. Two of the biggest alternatives are the U.S. Treasury obligations and fed funds markets.
So, if repo rates move up on a sustained basis – then money is pulled out of the Treasury and fed funds markets, until those rates move up as well (all else being equal).
While little understood by the general public, the massive repurchase agreement market and the ability to use U.S. Treasuries as collateral to reliably obtain very low cost loans is not just crucial for financial stability, but is also an important component of the funding of the national debt, while being an important influence on the borrowing rate paid by the U.S. government.
The Combined Fed Funding Of U.S. Deficits Via Monetary Creation
The graph above also shows the orange bars from the prior graph, of cumulative new purchases of Treasury obligations by the Federal Reserve. What is added is the purple bars of new repo loans - the new money created by the Fed that is used to fund the day to day ownership of Treasury obligations by repo borrowers at very low interest rates. The starting point of this graph is the September repo crisis, so the repo related funding of deficit spending starts much earlier, while the significant week to week Treasury purchases don't really get going until the week of October 23rd.
When we combine those two bars we get the yellow bars, which are the total Federal Reserve funding of U.S. government deficit spending on a cumulative basis. This funding was initially high relative to the weekly funding of the deficit, as the Fed used the new money to deal with a crisis that was threatening - via funding the ownership of an increased share of the national debt, and creating the money to do so.
As the crisis grew less urgent, the rapid increases in the purple bars of Fed repo loans stopped and more or less stabilized, while the orange bars of the Fed's new policy of creating the money to fund a large component of deficit spending on a weekly basis began to steadily rise.
It is only when we look at the yellow bars, the combination of new repo loans using monetary creation to fund Treasury obligations, and the Fed using monetary creation to buy U.S. Treasury obligations, that we can see the full extent of how much of government deficit spending is currently being funded by monetary creation.
The Federal Reserve funding of the national debt increased for 12 straight weeks. Particularly when we focus on the eight weeks between mid October and early December - the visual relationship is stunning. When we compare the yellow bars of Fed monetary creation being used to either purchase Treasuries or loan the money to own Treasuries, it almost exactly equals the green bars of the weekly deficits and the weekly growth in the national debt.

On a cumulative basis, deficit spending increased the national debt by $422 billion over 12 weeks, and the Federal Reserve effectively funded $367 billion of that deficit spending via monetary creation, meaning that 87% of the deficits were funded by monetary creation. When we look at the Fed's weekly new monetary creation to fund the weekly issuance of new Treasury obligations in percentage terms, we get the graph above.
After an initial surge in the height of the attempts to contain the repo crisis, cumulative monetary creation has been effectively funding cumulative deficit spending in a more or less stable range for the last eight weeks, bouncing up and down around roughly 90% in the last four weeks in particular.
This is a somewhat fantastic development, and over the thousands of years of economic history, variations on this theme of just creating the money to spend, have been attempted many times in many nations, by governments and elites who have seen personal financial or political gains by doing so. It has never worked out over the long term. Not once. It is sobering to see the United States not just going down this path, but accelerating the journey, even if this is not yet being admitted to the public.
Now this does not mean that the relationship shown above will be stable in exactly that range, indeed that would be quite unlikely. Depending on what is happening there is likely to be quite a bit of variability, and this is particularly true of weekly deficits, due to the timing of government income tax and estimated tax payment receipts.

However, as developed in Chapter 18 and shown in the graph above - there is a good chance that by the time all is said and done, what we are experiencing at the end of 2019 is just a taste of what will be coming in the 2020s. What the graph shows with the green bars is government deficits as projected by the Congressional Budget Office, and what is shown with the orange bars is simply the indefinite continuation of the Federal Reserve's current program of purchasing $60 billion a month of Treasury obligations, using monetary creation.
The visual resemblance between this look at the next ten years - and the graph of what has actually been happening with recent deficits and recent Treasury purchases by the Fed - is remarkable.
The Deeply Personal & Potentially Near Term Implications
The problem with great, big, huge numbers, like creating $100 billion in new money out of thin air in a week, or a nation planning to spend $12 trillion more in a decade than it has money coming in - is that by their nature, they will seem quite abstract to most people. What could these vast and theoretical numbers have to do with what really matters to most individuals, such as what their retirement accounts may be worth next year, how much money they will have to spend in retirement, or what the value of their home will be?
The problem and the very personal and direct linkage is that the values of our homes and retirement accounts are all already based upon what the Federal Reserve has been doing with both very low interest rates and with monetary creation.
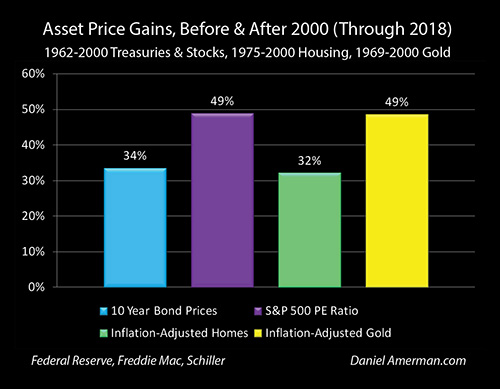
As shown above, and as explored in Chapter One (link here), the reason that stock, bond and home values are currently at near historic highs are because of those very low interest rates.

The fundamental problem that emerged in the fall of 2019, and is likely to become more important in 2020 and in each year beyond, is that the National Debt Supercycle has merged with the Fed's very low interest rate cycles, and created a potentially existential conflict not just for the nation - but for the value of everyone's individual homes and retirement accounts.
The U.S. government fully intends to spend a staggering amount more than it has coming in from taxes each and every year, into the indefinite future. That is the plan, that is what is in the long term official budgets and projections. The money doesn't exist on the private side to do this, or at least not at the historically low interest rates that the Federal government, the Federal Reserve, the financial markets, and that individual investors and homeowners are all dependent upon.
Now that this merger has occurred, the Federal Reserve has begun emergency maneuvers to make sure that the Federal government can get the vast sums of cash it is currently taking out of the financial system - sucking $422 billion in new cash out of the system in just the last 12 weeks - without triggering the increase in interest rates that could bring the system crashing down. For lack of alternatives, that has in practice meant just creating the money, even if the Federal Reserve and Treasury Department are very careful to never actually admit that.

The individual stakes are shown in the illustration above from the analysis linked here. Using the round number illustration of a $1 million net worth, a 75/25 allocation of $800,000 in retirement savings between stocks and bonds is assumed, as well as ownership of a $500,000 home with a $300,000 mortgage.

If interest rates were to merely return to average, and stock, bond and home valuations were to return to long term (inflation-adjusted) averages, then as shown above, the loss in net worth for the average person could be staggering - and it could be immediate. Yes, there are very much long term dangers from the national debt when it comes to inflation and the like - but the immediate and near term dangers could instead involve staggering stock and housing losses.
However, that said, also keep in mind that as explored in Chapter One, the results of the Federal Reserve's heavy-handed interventions to date have been some of the highest stock, bond, and home prices in history. And if the Fed were to get even more desperate, dialing up its degrees of interest rate interventions and monetary creation to deal with ever greater challenges - the results could be more of the same. There could be potentially much higher stock, bond and home prices (at least for a time, and perhaps for a number of years).
Exploding federal deficits and monetary creation are not at all the sort of issues that most people think about when it comes to retirement planning, the value of their retirement accounts, or the value of their homes. Yet, the issues discussed in this analysis are already the primary reason that most people are enjoying the stock, bond and home prices that they are - and this importance is likely to grow even stronger in each successive year, as the 2020s unfold.
As the Fed continues its emergency maneuvers, these values are all in play, and what factors could cause them to plummet downwards - or to climb still higher - are not part of the usual financial education. Hopefully this analysis and this book have been helpful to you in understanding these critical new relationships, as we begin a new decade that will be quite different from any before it.
Learn more about the free book.
***************************************************
Read Chapter One Of "The Homeowner Wealth Formula"
Read Chapter One Of "The Eight Levels Of Homeowner Wealth Multiplication"