

Gasoline Price Pairs And Inflation
By Daniel R. Amerman, CFA
TweetAre there times when we can see part of the future by looking at the past?
As it turns out, so long as our expectations are reasonable, then in some cases we can get a good (but not perfect) idea of what future inflation trends might look like, by keeping a close eye on the past.
More specifically, inflation is usually measured by comparing prices from twelve months apart. We never know what the new number will be. But, we do know exactly what the old number will be, we know this well in advance, and this means we do indeed know half of the upcoming calculation before it ever happens. As developed in this analysis, this can provide a great deal of information when it comes to the recently reported 3% overall rate of inflation, and how stable that is likely to be.
This analysis is part of a series of related analyses, which support a book that is in the process of being written. Some key chapters from the book and an overview of the series are linked here.
Persistent Core Inflation
Based upon the Consumer Price Index (CPI-U) the rolling 12 month rate of inflation fell from 4% in May to 3% in June of 2023. As this is the lowest rate of inflation seen since March of 2021, some are presenting this as being a major victory, with the worst of the biggest bout of inflation that we have seen in four decades now being behind us.
Three percent sounds like a remarkably low number. Does this mean the inflationary crisis is almost over? Is the worst behind us?
To better understand, we need to be precise in our vocabulary. Inflation means that prices are still rising. Disinflation means that prices are still rising, but the rate at which they are rising is slowing down. Deflation means that prices are actually falling.
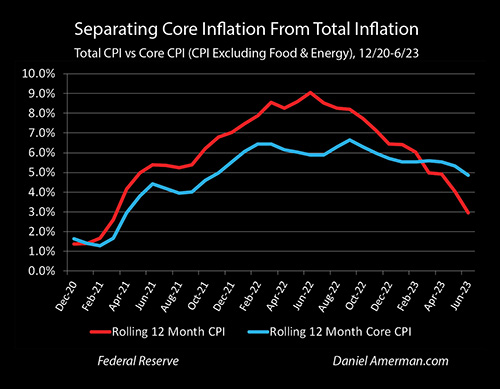 The red line in the graph above represents the overall rate of inflation, and we are clearly seeing disinflation. The rolling 12 month Consumer Price Index (CPI-U) peaked at 9.1% in June of 2022 and has been falling ever since then. The inflation is still ongoing, average prices are still higher in every month than they were 12 months before, let alone 24 months before, but the rate of increase has been falling.
This reduction in the rate of inflation is not, however, uniform. When we look at the core CPI - inflation exclusive of food and energy - then as shown with the blue line above, we get a very different picture. We are seeing disinflation, but it is a much lesser degree of disinflation. The peak in the core CPI was 6.6%, and the most recent core CPI inflation was 4.8%.
The reason that the overall CPI was so much lower than the core CPI is that we have been seeing deflation - actual falling prices - in fossil fuels-based energy products such as gasoline and natural gas. It is these falling prices that have been pulling down the red line of the overall rate of inflation in the graph above.
Seeing The Price Pairs
In the media, the fall in the overall inflation rate to 5% in March of 2023, then 4.9% in April, then 4.0% in May, and then 3.0% in June, is being presented as some sort of unexpected miracle, that indicates that inflation is indeed being beaten. This surprising (?) series of events is presented as proof that the Fed's actions have been working. That series of disinflationary numbers does look both impressive and unpredictable - who could have known?
There is another level to the puzzle. While it is not the only component, sharp movements in energy prices have been a dominant influence on changes in the overall CPI. The Consumer Price Index is commonly calculated on a rolling twelve month basis, with the most recent release comparing prices in June of 2022 and June of 2023. So, a lot of the changes in the overall CPI come down to just looking at two numbers: current gasoline prices, and gasoline prices 12 months ago.
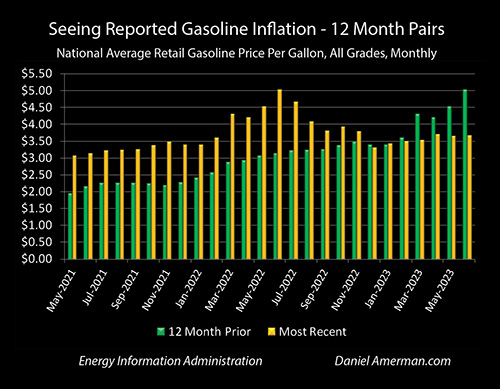
These 12 month "pairs" can be seen in the graph above. Starting with the May 2021 bars, the yellow bar of national average gasoline prices (all grades) at that time was $3.08, the green bar of the gas prices of 12 months before (May of 2020) was $1.96 (thanks to the pandemic shutdowns), and that represented a 56% annual increase in gas prices. That should have sent the overall rate of inflation soaring - and the May 2021 CPI increase of 5.0% was the highest seen in almost 13 years. It wasn't all gasoline price changes - but the 56% increase in prices was crucial.
Note that each monthly average gasoline price appears twice, once as the yellow current bar, then again 12 months later as the green bar of former prices.
Looking at the price pairs, yellow current to green 12 months before, then so long as the yellow was quite a bit higher than the green, then reported inflation should be quite a bit higher, as we move from June 2021 to February 2022. As can be seen with the red line of overall inflation in the "Separating Core Inflation From Total Inflation" graph, that is exactly what was happening, with inflation climbing to the highest levels seen in 40 years, reaching 6.2% by October of 2021, and 7.5% by January of 2022.
It wasn't all gasoline, as the blue line of core inflation was climbing fast at the same time, but the big increases in gas prices were driving an even faster increase in the red line of overall inflation.
Then the invasion of the Ukraine occurred, and we see five big yellow spikes in a row, with gasoline jumping above $4 a gallon in March of 2022, and peaking at $5.02 a gallon in June of 2022, which was a 59% increase compared to the $3.16 average price in June of 2021. That same month - and this was no coincidence - we saw the peak in the overall rolling 12 month CPI rate of inflation of 9.1%.
Then something very interesting happened - the yellow bars of current gas prices started falling, while the other half of the price pair, the green bars of gas prices from 12 months before continued rising. Comparing yellow to green, the 12 month increase in prices fell to 26% by August and 9% by November. This was disinflation - and it produced disinflation for the overall CPI as inflation fell to 8.3% by August, and 7.1% by November. The green and yellow bars were almost the same from December of 2022 to February of 2023 - and inflation stayed in about the 6% to 6.5% range.
Then something remarkable happened in March of 2023. The green bar of gasoline prices from 12 months before (what was the yellow bar at that time), jumped up to $4.32 a gallon. Now, in 2023, there was very little happening with gas prices, the average per gallon price actually increased slightly from $3.50 in February to $3.54 in March. Nonetheless, because the inflation is based on a 12 month pairing, and there had been a big price spike 12 months before due to the Ukrainian war, this created a major deflation in gas prices, with a decline of 18%, year on year.
That first appearing major deflation in gas prices then pulled down the overall CPI inflation to 5.0% - and for the first time since the current inflationary bout began, the overall rate of inflation fell below the 5.6% core rate of inflation. Again, this is no coincidence, the overall rate contained a major deflation in gasoline prices, while the core did not.
In June of 2023, we hit the peak deflation that had been set up when gasoline prices peaked at $5.03 in June of 2022. Our current gas prices were actually up a bit at $3.68 per gallon, but the maximum 12 month deflation of 27% was experienced, and this was so powerful that it pulled the overall CPI inflation all the way down to 3.0%.
Twelve month changes in gas prices aren't everything, not by any means. But they are an exceptionally important piece of the puzzle. The huge ramp up in 12 month gas pairs was associated with big increases in overall inflation, the peak in gas price changes corresponded exactly with the peak in inflation, the following disinflation in gas prices produced a disinflation in overall price changes, the first appearance of major deflation in gas prices produced the first decline in the overall index below the core index, and the peak 12 month gas deflation of 27% produced the 3.0% overall rate of inflation.
There are a fantastic number of words being written about the Fed's actions, defeating inflation, and the extraordinary implications for investments, the interest on the national debt, and on all of our lives. Yet, there is a case to be made that some of the best information can be found by comparing 12 month gasoline pairs. This brings up an interesting point.
Looking Behind, Thinking Ahead
Let's think about time and our 12 month gasoline price pairs. The yellow bar of current prices is always a surprise. Occasionally it is a shock when events are moving fast, such as the price spike with the invasion of Ukraine. However, if we think in terms of ranges then it isn't usually that big of a surprise. Looking at the last three years, the average (mean) monthly change in gas prices is 2%, and about 85% of the time the monthly change in gas prices is less than 10%. Now, attempting to precisely predict oil or gas prices would be very difficult indeed, but if instead of trading futures we just accept being in a general range as good enough (not trying to call up or down), then most of the time we have a decent idea of where the yellow bar is likely to be in the near future.
We don't know the future. But, we do know the past with precise certainty. And that means that we know exactly what the first half of the gasoline price pairs will be for the next 12 months.
Looking back, we knew that somewhere between roughly late 2022 to early 2023 gas prices were in range that was about equal to where gas prices were the year before, as can be seen by the roughly equal heights of the yellow and green bars. The primary force that had been driving the CPI upwards had been neutralized - and this was reflected in moderate disinflation, as inflation backed away from its peaks but nonetheless kept going, as the wage/price spiral had become embedded in core inflation.
Even by that time, looking back over the known quantities of the past, we knew that there were these five towering yellow spikes of high gas prices from March through July of 2022, as a result of the Ukraine war - well above what came before, and what had settled down afterwards. They produced a big inflation spike as the price increases unexpectedly rolled in. They could also be expected to produce a big deflation in the energy component of the CPI, so long as gas prices remained in the general range. More precisely, they could be expected to create a major disinflationary spike in the overall CPI between March and July of 2023, with the peak of the disinflation occurring in June of 2023. Gas prices did stay in the general range, and that is exactly what has happened (so far).
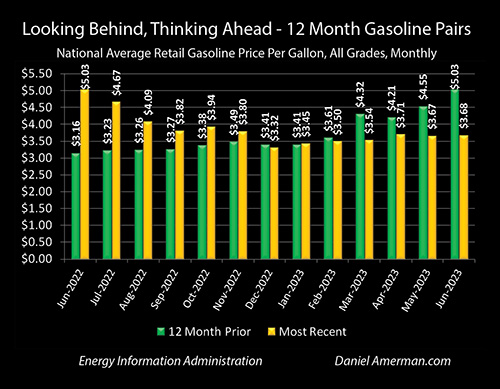
Let's return to the present, and take that same approach. Looking behind, and then thinking ahead, we know that the first half of the gasoline price pair will be $4.67 for the July CPI, $4.09 for the August CPI, and that it will be $3.82 for the September CPI. Compared to current prices (and the future will be at least somewhat different) that means that the power of the gasoline-driven deflation would drop from 27% in June, to 21% for the July CPI, 10% for the August CPI, and 3% for the September CPI (each of which will be reported in the following months of August, September and October).
Hmm... time to get out our "crystal ball"?
All else being equal, we can then anticipate that the August CPI print (of July inflation) should reflect a slight uptick in inflation as the degree of deflation in gasoline prices is reduced due to the $4.67 average price in July of 2022. The September and October media headlines - and their accompanying effects on the bond and stock markets - would then reflect a stubborn and steadily rising rate of inflation, that seems mysteriously impervious to Fed interest rate increases, as the gasoline deflation shrinks each month until it disappears. Until gas makes its next big moves then, the overall index is likely to stay closer to the core index.
Then - all else being equal - there will be that shocker that will be reported in the Wall Street Journal and Bloomberg six months from now, in January of 2024, when the December of 2022 gasoline price plunge down to $3.32 a gallon becomes the first half of the price pair for the December of 2023 inflation data - whipping up the reported rate of inflation to the complete surprise of the markets.
Now, all else is of course not equal. Gasoline price pairs are a very important factor, but they are only one factor. The biggest risk is as always financial and geopolitical surprises. This could lead to major changes in gas prices, that then change the impact on the overall CPI. We also have to look at the dominant core rate of inflation and how it is changing. Food price changes have about twice the importance in determining the overall CPI than energy prices do, so they do have the potential to change the CPI on their own at any time in a way that is independent of gas prices.
Evaluating Four Possible Uses
Let's consider four different ways of using this information on gasoline price pairs. The first use would be as a means for reliably forecasting inflation rates, as a true crystal ball of sorts. That would be a remarkably bad idea, as gas and other energy prices are a relatively small part of the CPI. About 78% of the overall Consumer Price Index is the core CPI. Energy is important - but it only assumes exaggerated importance when it is making big moves. As an example, it was the big moves of a 59% (12 month) rate of inflation in June of 2022 and the corresponding 27% rate of deflation that followed 12 months later in June of 2023 - that allowed it to temporarily dominate the overall reported rate of inflation in each of those months.
Once we set aside the unrealistic use of precisely calling future overall or core inflation, then there are three more uses - each of which can be quite valuable, so long as our expectations are reasonable.
The second use is that in the specific circumstances that gasoline prices have made major moves in the preceding 12 months - up or down - and that they have then settled into a different price range, then we do indeed have an edge of sorts when it comes to anticipating changes in the reported overall rate of inflation. Because the stock, bond, real estate and precious metals markets can all react to the changes in the monthly reported rate of inflation - this is good information to have. It isn't infallible, but it can be an edge, particularly relative to not knowing that information.
All else being equal, the overall rate of inflation should increase with the CPI reports released in August, September and October, as the gasoline deflation shrinks and disappears. That isn't guaranteed, but for September or October reports in particular, it would take a very large drop in energy prices, food prices, and/or the core CPI for the overall rate of inflation to stay close to 3%. No guarantees, but the odds are good we will see a surprise uptick in inflation in December of 2023, which will be reported in January of 2024. This is good information to know.
The third use is that gasoline 12 month price pairs can help us better understand what is actually happening with inflation, as well as how effective Federal Reserve policies have been. The screaming headlines are that inflation is falling fast, the work is almost done, and we are almost back to normal. We are told that the policies of the Fed have been highly effective, as shown by inflation coming down to a mere 3%.
Doing some basic modeling, taking the core CPI as an input, and using the gasoline price pairs in an attempt to predict/explain the overall CPI, my average error was only 0.1% for the period between May 2021 and June of 2023 (some of the individual monthly errors were much larger). This is interesting, but since the core CPI is 78% of the CPI, and I was using that as an input, it wasn't such a much from a predictive perspective.
The reason for the test was the explanatory component. Once we adjust for gasoline price pairs, virtually all the changes in inflation were on average explained by changes in the core CPI. Fed policies did not bring the overall rate of inflation down to 4% and then 3%. Rather, Fed policies strongly aided by energy deflation (energy deflation dampens both sides of the wage/price spiral), brought core inflation down to 5.3% and 4.8%, with the rest of the work almost entirely being done by the energy price pairs.
This brings us to the fourth and in some ways most important use for the gasoline price pairs, and that is the evaluation of Fed policies, as well as what they may do in the future. If the Federal Reserve had actually brought inflation down to 3%, then that would be a huge victory, and we could be looking forward to a perhaps imminent end to the interest rate increases.
However, if the real rate of inflation (or at least what the government calls the real rate) remains more in the 5% range, then the Fed still has a long ways to go before it can declare victory.
Contrary to what much of the market currently believes, and as explored in Part 1 of "An Evidence-Based Look At Inflation, Recessions And Pivots" (link here), history shows that once inflation is allowed to become well established, then neither disinflation nor recessions will reliably be sufficient to break the wage/price spiral. People taking victory laps on defeating inflation, even while the United Pilots union is negotiating a potential 40% salary increase over the coming years, is an interesting juxtaposition.
To actually break well-established inflation has historically taken much higher interest rates than we have seen to date - and there can't be a Pivot - as is explored in Part 2 of "An Evidence-Based Look At Inflation, Recessions And Pivots" (link here).
So, when it comes to our fourth use, if we ignore gasoline price pairs then 3% inflation means that the Fed tightening may be nearing an end, and if we include gasoline price pairs then the Fed tightening may still be with us for a long time to come. That is quite the significant difference, and hopefully, this analysis has been helpful to you in seeing that difference.
********************************************
It's time to pick the weekend for the Fall workshop! I'm currently considering October 21-22, October 28-29 and November 4-5, at a location in the Indianapolis suburbs. If you are considering attending and have preferences, please let me know. The decision will be based on participant feedback and venue availability.