

Economic Growth & Real Inflation Rates
By Daniel R. Amerman, CFA
TweetThere are facts, and there are opinions.
It is my opinion that the Federal government uses methodologies to calculate the official rate of inflation that understate the real rate of inflation on a systematic basis, and that they have been doing so for years.
It is a fact that the core economic data for the nation is generally calculated on an inflation-adjusted basis. This means that if the real rate of inflation is higher than what is officially stated, then real (inflation-adjusted) economic growth, labor productivity and median incomes are all lower than what is officially presented. If that is true, then that means that virtually everything we believe about the economy on an aggregate basis is at least a little wrong, and possibly very wrong indeed. If so, then virtually all financial markets, as well as almost all conventional financial and investment planning are based on false data.
It is the opinion of many people that the government grossly understates the rate of inflation, and that it has been 10% or more for many years - call it a good 8% or more above the officially stated rate. As I first began sharing in workshops in 2008, it is my opinion that these beliefs are grossly mistaken, because of the necessary implications for economic growth and personal income over time.
On the surface, differing opinions about personal impressions of price changes are almost impossible to resolve, because of the subjective nature of our beliefs. However, if we are talking about a national average rate of inflation, then we can indeed mathematically test these beliefs, and see if they produce believable results for economic growth, productivity and personal income. We can apply a form of "truth test" to beliefs about high rates of inflation - and we can also test the official rate of inflation itself.
This analysis is part of a series of related analyses, which support a book that is in the process of being written. Some key chapters from the book and an overview of the series are linked here.
Compound Interest & Inflation
The mathematical formulas for compound interest and compound inflation are essentially identical. If you have not done so, I would highly recommend reading Chapters Two and Three of "The Homeowner Wealth Formula" (free Chapter One link here), which explain and present this essential relationship in detail.
For the portion of the population that truly understands compound interest, it can become a life-changing revelation. When interest rates are not being suppressed (as the Federal Reserve has been doing since 2008 and before), then compound interest becomes the most reliable source of wealth creation in financial history.
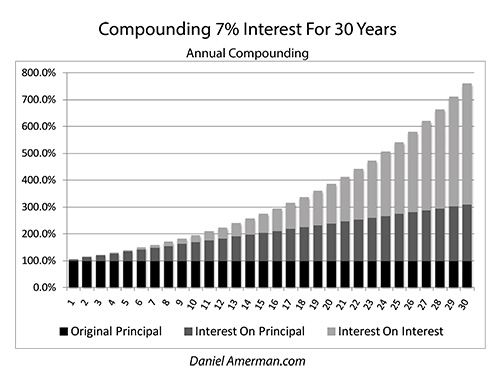
The graph above shows the growth in interest income with a 7% interest rate. The starting investment is the dark bars on the bottom. The cumulative simple interest - annual earnings on the starting investment - is the medium-shaded bars in the middle. The compound interest - interest earnings on previous interest earnings - is the light bars on top. The total investment almost doubles by year 10, triples by year 17, and quadruples by year 21. The exponential component - the interest on interest - exceeds the starting investment by year 18, the cumulative simple interest by year 20, and exceeds the combination of both starting investment and simple interest by year 26. Such is the extraordinary wealth-creation power of compound interest.
As explored much more thoroughly in the book, compound interest has an equally powerful dark twin, which is the power of compound inflation. Indeed, the same exponential equation is used to calculate compound interest and compound inflation, (1 + i) ^ n, the only difference is that "i" stands for interest rate when calculating compound interest, and for the rate of inflation when calculating compound inflation.

When we look at a graph of compound 7% inflation it is therefore mathematically identical to the graph for compound 7% interest, we're just changing the labels. "Original Principal" becomes "Starting Prices", and "Interest" is replaced with "Inflation". It now takes almost twice as many dollars to support a given standard of living in 10 years, three times as many dollars in 17 years, and four times as many dollars in 21 years. Critically, at high rates of inflation over time, the compound inflation on inflation becomes more important than the simple inflation.
Compound inflation is quite deliberately used by governments against their own citizens, with numerous benefits for the government in such areas as confiscatory taxation, and reducing the value of the national debt, which are not well understood by voters and most investors. Indeed, the Fed, US government and Wall Street investors all take advantage of the general public's lack of inflation sophistication to massively redistribute the wealth of Main Street to themselves on an ongoing basis, in plain sight, but with little understanding from voters and individual investors.
Once someone does have an actual understanding of compound inflation, then alternative avenues open up for taking advantage of that inflation. Showing how to do this is the point of both "The Homeowner Wealth Formula" and "The Eight Levels Of Homeowner Wealth Multiplication" (free Chapter One link here).
The Necessary Consequences Of Sustained, Much Higher Inflation Rates
Understanding the mandatory math of compound inflation is very useful when it comes to evaluating opinions about what the long term rate of inflation has been. It's really just a matter of understanding a fairly simple form of exponential mathematics. Now, I realize that many people would strongly prefer not to think in those terms, but when both the creation of wealth and the destruction of wealth are governed by this type of math, then a choice not to think is a choice to not know.
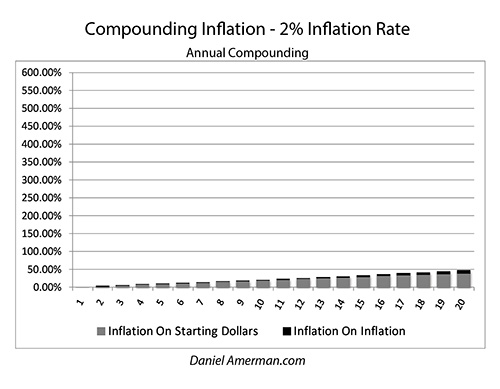
Low interest rates - and low inflation rates - compound very slowly. A 2% rate of inflation will steadily destroy the value of money, but it will lack the basic fuel for rapid compounding. The graph above shows inflation only, not including the starting prices, and the dark bar of compound inflation on inflation is quite small over the entire twenty years.
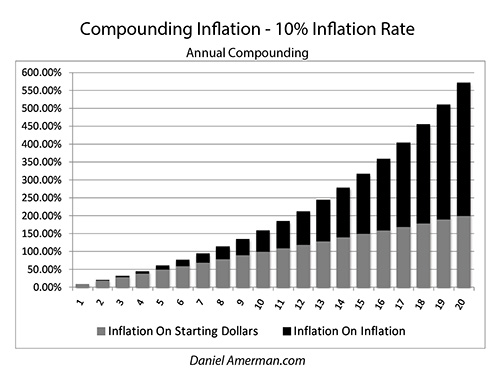
Now, if we had a ten percent rate of inflation for the same twenty years, we get very different results. Yes, the lighter bars of inflation on starting dollars are quite a bit higher each year. However - as is always the case with exponential mathematics - when we drastically increase the compounding rate, we drastically increase the inflation on inflation component. The dark bars now leap upwards, and over time, it is this inflation on inflation that comes to completely dominate future price levels. There is an extraordinary difference in the dark bars of inflation on inflation, when comparing 2% and 10% rates of inflation.
A 2% rate of inflation will increase prices by a little less than 50% over twenty years. A 10% rate of inflation will increase prices by over 570% over twenty years. While a 10% rate of inflation is 5 times higher than a 2% rate of inflation, it will produce an almost 12 times higher increase in prices over twenty years because, well, exponential mathematics.
The Economic Implications
As previously mentioned, the key economic statistics for the United States are generally adjusted for inflation. Increases in the economy, personal income and so forth are adjusted downwards for the decreasing purchasing power of the dollar. Now, if the real rate of inflation has in fact been materially higher than the official rate of inflation, that means that the downward adjustments need to be much greater.
The math with the GDP and related measures is very close to the more common CPI-U, but it is just a little different with its reliance on a GDP Deflator as well as quarterly data/compounding. If we take from the beginning of 2008 through the first quarter of 2023, then we get about a 2.21% rate (this is slightly lower than the CPI), and it ends up taking about $1.39 in early 2023 to buy what a dollar would have in 2007. This is quite similar to our example with 2% inflation, which only very slowly builds over time, with inflation on inflation being very minor.
Now, let's say, as many have, that the real rate of inflation was actually 8% greater during this time, which would be 10.21%. This puts us in the neighborhood of inflation running 10% or higher during that time period, which is in line with some beliefs. Instead of it taking an additional 39 cents to buy things, it takes an extra $3.29, as it now takes $4.29 to pay for what used to cost a dollar. Even over 15 years, at a compounding rate above 10%, the inflation on inflation component becomes overwhelming.
Let's consider the implications for the economy, productivity and real incomes.
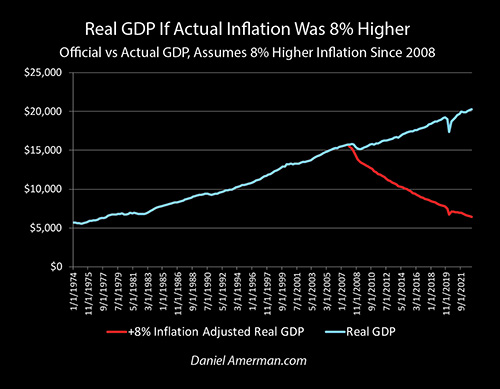
Using 2012 inflation-adjusted dollars, according to the US government the size of the economy was $15.7 trillion in early 2008, and that had increased to about $20.3 trillion by 2023. As can be seen with the blue line, aside from a couple of dips with the Great Recession and pandemic shutdowns, there has been reasonably steady growth the entire time, with the real economy expanding by about 30% over 15 years. That is the official story.
However, if inflation had actually been 8% higher each year, then economic growth would have been much lower. Indeed, in very much simplified terms, if an economy is said to be growing 2% per year in inflation-adjusted terms, but the actual rate of inflation is 8% higher than the official rate, then that means the economy must be shrinking 6% per year, which would be associated with a severe recession.
That's just the simple annual part, in reality, we would have an exponential series running red hot, as inflation compounded on inflation. If we do run that series out, and adjust each quarter of real GDP for an 8% higher inflation rate, then we have an economy that has been in the worst depression in US history over the last 15 years. The current size of the real economy (in 2012) dollars would - as a mathematical necessity - be about $6.4 trillion, which is almost 70% lower than the claimed $20.3 trillion. The economy would be less than half the size that it was in 2008. (The year 2008 is being used for illustration purposes herein, as the place to begin adjusting for higher rates of inflation. Real world changes in inflation calculations are a much more gradual process - but the point remains.)
Given the assumptions, that is the mathematical fact side. As a matter of opinion - is that realistic?
The real economy is what supports real consumption and real standards of living, the money component just allocates who gets what. Economic growth for the nation has been based upon two components, one is population growth, particularly with immigration, and the other is the productivity of each worker, how much economic output each worker produces per hour of labor. This economic output is supposed to be real output, so it is measured in inflation-adjusted terms.
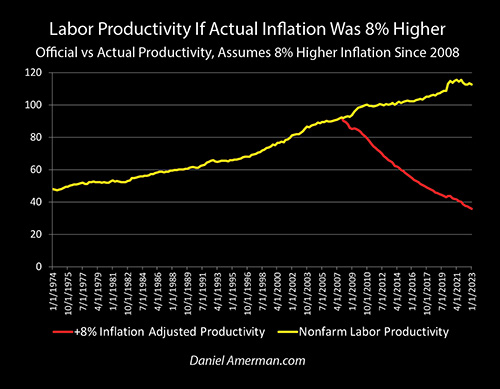
Officially, the real economy approximately quadrupled between 1974 and 2023. Part of that is more workers, and part of that is labor productivity, with the government saying that the average worker is about 2.35 times as productive in 2023 compared to what they were in 1974, as can be seen with the yellow line above. Financialization aside, that is what distinguishes a wealthy nation from a poor nation, the labor productivity of the wealthy nation is far higher. This increase in productivity - which has even officially been having recent problems - is generally attributed to the widespread usage of computers, as well as the increasing degree of automation. It is also quite dependent on a roughly 2% rate of inflation.
If we accept an 8% higher rate of inflation, something a little over 10%, and we let it compound over 15 years, then we will necessarily get an entirely different picture of labor productivity, as can be seen with the red line. Labor productivity must now be plunging with each year that goes by. Instead of increasing by about 2.35 times, labor productivity must have fallen down to a level that is only 32% of the current official productivity. Labor productivity would not only be lower than in 1974, but it would be down to only about 75% of what it was that year.
That is the mathematical fact side. As a matter of opinion - is that realistic?
GDP and labor productivity are both fundamental factors that are also somewhat theoretical for most people. On the other hand, income is something that is quite well understood, as it is personal for all of us.
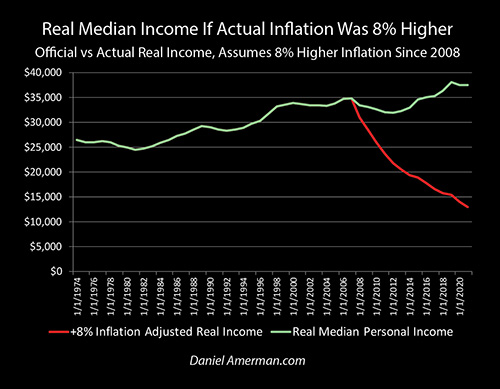
The "Real Median Income" measure above is from the Census Bureau (via the Federal Reserve). It looks at the entire US population age 16 and above, and finds the income in the middle with 50% earning more, and 50% earning less. The median income was about $37,500 in 2021 (in 2021 dollars). This compares to inflation-adjusted incomes of about $34,900 in 2007, and $26,500 in 1974. So, the person in the middle is making about 7% more than they were in 2007, and about 42% more than they were in 1974, once we account for inflation. (Median household incomes are quite a bit higher than the median personal income that is shown in the graph.)
Rephrased, the average person is - according to the government - enjoying a standard of living that is above anything before the 2010s, and is much higher than anything before 2000. That's kind of interesting when it comes to things like the Millennial and Zoomer generations being able to afford a home, buy a car, or to maintain a lifestyle without going deeply into credit card and other debts.
Now, if the real inflation rate has been 8% higher than what the government says, that necessarily means that the growth in real income has been 8% lower each year, and since the annual growth rates were never above 8%, that then means that real incomes have been dropping every year. And if we take into account inflation on inflation, when a 10%+ rate of inflation is compounding - that must mean that real incomes have been plunging every year.
The red line shows these mandatory annual adjustments if the real rates of inflation were 8% higher, and it does show plunging incomes. The real median income would have fallen below $30,000 by 2009, below $25,000 by 2011, below $20,000 by 2014, and would be down to about $13,000 by 2021. If the average rate of inflation were indeed 8% higher than officially stated, then real incomes in 2021 were down by 65% relative to official incomes, and down by 63% relative to 2007.
That is the mathematical fact side. As a matter of opinion - is that realistic? Has the average American lost almost 2/3 of their inflation-adjusted annual income since 2007?
Misleading Inflation Statistics
For truly long time readers, this is a case that I have been making since the 2008 workshops. Then as now, for people who are not professionals in finance or economics, there was a popular belief that the real rates of inflation were 10% or higher. This is fine as an opinion for any given year. But, as was true then and as is true now, if the rate of inflation is radically understated for a multiyear period, then the economy, productivity and personal income must all be plunging relative to the official numbers presented. Part of the 2008 presentation was saying that "If the real rate of inflation has indeed been over 10% since 2000, then the whole nation would have to look like Detroit."
There is the math, and then there are the opinions. In my opinion, it is ridiculous to say that the economy is 70% smaller than claimed, that productivity has dropped by 68%, and that the median real personal income has fallen by 63% since 2007. I cannot reconcile the world that I see around me with those beliefs, they fail my personal reasonableness test, and by quite a large margin.
That said - I've also been arguing since 2007 that the government is and will be generating inflation statistics that at least somewhat understate the real rate of inflation. The importance of inflation calculations in determining national elections has been very clear since at least the 1970s. High rates of inflation and frequent recessions lead to poor election results. Using somewhat lower rates of inflation not only looks better for elections, but it also produces higher official economic growth, meaning higher stock market valuations, as well as higher real incomes, and shorter and less frequent recessions.
Systematically pushing down inflation over time does not require a people in black cloaks kind of conspiracy, where a "real" inflation rate is known but a fake one is published. Reality is much more mundane. There is no single objective real rate of inflation, but rather there is an extremely complex group of calculations, that are dependent upon methodologies and assumptions that change over time. There is a bureaucracy that makes the determinations of the changes in the methodologies and assumptions, and that bureaucracy is very much politically controlled, it is vital for both politicians and the Administrative state. Looking at the thousands of decisions made in determining how inflation is calculated, those bureaucrats who make the "correct" decisions each year, are that much more likely to be promoted by the politically-appointed executives - and this will be very clear to those employees. Human nature + bureaucracy + motivated political agendas + a period of decades will likely systematically produce a methodology that will on a cumulative basis calculate a steadily lower official rate of inflation, relative to the price changes being measured.
Do you think inflation is accurately reported? Almost no one I talk to ever thinks this is the case. Instead, in looking at their personal spending, most people that I talk to believe that their personal inflation rates, the way their expenses increase, are at least a little bit higher than the official rate.
So, let's put this together. Do you personally believe that your expenses have gone up by more than 3% in the last year? Do you believe that government bureaucrats would systematically choose to make technical methodology decisions that are beneficial for the government, politicians and their own careers?
If you agree with both statements, then the real rate of inflation is at least somewhat higher than the official rate of inflation, and this has likely been true for some time. If this is the case, then inflation may be the least of our problems.
Inflation could be called the Father of Lies, and one of the reasons is because if it is a lie - then so is everything else.
As explored above with an 8% difference, what we believe about economic growth is necessarily based on accurate inflation measures. If the inflation measures are wrong, then everything we think we know about economic growth is likely a lie as well. The economy is not growing as fast as we think it is, and with even a modest increase in the rate of inflation, there is a case that it is perhaps slightly shrinking instead. This would also necessarily mean that there have been more recessions than what we have officially seen, and that each was longer and more severe than what we are told.
How could that be with near full employment?
An interesting point is that if inflation were just quite moderately higher than stated, then labor productivity would be slightly declining rather than slightly increasing. And if productivity is falling, then ever more labor is needed to keep an economy going that is either flat or slightly declining. One would expect more and more people working two jobs, just to stay afloat - as they have been.
How could you have rising real incomes if the economy was flat or slowly declining, and productivity was decreasing at a mild rate? Well, you couldn't - but only a very modest increase in real inflation is needed to have real incomes slowly falling instead of slowly increasing. Instead of each generation having greater real income than the generation before, Gen X would find it a little bit harder to achieve the lifestyles that the Boomers took for granted, Millennials would find it more difficult still to do things like buying houses and starting families, and Gen Z would find it even more difficult.
We're not talking about big shifts, like +8%, but something much smaller, with a lower compounding rate, but that nonetheless builds with time. Remember, if we believe the official stats, then the older Zoomers and younger Millennials should have the best real incomes of any generations in history, outearning the Boomers by a solid 40% in real inflation-adjusted purchasing power compared to what the Boomers were earning at similar ages. That extra 40%+ is a lot, buying houses and starting families these days should be easy peasy compared to the relative hardships of the Boomers. This is particularly the case when we take into account the greater percentages of women working, an average young couple today should be rolling in excess spending power when compared to their parents or grandparents.
If we believe the official stats - that has to be true. If it isn't at all true, then we likely have a problem with our official inflation rates. What best fits with reality - the official stats, or maybe the flat or slowly declining real incomes that would come with just somewhat higher inflation rates?
Inflation rates as shown herein can be used as a reality test of sorts. Eight percent higher inflation rates over a multiyear period fail the reality test, at least in my opinion. On the other hand, there are some aspects of the official rate of inflation, that also do not correspond to reality in my opinion, whether it be the cost of my groceries, or the incomes earned by younger generations today relative to their parents and grandparents.
However, there is a problem with going down that rabbit hole. With even modestly higher rates of inflation, everything financial and economic becomes fake to at least some degree. The economy is necessarily very different than what we've been told. With even a moderately different real inflation rate, our history of economic expansions and recessions can change greatly.
The stock market becomes based on fake data and fake economic information - and the difference is potentially radical. This may sound like tinfoil hat territory, but the mathematical linkage between reported inflation and economic growth adjusted for reported inflation is both basic and mandatory - there is nothing controversial or opinion-based about it. This won't matter, until it matters greatly.
The inflation-adjusted performance of precious metals and real estate just changed - as does the identification of opportunities versus risks for inflation-fighting strategies.
The political implications are earth-shattering, in numerous categories. The economics of immigration are transformed.
The financial viability of Social Security becomes far worse than what is projected, or what is expected by the average retiree. Economic growth and growth in labor productivity are ultimately what pays for Social Security and all retirement income. Without that growth there are only empty promises - and political promises don't bring wealth into existence.
The rapid growth in the national debt becomes far deadlier, as the consequences move nearer in time. Growing nations can handle growing debts, but for nations that are not growing, or are growing more slowly, the level of increases we've been seeing would be pure poison.
All of this is true with just a very minor change in the real rate of inflation, no big cartoonish differences are needed. All of this is also mandatory, if the rate of inflation is materially higher than what we are officially told.
******************************
Bring your headlamps, because we will be going deep down into the inflation rabbit hole at the October 28-29 workshop, that will be held in the Indianapolis suburbs.
For years we've been talking at the workshops about the real rate of inflation being somewhat above the official rate, and there has been a range that I've been referring to. The range is not a random guess, but is the result of a deep dive I did in 2016-2017, where I worked through how the federal government could remain financially viable when it comes to paying for a huge debt and inflation-indexed retirement benefits, including but not limited to Social Security (this was the "How The National Debt & Surging Benefits Will Transform Retirement Planning" educational video series).
What I worked out is that a full and honest indexing of retirement benefits would be financially infeasible for the government. The alternatives would be to A) raise taxes to much higher levels while paying the political costs; B) openly reduce retirement benefits while paying the political costs; or C) tweak the inflation calculations to pay slightly lower inflation-adjusted benefits each year, that will cumulatively build over time to become major, but in a way that is subtle enough year by year that the public doesn't catch on (there is also D, all of the above). Choice C becomes particularly necessary if the growth in the economy and productivity are less than the government says, because it is only highly optimistic assumptions in those areas that make paying the retirement benefits officially feasible at all.
At the workshop, we will be going through a wide range of inflation assumptions, starting with a subtle "What if the real rate of inflation has been 0.5% greater than the official rate?" In each case, we will look at the impact on 1) the economy, 2) productivity, 3) recessions, 4) real personal incomes - and we also then tie that into the investment implications when it comes to the impact on 5) real housing prices, 6) real gold prices and 7) real stock prices. Every time we just slightly move the real inflation rate, then as a mathematical necessity the history of where we've been since 2008 changes, as does where we are in the present, as does our best information for the future.
What we will find is not a single definitive answer, but that there is a range of quite moderate inflation adjustments that may intuitively make sense for what we are all experiencing, and that indeed, may make more sense than the official version. As it turns out - that range for recent years happens to be the same range that keeps the government financially viable while not getting too extreme, as worked out years ago.
Putting it all together:
1) We have current discrepancies - most of us feel we have been experiencing at least somewhat higher personal rates of inflation than the official numbers;
2) We have incentives - the government has enormous financial incentives to choose an inflation-calculation methodology that at least somewhat understates the real rate of inflation;
3) We have opportunity - a government bureaucracy is using a very complex and constantly evolving "black box" inflation calculation methodology, with strong institutional incentives to make choices that produce lower rates of official inflation, with that producing a "drift" that becomes stronger over time;
4) As we will review at the workshop, there is a traditional outside "truth test" for inflation statistics in the form of housing prices and the prices to build new homes (also covered in the books), that worked for decades but that has broken completely in the 2000s; and
5) We have generational mysteries - based on official statistics, the Zoomers and Millennials should be the wealthiest generations we've ever seen for their current stages of life, far better off than the Boomers or Gen X, yet, that seems to be upside down compared to what is being commonly experienced for many.
If we then draw the conclusion that the official rate of inflation is in fact even moderately lower than the real rate of inflation, then there is another mandatory step: accepting that the official economic statistics that depend on inflation adjustments are all fake to at least some degree. Neither economic growth nor the economy are what we are told they are - and that changes everything. The entire investment industry becomes dominated by GIGO - Garbage In, Garbage Out.
What is a better idea of reality? Could it be important for making better decisions, whether personal, business or investment?
There will be far more to the workshop than this discussion. But it will be a key part of Saturday afternoon. And it will also be an important part of Solutions Sunday, as we examine the implications for each of the strategies.