

Chapter 20: Sequence Of Returns Risks - How "Vicious Circles" Can Destroy Financial Security After Retirement
by Daniel R. Amerman, CFA
There is a hidden risk at the heart of many long term investment strategies, and it is called "sequence of returns risk". A core part of modern financial theory has been that if one owns common stocks for long enough, the risk essentially drops out while the rewards remain.
In practice, there is a gaping hole in that theory, and that is what happens if in real life someone owns a volatile asset and it hits a secular down cycle - or up cycle - when they have already retired or are on the verge of a planned retirement. Someone selling off assets to finance standard of living in retirement - which is more or less the point - is not generally taken into account in the long term studies. When we do include asset sales into rising or falling prices - then everything changes, and major real world risks are introduced that are missed in the long term studies.
One possibility is the retiree sells into sharply falling prices and a "vicious circle" is set off, with fast building negative impacts that can quickly become effectively permanent. So even when the assets fully recover over time, and long term studies can look back a decade or two later and say "no problem" - for that individual, the losses were entirely real, the implications could have been life changing, and they in practice never did recover.
While less studied, sequence of returns risks can also have a very powerful upside. This positive side, when a retiree is selling into fast rising prices, can set off a "virtuous circle". If this happens early in retirement, it can provide a retiree with growing financial security as their retirement progresses, and their savings can potentially last for decades longer than what they anticipated at the time they retired.
When we examine historical stock price changes and start with identical retirement assets and an identical standard of living in retirement, sequence of returns risks and the particulars of when in the secular cycles a retiree begins asset sales can mean the difference between being broke by age 78 as the result of a vicious circle, versus having a multimillion dollar portfolio at age 104, as the result of a virtuous circle that is still growing each year.
While gold sequence of returns risks are generally ignored, in this analysis we will show that these risks are even more important for gold investors than they are with stocks. When we start with identical retirement assets and an identical standard of living in retirement, the historical record shows that gold sequence of returns risks and the particulars of when in the secular cycles a retiree begins asset sales can mean the difference between being broke by age 75 as the result of a vicious circle, versus having a safe and secure retirement that can comfortably support a retiree through age 111, with a virtuous circle creating full protection against inflation for all those decades.
This analysis is the 20th chapter in a free book. The earlier chapters are of essential importance for achieving full understanding, and an overview of some key chapters is linked here.
In this chapter we will explore the danger side of the 1st, 2nd and 3rd types of sequence of returns risks and the history of how "vicious circles" can rapidly destroy financial security after retirement. We will then look at the surprisingly positive flip side, and explore the history of how sequence of returns risks can multiply wealth with "virtuous circles" in Chapter 21, creating more security and potentially decades more funding than a retiree may have expected at the time they retired. The 4th and 5th types of sequence of returns risks will then be explored in Chapter 22.
Sequence Of Returns Risk #1: Permanent Losses
Setting investment cash flow aside for now (in these days of very low interest rates and low dividend payments), if someone is retired, the idea is to sell assets if needed to cover standard of living, and if the assets are sold at 50 cents on the dollar because the market crashed - it doesn't matter if the asset later doubles in price over the next 10-20 years.
Those assets are gone, they are not there to recover in price, and the 50% example loss was permanently locked in when the money was spent. Because the losses are locked in, a retiree who is liquidating investments to pay for their standard of living during a major downturn never does fully recover on a personal basis - even if the index numbers eventually do show a full recovery for the nation as a whole.
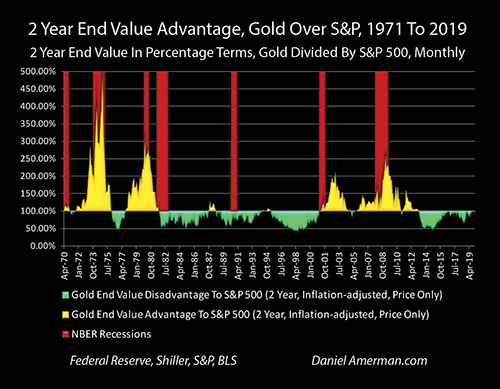
As developed in Chapter Nineteen (link here), there is a very powerful contracyclical relationship between stocks and gold, with the two asset classes moving in opposing secular cycles. What history shows us is year after year of one asset rising in inflation-adjusted terms - even while the other asset is falling, year after year.
An example of the problems created by the secular cycles is that of someone retiring at the beginning of secular down cycle, and having to liquidate assets at an inflation-adjusted average price of 50 cents on the dollar for ten years. Then the market fully recovers for the next cycle, and they sell at their expected inflation-adjusted price for the next ten years. Half of their portfolio sold at 50 cents on the dollar, half sold at 100 cents on the dollar, and their standard of living is based on selling at 75 cents on the dollar - even though the asset did fully recover.
A closely related and more difficult dilemma is the number of assets that have to be sold. For instance, the number of shares of stocks, or the number of ounces of gold. If the planned standard of living is to be maintained, but the assets sell at fifty cents on the dollar (inflation-adjusted) - then twice as many assets have to be sold.
That is twice as many assets that are gone for good - and the 50% example loss is locked in for each one of them. That is twice as many assets that will never recover in price even if the general market does recover over the next 10-20 years.
It also means that the savings run out in half the time, all else being equal. So, if someone thought as a result of decades of savings discipline and good investment decisions, that they could lead their desired retirement lifestyle for 20-25 years, but because of sequence of returns risks, they are selling much of their assets at half the price they planned - they could run out in 10-12 years instead. Beyond that point, it might be just what lifestyle and financial security can be supported by Social Security alone, for what could easily be another 10 or 20+ years.
Now, hopefully there will be a recovery before all the savings are spent down. But if that does happen, because of the faster sales of shares (or ounces) earlier, then there is still not a full recovery, because the accelerated sales of assets at lower prices are permanent.
A Lack Of Cash Flow
The ideal solution is to not sell assets, but to live on cash flow. This used to be much easier to do. When ten year Treasury yields averaged over 7% between 1962 and 2000, while inflation was about half of that, there was a substantial positive cash flow, even in inflation-adjusted terms.
More currently however, as developed in Chapter 17 (link here), a very large national debt requires very low interest rates if solvency is to be maintained. Separately, and as developed in other previous chapters, Fed policies for containing crisis also rely on very low or zero percent interest rates, for the attempted containment of crisis. There were already major problems on both sides, but with arrival of the coronavirus and the associated economic shutdowns in 2020, it looks like very low or zero percent interest rates could be with us for decades (assuming the Fed can maintain control, which is far from certain).
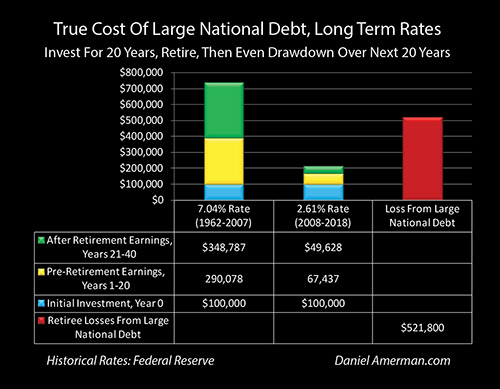
When we look at the green bars, which are interest earnings after retirement, then we can see how they move from historically being the single most important source of cash flow for retirement standard of living and financial security, to being a small fraction of what they previously were. As stated in Chapter 17:
"What this shows is a critically important component of financial planning and achieving financial security in retirement - the investment decisions made after retirement can actually be more important than the decisions before retirement (particularly when the retirement is longer than the example 20 years). Unfortunately, this is also where a very large national debt can have the most negative impact on financial security in retirement."
The cost of a soaring national debt is very real, and whether most people realize it today or not, it will be a dominant influence on retirement standards of living and financial security over the coming decades, even without default or hyperinflation. One way that a high national debt transforms retirement finances is to slash the prior primary source of spending and security, investment cash flow, and replace it with asset sales, which then compounds the dangers of all five of the sequence of returns risks described in this and the following two chapters, taking them to historically unprecedented levels.
Historical Illustration Of Stocks Sequence Of Returns Risk
The first risk shown above is very real, but it isn't complete.
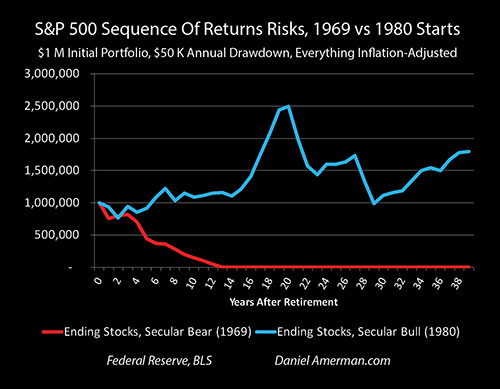
A real world example of this is the secular down cycle that occurred with stocks in 1969. In inflation-adjusted terms, using the S&P 500 stock index and the Consumer Price Index, the value of stocks fell by 46% (price only) between 1969 and 1980. If we take a long term averages perspective, stocks would do much more than just recover in the two decades that followed. The investor would have been "whole" or back to where they started in inflation-adjusted terms by 1991, and at twice that level by 1996. This could be seen as proof that the investor needed to be patient and hold on, and everything would work out for them with rich rewards by the end.
Unless... they were retired, and the purpose of their investment portfolio was to be sold over time to provide a certain standard of living in retirement.
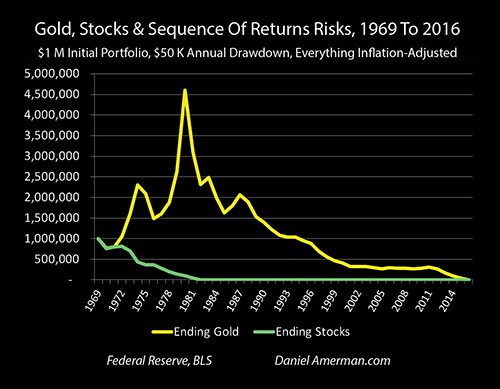
The above example starts with a round number $1 million portfolio at the end of 1969, that could be in gold or stocks, and assumes that an inflation-adjusted 5% of the initial portfolio, or $50,000, is taken out in each year. How long does the portfolio last in retirement? (The specific numbers don't matter as much as the percentages. It could be a $100,000 portfolio and taking out $5,000 a year, or a $400,000 portfolio and taking out $20,000 per year.)
If an investor had been in stocks at just the wrong point in the sequence, in 1969, then the answer is that their initial million would have been down to less than half a million in five years, and their savings would have run out in completely in 13 years, by 1982.
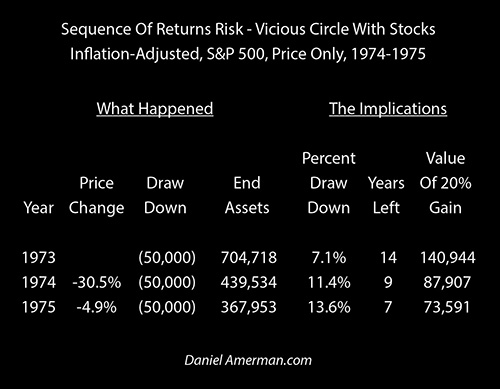
The years 1974 & 1975 are a good example of how sequence of returns risks can work to make a planned 20 year retirement fall apart in just two quick years. At the end of 1973, the stock investor would have had $704,718 in inflation-adjusted assets.
When we look in the implications columns in the chart above, the next year's $50,000 drawdown would equal 7.1% of the assets they had left. Alternatively, if we take the remaining $704,718, and divide by the inflation-adjusted annual $50,000 drawdowns, they would last for 14 years of retirement. A third implication is that if there were to be a strongly positive year the next year, with a 20% gain, the portfolio would increase by $140,944 (before being drawn down for that year's expenses).
Sequence Of Returns Risk #2: Accelerated Portfolio Drawdowns
Instead of a gain, 1974 would bring a steep 30.5% inflation-adjusted loss (rounded). If we take our starting $704,718, that would be a loss of $215,184. If we were looking at a long term investment model for someone before they retired - that would be it. But when we look at the reality of financing standard of living in retirement, we have to add in another $50,000 of asset sales. Taking out both market losses and drawdowns would reduce the portfolio size down to $439,534.
Another way of looking at this is that the base, the size of the portfolio just fell by $265,184 in a single year, which is 38% of the entire portfolio. Any further drawdowns are from this drastically shrunken portfolio. Any future gains - are from this much smaller base.
If there had been no change in the inflation-adjusted price for stocks, then the portfolio would have fallen by 7.1% by the end of the year, just from asset sales. Because there was both a steep market decline - AND a $50,000 drawdown - the size of the portfolio fell by 38%, which is more than 5X the expected amount. On the surface, this by itself was enough to take five years off the number of years of retirement that the portfolio would support, reducing it from 14 years to 9 years.
However, the bigger ongoing problem is the percentage of the portfolio that is consumed by drawdowns each year. The drawdowns funded by asset sales are the major difference between investing before retirement, and investing after retirement - and they are relentless. The bigger the drawdowns get relative to the remaining portfolio, the faster the portfolio depletes, and the more difficult it becomes to slow down the depletion.
If we look at the implications columns, the annual amount of the portfolio that is consumed by retirement standard of living just jumped from 7.1% to 11.4% in a single year. That 4.3% acceleration in a single year is almost equal to the entire 5% drawdown that was expected in the first year of retirement. Another way of looking at this is that if we take the $439,534 remaining portfolio, and divide it by the $50,000 per year drawdowns, that is another path to confirming that that the fully funded remaining retirement just fell to nine years.
So, as a result of the sharp one year market loss, the retiree is much deeper in the hole the next year, trying to overcome a materially higher drawdown as a percent of their portfolio.
Sequence Of Returns Risk #3: Shrinking Gains From Rebounding Prices
Compounding the dilemma for the retiree is that if there were to be a 20% gain the next year - it would only increase the portfolio by $87,907, which is $53,037 less than what a 20% gain would have led to the year before.
Because of the way sequences of returns work, it is already more difficult to overcome losses than many people realize. To overcome a 50% loss, which halves the base, a 100% gain is needed. Looking at 1974 with stocks, to overcome a 30% loss in 1974, would have required a 43% gain in 1975. However, to overcome the combination of the 30% loss AND the $50,000 drawdown on that shrunken portfolio would have required a 61% one year gain.
To put this challenge in a historical perspective, if we look over the last fifty years - the S&P 500 has never gained even half of that needed 61% that in a single year, when comparing inflation-adjusted annual averages. Indeed there are six instances - so more than 10% of the time - where the inflation-adjusted annual average price of the S&P 500 fell by 17% or more in a single year. But, there is not even one instance over the last fifty years of the S&P 500 gaining the 32% (inflation-adjusted) in a year that would be needed to offset the combination of any of those six 17% or greater market losses AND a 7% or greater portfolio drawdown.
This is a vicious circle and once the math gets going - it is pitiless. A year or two of major losses early in the sequence of returns slashes the size of the portfolio. The smaller the base, the greater the percentage of the portfolio that is consumed by annual drawdowns. The faster the base goes down, the less the ability to recover with gains in any future year. The next year, the base starts even lower, the drawdowns are even bigger relative to the remaining base, the potential dollar gains from a positive year become still smaller, and the spiral accelerates downwards.
These factors can be seen when we continue to the year 1975, which had a much smaller inflation-adjusted market loss of 4.9%. By itself, a year earlier, that would not have been such a big deal. But, because of the sequence of returns, it was hitting a dramatically shrunken base. The market loss shrunk the portfolio by $21,581. However, the $50,000 drawdown was much larger relative to the starting $439,534 portfolio,
So, in combination, the market loss and drawdown brought the portfolio down by another 16% in a single year, down to only $367,953. The implications of the vicious circle were that the drawdown by itself would be 13.6% of the starting portfolio in the next year, creating an even more difficult hurdle to overcome.
Yet, as another part of the vicious circle, the portfolio had even less power to overcome that hurdle, because the gains generated by a 20% gain were down to only $73,591. These were true even as the remaining years of fully funded retirement with no market changes fell to a mere 7 years, half of what they had been just two years before.
Another way of looking at the combined impact of a shrinking base increasing the percentage drawdowns while simultaneously shrinking the future gains is to look at how much an investor would have to make in 1976 to overcome the portfolio reduction in 1975 by itself. The 4.9% market losses would have required an offsetting 5.2% gain. But the combination of a 4.9% market loss AND the larger percentage drawdown in 1975, would have required a 19.4% gain to offset it in 1976 (and that is before taking into account the next $50,000 drawdown in 1976).
And yes, long term averages will show a full recovery within 21 years - but that doesn't do all that much for someone who ran out of money in 13 years, because by happenstance they began asset sales at a poor point in the sequence created by the secular cycles.
A core simplification is that we are looking at asset sales only, and not dividend cash flow. The reason is that the Fed's actions in the containment of crisis have slashed the availability of cash flows in retirement - which can be very forgiving when we look at the mathematics of sequence of returns risks - and replaced those cash flows with high asset prices - which can be quite unforgiving. The very forgiving high dividend cash flows of the 1970s and 1980s are long gone, and many of the most popular current stocks in terms of market capitalization, pay little or no dividends at all.
(The obvious alternative of reducing lifestyle to stretch savings is itself a sequence of returns risk, and is explored in Chapter 22.)
Historical Illustration Of Gold Sequence Of Returns Risk
Far from being a stable store of value, because it lacks any dividends or cash flow, gold is even more subject to sequences of returns risks than are stocks. This means that for someone who thinks they are being ultra safe by putting all their saving into gold - their retirement may not work out as planned.
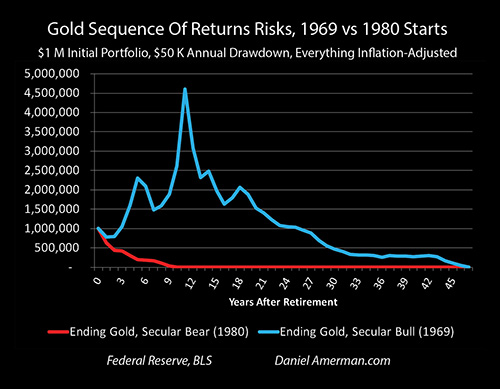
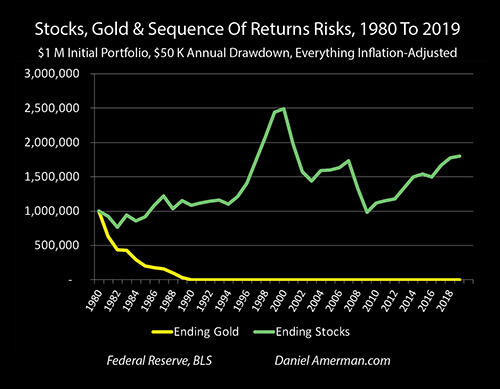
To explore what history shows, let's move our illustration of an unlucky investor retiring and beginning asset sales at just the wrong point in the sequence created by the secular cycles, to a gold investor with $1 million at the end of 1980, who will be drawing down an inflation-adjusted $50,000 in each year thereafter. (The starting position and sales are each based on annual average inflation-adjusted prices for that year.)

If we look at the implications of the starting position, the investor would expect to draw down 5% of the size of their starting $1 million portfolio each year (this would of course climb as a percent of the remaining portfolio in each subsequent year). This would translate to an expected 20 year fully funded retirement. A 20% gain on the starting portfolio would have created a $200,000 increase in assets, which would have funded another four years of retirement.
However, comparing inflation-adjusted annual averages, gold prices would fall by 31.9% in 1981. The market loss of $318,645 would combine with the drawdown of $50,000, which would result in a $368,645 portfolio reduction, decreasing the size of the base by 37% in a single year.
While gold is a quite different asset than stocks, this would set off the cruel mathematics of the same vicious circle. The annual amount of the portfolio that is consumed by retirement standard of living just jumped from 5% to 7.9% in a single year. The years that the portfolio would support being drawn by $50,000 per year fell to 13 years. If there were to be a 20% gain the next year - it would only increase the portfolio by $126,271 which is $73,729 less than what a 20% gain would have led to the year before.
As with the stocks illustration, the second year helped to seal the downward spiral, though with a larger loss this time. A 23.3% loss, combined with a drawdown at a substantially higher percentage of the base, together reduced the size of the base by another 31% in a single year. Combining the first and second year portfolio reductions, between market losses and drawdowns to support standard of living in retirement, the base was slashed by 57% in just two years.
The implications of cutting the base by more than half was to create a hurdle that was more than twice as high, as an investor would have to gain 11.6% just to offset the drawdowns. Yet, for a given 20% gain, the amount of money that would be produced was also off by 57% because of the reduction in the size of the base. The particular sequence of returns of selling into steep losses to fund retirement standard of living created a much, much harder problem to overcome than could be seen by merely looking at long term investment returns that don't include asset sales.
In practice, the sequence of returns risks in a secular down cycle were by that point impossible to overcome. Yes, gold prices rose by an inflation-adjusted 9.6% the year after - but that was only worth $41,681, it didn't even cover the $50,000 drawdown that year. Now, if that 9.6% had hit earlier in the sequence it would have generated almost $100,000 in gains, the portfolio would have been growing, but by hitting later in the sequence, all it did was briefly slow down the downward spiral.
Because this was a secular down cycle, the next two years brought losses of 18.6% and 15%, this accelerated the vicious circles, and in combination with the drawdowns brought the base down to $202,170. Even with the strong percentage gains for gold of 13.6% and 17.3% in 1986 and 1987, it was far too late in the sequence, the dollar gains were too small on the shrunken portfolio to cover the whopping (in percentage terms) drawdowns in either year, and it was still game over.
For the investor with $1 million in gold who thought they had achieved true financial security and who started asset sales in 1981, the happenstance of their entering the sequence in just the wrong year for the secular cycles, means that they would have entirely depleted their savings during the year 1990, in the tenth year of their retirement.
Changing Rules After Retirement
The underlying issue is that the process of growing wealth has been studied far more intensively - and is much more widely understood - than the process of spending down wealth. The two processes are not the same thing - the rules not only change but to some extent even reverse when an investor goes from buying, putting money in every year on a net basis, to selling and taking money out every year on a net basis.
If one does an internet search for "sequence of returns risk" there is information available from wide variety of sources, about what is often referred to as a little-known risk. Several aspects of the analysis herein are different from many of those treatments of sequence of returns risks.
The first is that all the numbers used in this Chapter 20 (as well as Chapter 19) are adjusted for inflation. When we adjust for inflation, secular down cycles become 1) more frequent; 2) more severe; and 3) longer term. This three way combination then greatly increases the dangers from sequence of returns risks. Indeed, some of the biggest losses that investors have experienced were covered over by inflation, with the destruction of the purchasing power of the dollar covering over the destruction of the purchasing power of investments. As an example, most investors don't even know about a fourteen year stock bear market with a 70% loss, because it can't be seen unless one adjusts for inflation, as explored in the analysis linked here.
If we are looking at retirement not in terms of dollars but what lifestyle can be purchased with dollars, then adjusting for the changing purchasing power of dollars is mandatory. This means that using inflation-adjusted dollars is the best methodology, and that then means that sequence of returns risks are a more frequent and substantially more severe problem than has been commonly recognized.
An additional difference is that most treatments of sequence of returns risks seem to primarily focus on the first sequence of returns risk, that of permanent losses when assets are sold at low prices. This then commonly leads to recommendations for large liquid reserves, so the at-risk assets don't have to be sold into a bear market, and the risk is then supposedly removed. For instance, some advisors say that avoiding sequence of returns risks is a good reason to keep 1 or 2 years of expenses in cash (say a money market fund) instead of in investments with price risk. That is an excellent idea. However, it is not a perfect idea, and while it can certainly help, there are some issues.
Indeed, based on the historical research that I've done - that isn't the main sequence of returns risk at all. The much more dangerous problem is what is identified herein as the second sequence of returns risk, which is the accelerated size of the drawdowns in percentage terms. The following are some issues with the protection that is provided by what is general the good idea of keeping a year or two of expenses in cash equivalents.
1) Stocks and gold each move in secular cycles - particularly when we adjust for inflation - and there may be the need for substantially more than 1 or 2 years of protection.
2) Two years of cash reserves does indeed reduce sequence of returns risks, but not necessarily to the extent that one might think. Let's return to the gold example, and say the investor started with $900,000 in gold and $100,000 in cash instead. Two years go by, all the cash is spent instead of selling gold, and because those were times of high inflation - the cash did not actually cover two years of inflation-adjusted expenses. However, setting that issue aside, the $900,000 in gold would still be worth about 52 cents on the dollar after two years, or $470,491.
With gold only, investor would have had $434,406, and by spending cash instead, the retiree is indeed $36,085 better off than if they had everything in gold. But, the $470,491 in remaining assets is still only enough to cover about 9 years of retirement, and a $50,000 drawdown would still represent a whopping 10.6% of the remaining base, while a 20% gain would still only produce about $94,000 in gains. So, even if 10% of a starting retirement portfolio is set aside in a money market fund for safety, the price risk of consecutive 31.9% and 23.3% losses on the other 90% didn't go away, and is still very much subject to sequence of returns risks.
The idea that not selling assets shields one from sequence of returns risks on the unsold assets is shown to be a fallacy if we look at percentage drawdowns versus the market value of the portfolio.
Another way of looking at this larger risk is that when someone is spending down assets in retirement then a clock of sorts is turned on - particularly with low or no cash flows. The more assets that are taken out each year, the less that remain, and the less time until the clock runs out and the investments are gone.
If there are major market losses, particularly in the early years during what is sometimes known as the "fragile decade", and a planned standard of living is maintained - then the clock gets sped up, sometimes enormously. Just two years of major down markets on the front end can cut the time remaining on a 20 year retirement clock in half.
3) That then brings into play a third aspect of sequence of returns risks. If that clock gets sped up too far while still early in retirement - it can be very, very difficult to put time back on it later in retirement. For a young, long term investor who is working and steadily buying more investments, then no problem - they still have 100% of what they owned before, plus what they bought on the cheap, so everything is there to eventually rise back up together. But for the retiree - it can be a totally different situation because what could be 50% or more of their assets could be gone on a market value basis, and there is very little to bounce back with. Take those much smaller gains, combine them with the big pieces of the portfolio that must for sold if the desired standard of living is to be maintained - and the basic math can create a near impossible to escape dilemma.
And yes, the alternative solution that most will use in practice in those extreme circumstances is to attempt to drastically reduce the standard of living in retirement. Yet, that is its own quite permanent and large loss and needs to be evaluated as such, as explored in more detail in Chapter 22.
The Linkage With Cycles Of Crisis & The Containment Of Crisis
Another difference from many treatments of sequence of returns risks is that while historical numbers were used for the explorations of how stock and gold sequence of returns risks have worked in the past - this is the 20th chapter of a book that is looking forward rather than backwards. The investment world has fundamentally changed as a result of two decades of extraordinary and unprecedented interventions.
If one wants to do historical studies of sequence of returns risks in the 1970s and 1980s that included the much higher stock dividend levels of the time, or the high interest earnings on long term bonds - or even the high interest earnings on "cash" in the form of money market funds - then much of the sequence of returns risks were in practice alleviated by the abundant cash flow from different investment categories, which greatly reduced the need for retirees to sell assets. That past is long gone, and it is not available to investors today.
Instead, the 2020s will bring a series of investment challenges - and opportunities - that have never existed before. A major purpose of this book is to help the reader understand why this is the case, and how the challenges and opportunities have shifted.
As explored in Chapters 1, 4, 8, and 18, as part of the cycles of the containment of crisis, the Federal Reserve has been using unprecedented monetary creation to force unprecedented low interest rates on the nation over the course of many years, with the intention to continue doing so for many years to come.
As developed in Chapters 10 and 11, using the bedrock equations that underlie financial and investment analysis, these very low interest rates policies have fundamentally changed the very nature of investment prices and returns. Yes, the expected mathematical result is to create highest prices ever seen for stocks, bonds and real estate. However, the cost of the artificially high prices was to cripple the single most reliable form of creating wealth for individuals over the long term, which is the reinvestment of dividend and interest cash flows, i.e. compound interest, and to replace it with something much less reliable, which is a dependence on never ending price gains.
As reviewed in Chapter 12, this also necessarily creates a potentially precipitous degree of permanent price risk if the Fed does lose control, which could lead to sequence of returns risks that go well beyond anything explored in this chapter.
As explored in Chapter 17, in combination with the growth in the national debt, this has essentially eviscerated the traditional ability of retirees to safely support themselves during the early (and vulnerable) years of retirement with substantial interest income from high credit quality investments such as medium and long term Treasury obligations. The availability of ample, high quality cash flow is the cure for sequence of returns risks during the "fragile decade" of just prior to and the early years of retirement, this cure existed for many decades, and as an incidental byproduct of extraordinary governmental interventions, the traditional cure is no longer available.
Therefore, whether they realize it or not, when record numbers of Boomers retire over the 2020s, the financial mathematics of sequence of returns risks means these retirees - and the generation following them - will be facing risks to their retirement savings like no generation before them.
Those risks have been further amplified and extended by the extraordinary degree of Federal Reserve monetary creation and market interventions, as well as the explosive growth in the national debt, that are the result of the attempts to contain the economic damage from the shutdowns that were used to try to slow the growth of the coronavirus pandemic.
As developed in Chapter 19, the contracyclical assets of stocks and gold are each subject to long term cycles of low and high prices (in inflation-adjusted terms). As explored in this chapter - particularly for someone who is about to retire or is in their first decade of retirement - the sequence of returns risks amplifies the dangers from a secular down cycle to a non-intuitive and even astonishing degree.
Even though they are not as well studied as the process of saving for retirement, and even though many average investors don't understand them at all - these sequence of returns risks have always been there. If by happenstance the secular down cycle hits at just the wrong time, the ability to devastate a planned 20 year retirement in two years has always been there.
So what we face is an amplified risk that has always been there, that has become much worse because of long term Federal Reserve policies forcing very low interest rates, that is now being amplified even further by the attempted containment of the economic damage from the shutdowns.
However, while cash reserves are of limited use because they can't shield what isn't in cash - a contracyclical asset can be used to protect an entire portfolio against sequence of returns risks.
If one asset is caught in a vicious circle - the contracyclical asset over the long term is likely to be experiencing the opposite, which is a virtuous circle. As we will explore in the next chapter, the flip side of sequence of returns risks is selling not into a secular down cycle, but into a secular up cycle. This can create virtuous circles, where prosperous and financially secure retirements can be extended by decades, and this happy development after retirement can also happen in a surprising short period of time.
Once this is understood, then the existence of a contracyclical asset opens up many doors for better ways of overcoming sequence of returns risks, including rebalancing strategies, ratio strategies, and ratio rebalancing strategies.
Learn more about the free book.
********************************************
Watch The 2020s Edition Online
Learn more about the contracyclical strategies for gold and stocks, brochure link here.