

The Historical Case For A 70% Real Stock Market Loss Over 14 Years
By Daniel R. Amerman, CFA
TweetThe Nasdaq stock index officially entered the bear market stage as of late April of 2022, with prices down 23% from its November 2021 high. These losses have continued into May, reaching 29.3% by May 20, 2022. The S&P 500 is now also potentially on the edge of a bear market, reaching -20% briefly on May 20th, before recovering later in the day.
The stock market losses are one of a cluster of economic and market problems, with the highest rates of inflation in four decades leading to the biggest one month increase in Fed Funds rates in two decades, even as a potential recession looms.
We have seen each of these events in the past. The end results in the past were 14 years of pain for the stock markets, and up to a 70% loss for stock market investors in real (inflation-adjusted) terms.
These types of events should never be unexpected - and a risk-averse investor should always include them in their long-term plans. This is a time not to panic - but to truly understand history, and to calmly and rationally prepare for an uncertain future.
To be clear - I did not predict this bear market, nor am I forecasting a particular percentage drop or time period. Absolutely not. I'm not a big fan of someone acting purely on predictions or forecasts. There is a lot of information value involved in studying them, but they are inherently unreliable. To risk one's financial security upon the purported accuracy of particular predictions or forecasts is, therefore - in my opinion - unnecessarily risky.
What I do believe in is genuinely understanding history - the good and the bad - and the long-term historical relationships between the investment classes in good times and bad times. To talk about real stock prices potentially not recovering until 2036 or thereafter, or losses almost tripling from here forward may seem as if it is some form of short-term panic or extreme pessimism. As will be developed in this analysis, the truth is just the opposite - this isn't about the last few months. Instead, we will be reviewing two long-term periods, that when combined account for a little more than half of the last 54 years.
It is when we thoroughly understand those long-term adverse periods, that we can find the calm and rational long-term solutions as well. This is no time to go into scramble mode in a desperate search for solutions - because that process also has inherent risks.
This analysis is part of a series of related analyses, which support a book that is in the process of being written. Some key chapters from the book and an overview of the series are linked here.
Falling Markets, Rising Inflation
The Tech heavy Nasdaq stock index closed at 16,057 on November 19, 2021, and at 11,354 on May 20, 2022. This fall in value of 29.3% in the space of six months fully meets the usual definition for a bear market of a fall of more than 20% in a period of months. While not quite as bad, the much broader S&P 500 stock index was also off by 18.7% from the high of 4,797 it set in early January.
There are multiple sources of distress that are causing this, with two of the biggest being inflation and anticipated increases in interest rates.
As explored in the previous analysis "A 15.4% Annualized Rate Of Inflation" linked here, we currently have two distinct sources of inflation, that are likely to combine in a multiplicative fashion. On the one hand, for the last year the United States and the world have faced supply chain difficulties that led to an insufficient supply of goods. At the same time, easy Federal Reserve monetary policy had kept the economy flush with cash. The basic economics of too many dollars chasing too few goods created over an 8% rate of inflation - before the war in the Ukraine.
Entirely separately, the War in the Ukraine and the related sanctions have created not just supply chain difficulties but also actual supply shortages when it comes to such areas as energy, food, and fertilizer. We are still just starting to feel the effects, and only have two months - March & April - where we have both sources of inflation. For March & April combined, the annualized rate of inflation is 9.8%.
The other big issue that we are looking at is the increase in interest rates. Rising interest rates, which are part of "tightening" cycles for the supply of money, have a very strong history of leading to recessions. For this reason, cycles of increasing and decreasing interest rates are not symmetrical.
The Federal Reserve often knocks interest rates down quite rapidly, as it attempts to avert or escape a recession. Raising rates tends to be a slower and more cautious process, as the Fed tries to avoid causing a recession.
To put the May 4, 2022, 0.50% increase by the Federal Reserve in perspective, it was the largest one day increase in interest rates in 22 years. The last time the Fed raised rates 0.50% in a day was May 16, 2000, when it raised the Fed Funds rate from 6.00% to 6.50%. The last 0.50% increase before that had been February 1, 1995.
Another way of phrasing this is that the Federal Reserve just made its single most risky interest rate increase in 22 years. Indeed, within a year after the last 0.50% interest rate increase, the economy was in a recession and the stock markets were plunging, entering a bear market that would last for many years. If we look on an inflation-adjusted basis (as we have to), then the S&P 500 would not again reach the level it was at in August of 2000 until December of 2014. If history were to repeat, this would suggest that stocks are likely to not recover in purchasing power terms until 2036.
High Risk, But Not Nearly Enough
The largest one day increase in Fed Funds rates in 22 years may seem like a huge deal - but compared to what is needed, it is hardly anything at all. There is a proven formula that central banks such as the Federal Reserve use to control inflation, and it involves pushing interest rates up until they are well above the rate of inflation.
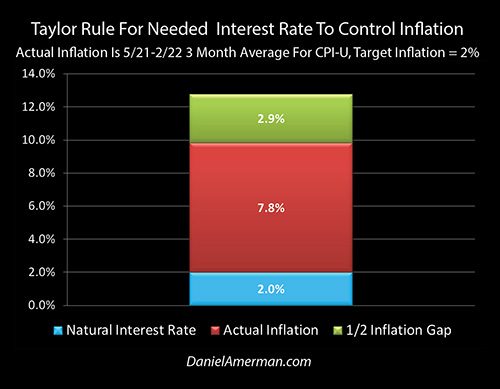 As developed in the in-depth analysis "Rising Inflation, The Taylor Rule, Rational Bubbles & The Fatal Flaw" (link here), to effectively fight even a 7.8% rate of inflation requires raising Fed Funds rates to 12.7% - if the Fed is to used its proven inflation-fighting tools. To fight a 15.4% rate of inflation - as we saw in the March CPI (annualized) - would require a 24.1% Fed Funds rate.
For those of you who were at the April workshop, this takes us back to one of the most critical parts of our discussion on Saturday afternoon: how the Fed's new generation monetary policies since 2008 have destroyed their ability to fight high rates of inflation. These policies have been funded by the Fed's new and aggressive use of the spending power in our bank accounts, as explored in "The Stealthy Raid On Our Bank Accounts" (link here). This leaves the Federal Reserve facing the highest rates of inflation in four decades, but without the effective tools to fight that inflation, other than hoping it will go away on its own.
What is causing the carnage in the markets is the anticipation of rates going up to around 2.50% to 2.75% - with the Fed then being expected to rapidly back off in order to avoid a recession and market crash.
The entire anticipated increase in rates is only about 10% to 20% of what history tells us is necessary to bring down and control the current rates of inflation.
So, rephrased - what is currently happening in the markets is nothing compared to what could be on the way. It is a pittance compared to the losses that would occur if inflation continued to rampage, and the decision was made to do what it takes to bring it under control.
A 70% Loss As A Base Scenario
Talking about a 29% loss in the Nasdaq as being a pittance may seem like an extreme statement. For much of the financial community, those who have started careers in the last 14 years, it may seem almost unimaginable, some kind of bizarre doomsday scenario. Having worked their entire careers in the artificial cocoon that the Federal Reserve created with the spending power of our bank accounts, talking about something like a 70% or more decline in stock values may sound incredibly unlikely.
Yet, there is a case to be made that a 70% decline in inflation-adjusted stock values should be the default assumption at this point, and any departures from that are a matter of unproven theory.
We have been here before.
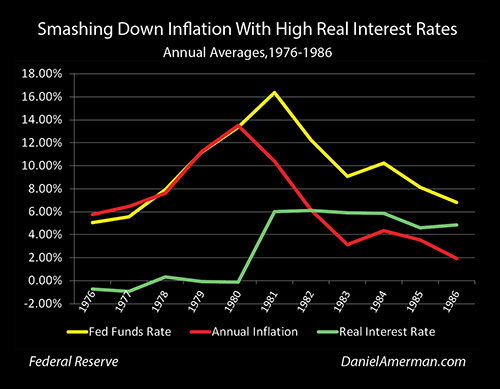
As explored in the previously linked analysis "Rising Inflation, The Taylor Rule, Rational Bubbles & The Fatal Flaw", there was high and persistent inflation through much of the 1970s, because then - as now - there was not the political willpower to bear the financial and economic pain that was needed to break the ongoing inflation. Instead, there was the hope that it would get better. But merely hoping wasn't good enough, inflation was still climbing through the second half of the 1970s - as can be seen in the red line above - long after the end of the Vietnam War, long after the oil embargo, long after the original sources of the inflation had gone away.
So, Paul Volcker used blunt force to finally break the high inflation, raising the average Fed Funds rate up to over 16% by 1981 (the yellow line above), creating recessions and market losses - while finally breaking the inflationary cycle. It worked. We know that this strategy works. That experience is a key part of what is now called the Taylor Rule, which calls for 12.7% Fed Funds rates to cure persistent 7.8% rates of inflation.

Our actual history during those years, as explored in the analysis linked here, was a 70% loss in the purchasing power of the Dow Jones Industrial Average. To this day, most people have no idea that this happened, because the great majority of the 70% loss in the inflation-adjusted value of stocks was covered over by the 65% destruction in the purchasing power of the dollar.
The one time that the United States has been in our current situation in the modern era, the results were 16%+ interest rates and a 70% loss in the inflation-adjusted value of the Dow Jones.
It is worth considering that this was a 14 year bear market - and that it also took the stock market 14 years to fully recover in inflation-adjusted terms after the last time interest rates were raised by half a percentage point in a single meeting. Now, the two are not the same, as the 1968 to 1982 losses (the last time we had inflation this high) took us to a bottom, while the 2000 to 2014 losses (the last time the Fed raised rates by 0.50%) constituted the time to a full recovery. Nonetheless, the common 14 years shows that both were very long-term processes.
There is, therefore, a case to be made that our base scenario, our base expectation, should be to expect something around a total 70% inflation-adjusted stock market loss, with it occurring in a very long term process, with perhaps 14 or more years until recovery. Or, at the least, this should be one of our base scenarios, a possibility that is worthy of serious consideration.
Long-time readers have been occasionally seeing variations of the graph above in analyses for the last ten years and more. It has never been a prediction for some particular date - but that it happened, and that it could happen again has always been true. If a long-term investment plan could not handle that eventuality, then the plan has always been inherently unreliable, this isn't just about the market carnage in the Spring of 2022. If someone could not liquidate their stock investments at significantly lower inflation-adjusted prices for the first 14 years of their retirement without materially damaging their standard of living - then their retirement security has never been what they thought it was, and this was true long before 2022.
Again, this isn't some kind of a crystal ball prediction, as in precisely 70% or precisely 14 years, because we have many unknown factors currently in play. Instead, the intent is to accept uncertainty but to also shift the base expectation.
The way people often approach expectations is to take the recent past and indefinitely project it into the future. This is particularly the case if something major is at stake - like someone's future financial security - and such a person can be very reluctant to abandon this approach. Instead, they will often seek the comfort of confirmation bias, relying on the readily available expert opinions that reinforce their pre-existing beliefs, reassuring them that they really have nothing to worry about, and their retirement will be fine. From this perspective, yes, we are in an entirely different place than we were several years ago, but overwhelming evidence must be offered to convince them that this is anything more than a short-term hiccup, or even a chance to buy the dip.
An alternative approach is to say that the situation we are currently in is nothing like what we have seen in recent years - but we have been here before, in some similar situations. Each time this happened, it was after some spectacularly good years for the stock markets and the economy. People felt great about the 1960s as well as the latter half of the 1990s, and most market commentators saw no reason why the good times couldn't continue into the indefinite future.
We currently have red-hot inflation like we haven't seen in forty years - and we do know what that led to the last time around. Separately, we've had a record high stock market that has run into the fastest increases in interest rates that we've seen in 22 years - and we do know what subsequently happened from 2000 to 2014. We know that as troubling as the market effects have been of the recent interest rate increases, they are but a small taste of the interest rates that were historically needed to bring persistent and high rates of inflation under control - and the extreme market damage that caused.
When these points were reached in the past - these very bad events happening in practice - the problems didn't just go away. Instead, the euphoric stock highs were replaced by a secular bear market, that would completely transform the market psychology over a number of years. What history shows us is that real world consequences were great for those who could not accept the basic pattern of financial history, the long-term cycles of secular bull markets being followed by secular bear markets.
Perhaps the most interesting part of all is the commonly presented perspective that to think in these terms - to simply accept the historical existence of the secular bears along with the secular bulls - is to be caught up in some sort of short-term and irrational panic. Adding the two 14 year periods discussed together, they account for a little more than half of the 54 years since 1968. This is most of the past, and understanding that is not irrational but the heart of rationality.
Of course, optimism is always a good thing as well. The future is not predetermined. There is a lot in play. We can hope for some strikingly better results - and I hope that is true for all of our sakes.
That said, when we take history into account, and given the current circumstances, we logically then need to expand our base expectations to include what happened before - not as a certainty but something reasonable to consider. This scenario could be the starting expectation, or it could be one of a small group of base expectations, that are considered to be reasonable possibilities.
If there were to be a 70% real stock market loss that lasted for 14 years even while 65% of the value of the dollar was destroyed - what would that do to retirement plans and financial security? If the results would not be acceptable, what changes need to be made such that someone can come through one of the most reasonable expectations for the future - what happened in the past in similar circumstances - with financial plans intact, and hopefully better off than ever?
********************************************
A plunging market is not a time for panic - but at the same time, frantically reacting to a plunging market is not the best way to find superior solutions. As long-time readers know, I have been writing about secular bear markets for around 15 years, and have been providing extensively researched financial education materials on inflation solutions for that same time. Long-term challenges need long-term solutions, deliberately and thoroughly developed over time.
When we look at what counts - inflation-adjusted purchasing power - then we have a history of secular bear markets in stocks. During those same long-term cycles, gold performed extraordinarily well. However, we also have a history of long-term bear markets in gold - that correspond to extraordinary long-term bull markets in stocks.
As explored in the analysis linked here, and as is very relevant for today, history over the last 50 years shows that stocks and gold have acted as contracyclical assets in secular cycles. Once this information is understood, then one way of using it is to attempt market timing strategies which take risks that - if successful - can be highly profitable.
There is another, even more powerful use of this information, and that is to blend the two assets together to create risk-reduced strategies for fighting inflation.
These risk-reduction strategies for overcoming inflation include annual rebalancing strategies, secular rebalancing strategies, ratio strategies, and ratio rebalancing strategies. These long-term strategies can be rules-based and market-neutral. They can also be weighted, so that stocks are the dominant choice while protection is provided via a smaller contracyclical position in gold, or gold can be the primary choice, with protection being provided with a smaller contracyclical position in stocks.
"The Gold Out Of Box 2020s Edition" financial education videos contain a detailed exploration of these inflation-protection and risk-reduction strategies, based upon 50 years of market history. The online version of this timely and unique resource can be found here. (https://vimeo.com/ondemand/goldstrategies)
The videos thoroughly explore the actual historical performance of the contracyclical assets of gold and stocks - and numerous possible ways of combining them - in every type of market and inflationary environment that we have experienced over the last fifty years. The results show the two assets working together provide a far safer approach for overcoming inflation than what is provided by either asset class by itself. There has been a historical ability to not only consistently come out ahead of inflation, but also a consistent ability to profit from secular bear markets, using rebalancing and ratio strategies.
These financial education videos do not include the events of 2022 - but were released in their original form in 2010, based on years of research at that time. The current "2020s Edition" was released in February of 2020 and entirely replaced the original version, building on another ten years of research, analysis, and refinement. This is not a time to panic, but it is a time to thoroughly understand investment performance in long-term bear markets as well as in times of high inflation - and most investors in 2022 do not.
For the next two weeks (until 6/5/22), a $100 online video purchase discount is available, using the coupon code BDC100. (This does not apply to online video rentals, but does apply to DVD purchases (that also include the 2010 version), please write for the discounted price if interested.)