

National Debt Watch
By Daniel R. Amerman, CFA
TweetIn this planned series of analyses, we will be carefully tracking the development of what has been an exponential process - the compounding of a huge national debt. The debt is already so large that it has been escaping "containment", the artificial low-interest rate environment created by the prior quantitative easings. We are currently seeing this reflected in high US mortgage rates, which are transforming the entire housing market. We are also seeing this in rising "term premiums" on a global basis, as the insatiable borrowing demand of the US government increases long term interest rates.
The growth in the national debt is already changing financial markets - and we are still just getting started compared to where we are going. With each year that the debt compounds, it will have an ever more dominant role relative to the economy and the financial markets. This means that even within the next five to ten years the growth in the national debt may become the primary determinant of investor outcomes, including retirement investors.
Crucially, this is a neutral analysis, not a "doom & gloom" or pessimistic perspective. Sometimes things get worse, and sometimes they get better. Because of the extraordinary importance of the growth in the national debt for the coming years, it is very important to be able to tell the difference. So, let's examine some specifics.
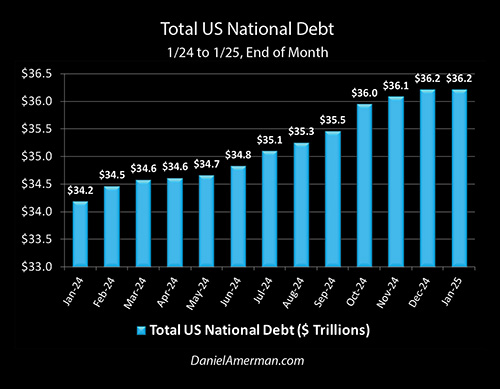
As a starting point, the total national debt for the United States grew from $34.2 trillion dollars at the end of January of 2024, to $36.2 trillion by the end of January of 2025. We have a fantastically high national debt that is still growing fast.
The national debt is almost four times as large as it was at the end of 2007, before the Financial Crisis of 2008 and the subsequent Great Recession. It is $13 trillion greater than it was at the end 2019, just before extraordinary increase in debt issued to stimulate the economy during the pandemic shutdowns. To put that $13 trillion into perspective, that is greater than the entire US national debt at the end of 2009, 233 years after the Declaration of Independence.
There has been an extraordinary acceleration in the debt - which raises the key question of is that acceleration currently increasing or slowing down?
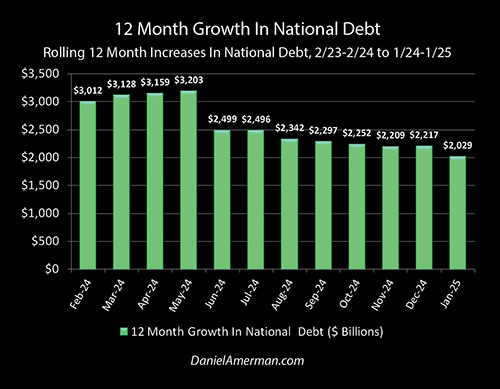
The graph above shows the rolling 12 month increase in the national debt. The bar on the far left shows the 12 month increase from the end of February of 2023, to the end of February of 2024, which was $3 trillion. The bar on the far right shows the most recent 12 month increase, from the end of January of 2024 to the end of January of 2025, which was $2 trillion.
The reason to use 12 month measures is that anything less than annual is distorted by the income tax calendar. The cash income of the US government peaks every April - reducing borrowing needs - and every month where individual or corporate withholding taxes are due also has lower borrowing needs. By going to 12 month intervals we compare like to like, as can be seen in the graph above where the 12 month April deficit is quite consistent with the March and May borrowings.
Objectively, there is both good news and bad news when we look at the trend in borrowing. The very good news is that the rate of growth in the national debt has been radically reduced over the last twelve months. From February through May of 2024 the national debt had been growing at a fantastic rate of over $3 trillion for every 12 month period measured. The trend line had been climbing, with each 12 months of borrowing being higher than the previous 12 months.
The 12 month totals fell abruptly in the June of 2023 to June of 2024 period, down to
"only" $2.5 trillion in additional borrowing. The trend line also reversed, moving from increasing every month from January to May, to decreasing every month from June to November. Note, however, that this improvement stabilized at about $2.2 trillion in November and December of 2024, before slightly falling again in January of 2025.
The very bad news is that even a $2.2 trillion annual increase in the national debt is far faster than historical norms. It took until 1986 for the US national debt to reach $2.2 trillion in total, so over 200 years. It took from 1991 to 2003, or 12 years, for the national debt to increase the $2.2 trillion from $3.8 trillion to $7 trillion. So, a $2.2 trillion a year increase is about 12X the pace at which the debt was increasing a little more than 20 years ago, before the Fed began financing the increase in the national debt.
Now, one could say the dollar is worth less today, and that is true. However, if we look at the change in the Consumer Price Index, the dollar today is worth about 52 cents today relative to the average for 1991 to 2003. So, with no war or recession, and even after adjusting for inflation, the national debt is still increasing at a rate that is six times as fast than the recent historical norm. Granted, this is an improvement from the almost nine times as fast that we were experiencing earlier in 2024 - but it is still an extraordinary problem.
To get a better idea of what is happening to the debt and why, we need to break the growth in the debt into its two main components. The first component is what is referred to as the primary deficit - the government spending more than it takes in. If the government spends an extra $100 billion, let's say on defense or foreign aid, and there is no increase in taxes, then the money must be borrowed, and the debt goes up by $100 billion.
The second component is the interest on the debt. Because the government spends more than it takes in, it has no money to make interest payments on the debt. Yet, the government must make the interest payments, or it would default. Therefore, it borrows the money to make the interest payments.
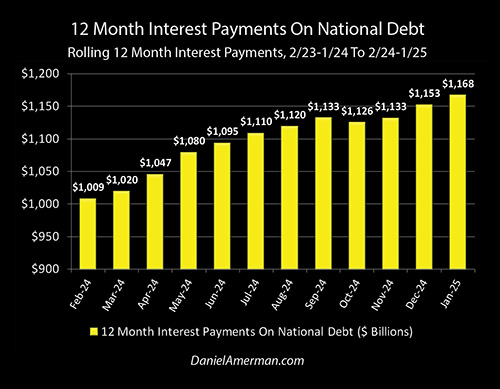
The graph above shows the sum of all interest payments on the national debt made over 12 month periods. On the far left, $1,009 billion in interest was paid between February of 2023 and January of 2024, and on the far right, $1,168 billion (or $1.2 trillion) of interest was paid between February of 2024 and January of 2025.
What the graph above shows is a compound interest problem. Historically, compound interest was the single most reliable means of building wealth, and that is how most people think of it. However, for a debtor, be they an individual or a nation, compound interest turns into a very potent source of financial destruction. Someone who uses a credit card to buy what they otherwise cannot afford, then borrows the money to pay the interest, and then borrows still more money to pay the interest on the interest borrowings, is going down a path of financial self-destruction that is very difficult to escape.
The same can hold true for nations. As long-time readers may recall, I've been warning for more than a decade that even as the markets and economy were stimulated by the cheap sugar high of massive deficit spending at very low interest rates, there would eventually be a price to be paid as higher interest rates on that huge debt would set off a compound interest spiral in the national debt. (Modern Monetary Theory was always a con job.)
As can be seen in the graph above, that day has arrived, and we are starting to pay the price for all those years of fiscal irresponsibility. During the 12 months ending in February of 2024, interest payments exceeded $1 trillion for the first time. They have continued to climb since then, and just in the last three months we have entered a new stage - more than of half all new debt issuance is for the purpose of paying interest on the previously outstanding debt. The compound interest spiral in the national debt is underway.
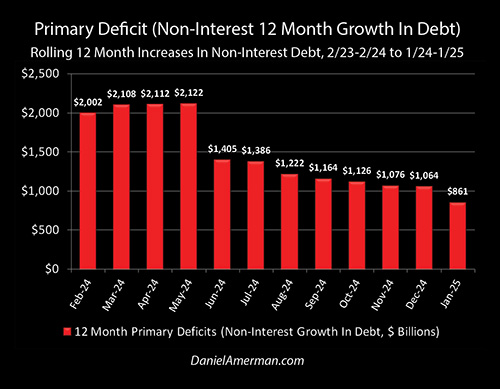
This can be seen in the graph above, which combines the previous two graphs. We start with the 12 month increase in the national debt, which was $2,029 billion from January of 2024 to January of 2025. We subtract the $1,168 billion in interest payments over those 12 months, all of which were borrowed. That leaves us with a $861 billion increase in the national debt, as seen in the graph above.
This is what is referred to as the primary deficit, the amount by which government spending exceeds tax and other revenues. when not including interest. I'm using a little bit different definition for deficit in this case, in that I'm looking purely at the objective increase in the national debt, rather than governmental accounting.
Once we split out the primary deficit - then we can see some really good news, as well as matters for concern. The primary deficit had been climbing up to the extraordinary rate of over $2 trillion per year, and had been relatively stable at $2.1 trillion per year during the March to May period. Then there was an abrupt fall down to $1.4 trillion per year for the 12 months ending in June. This decline continues until November and December, where the primary deficit stabilizes at a little under $1.1 trillion per year, before falling even further in January.
When we break apart the sources of the deficit, we can see there are two distinct problems. The problem with borrowing $36 trillion - and this was always there - is that you have to make interest payments on that money forever (unless the debt is paid down). Remember those unprecedented times in 2008 to 2014, and 2020 to 2021 when the government was just shoveling money out the door trying to spend, spend, spend as fast as possible? Every one of these many trillions of dollars of new debt is not only still there, but it has been growing the whole time, as more money is borrowed each year to make the interest payments. The money was never free, that was always a remarkably irresponsible strategy that achieved short term economic and political benefits in exchange for decades of financial pain - and we're now into the decades of pain part.
We've now reached the fantastic point, where if we compare to where we were in the 1991 to 2003 period, even on an inflation-adjusted basis interest costs alone are 3X what total average annual deficits. This is inflexible unless interest rates go materially down - which brings its own problems. And it will get worse every year, on average.
There has been an enormous improvement since this summer in primary deficits. The precipitous decline in 12 month primary borrowings that occurred over the summer is a strongly positive development. This $1.26 trillion a year reduction in the growth of the national debt sharply slows down the rate of compounding, and if (big "if") it is sustained could potentially add years to the time before the growth in the national debt creates highly negative results for the economy and markets.
But, while it is better, and that's good in comparison - it's still awful overall. Primary deficits are also running almost 3X the historical average, on an inflation-adjusted basis. We in essence have two powerful compounding engines running simultaneously. Each are around a trillion dollars a year, each are running about three times the historical rate, meaning in combination we are running 6X that rate on an inflation-adjusted basis. Unless something major changes, our current $36 trillion national debt will be only a short-term way station, as the national debt rapidly grows far larger, with ever greater real time consequences for the economy, markets and investors.
********************************************
April 5-6 2025 Workshop Brochure link: