

Government Deficits 100% Funded By Fed Monetary Creation Since September 2019
By Daniel R. Amerman, CFA
TweetIn just the last four months, the U.S. government has spent $457 billion - almost half a trillion dollars - more than it has taken in. In that same time and using monetary creation, the Federal Reserve has created and put $457 billion in new cash into the financial system, either buying U.S. Treasuries or funding the ownership of those Treasuries by others.
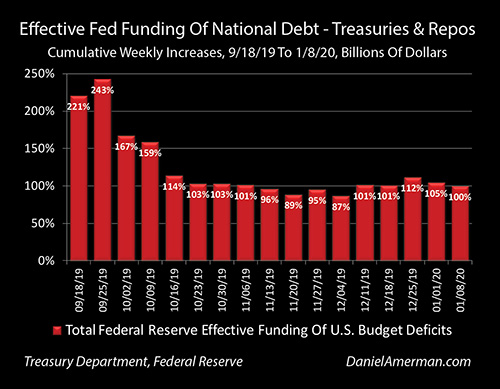
As shown in the graph, through the last 17 weeks the Federal Reserve has effectively created exactly 100% of the new money needed to fund United States government deficit spending. This has been particularly true over the last 13 weeks, as the cumulative new money put in by the Fed since the week of September 18th has been very close to the cumulative new money taken out by the government in each week. Indeed, the visual correlation is so tight as to be extraordinary for a relationship that neither the Fed nor the government will admit exists at all.
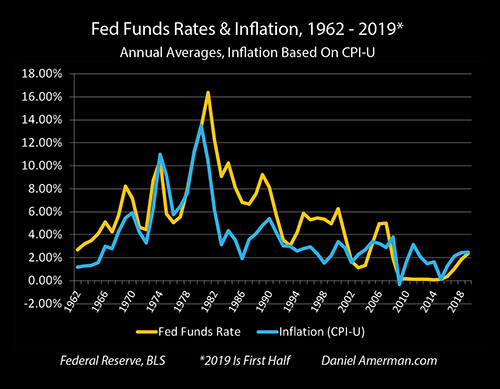
In normal and free markets, when governments take on too much debt and try to borrow too much money - this triggers a rise in interest rates. However, high stock prices, high home prices, the economy and the financial viability of the government all currently depend on very low interest rates. If control were to be lost and rates were to spike upwards, we would likely see a rapid market crash and potential financial crisis.
Therefore the Federal Reserve is doing what no responsible central bank is supposed to do, and effectively funding the growth in the debt at well below free market interest rates via monetary creation on a massive scale - without admitting that it is doing so.
As explored in this analysis, which follows other analyses in this series that have been tracking these developments, the arcane specifics of the repo market are becoming less important with each week, and what is really happening is becoming ever clearer. This is all about funding the fast growing national debt at lower rates than what rational investors would accept in a free market, and the repo crisis was a symptom of that problem, not the cause.
This analysis is part of a series of related analyses, which support a book that is in the process of being written. Some key chapters from the free book and an overview of the series are linked here.
A Crisis In Funding The National Debt
This analysis covers the new information we have gained over the past five weeks, and builds on previous analyses, the contents of which are not repeated herein. The most important background information on the specifics of the repo market and how the national debt is being funded can be found in Chapter 18, linked here. The immediately preceding analysis which covers the 90% funding of the U.S. national debt through early December is linked here.
Briefly, while little covered by most of the media, a significant crisis began in the United States financial system last year, when the U.S. Treasury department pulled over $100 billion out of the financial system in the week of September 16th, 2019, including both tax collections and borrowings, to pay for government spending.
Even though the Federal Reserve was well aware that the Treasury intended to do that, as it turned out, there wasn't enough liquidity available in the system to smoothly do so. In other words there wasn't enough free money floating around in the system and available for investment for the Treasury to pull the $100+ billion out, without triggering a liquidity shortage, a shortage of funding in the repurchase agreements market, which caused short term rates to very briefly soar to near 10%.
This market, which is better known as the repo market, is vitally important to the functioning of the U.S. financial system. Indeed it was the freezing up of the repo market in October of 2008 which almost brought down the global banking system. Yes, it was the subprime mortgage derivatives market that set off the losses - but it was the actually running out of cash, the loss of liquidity including in the repo market that nearly brought down the global banking system in a week.
The Federal Reserve stopped the liquidity crisis in 2008 through simply creating money on a vast scale, over $400 billion in that week, and lending it out. After almost 11 years of comparative calm and without repo market interventions, the Federal Reserve stopped the crisis in 2019 much as it had stopped the last major crisis in 2008, by creating new money on a massive scale and lending it to the banks and other financial entities that were at risk. In the process - the Federal Reserve effectively funded the growth in the United States national debt that week.
Purchases Of Treasury Obligations
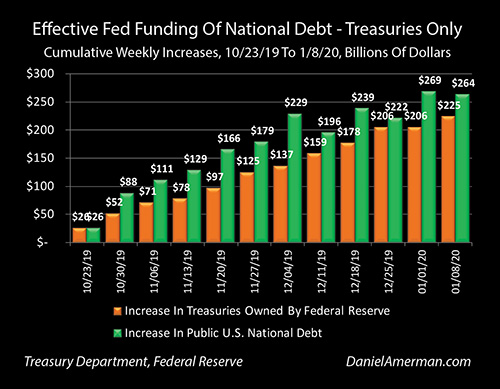
The graph above shows the 12 weeks from the week ending October 16th, 2019, to the week ending January 8th, 2020. The orange bars are the cumulative weekly purchases of the national debt by the Federal Reserve, as a result of its decision to fund the purchase of approximately $60 billion per month in U.S. Treasury obligations using monetary creation. (There's also an element of portfolio rebalancing with reducing ownership of other assets previously purchased via monetary creation, but it is created money either way).
Now this funding is not through direct purchases from the U.S. Treasury but through the markets, which is actually far more effective for what the Federal Reserve desires. The Fed does not just want to fund the national debt, but to control interest rates in the markets in the process, and this means they need to go through the markets to buy the Treasury debt. (There is also a current legal prohibition against direct purchases, but that law could be changed in a day if the government wanted to use that much less effective means of funding the debt).
There is quite a correlation between the growth of the orange bars of the Federal Reserve's cumulative purchases of government debt, and the growth in the green bars of the cumulative net new issuance of government debt.
Over those 12 weeks the Federal Reserve purchased $225 billion of U.S. Treasury debt, and the United States Treasury issued $264 billion in net new debt to finance deficit spending.
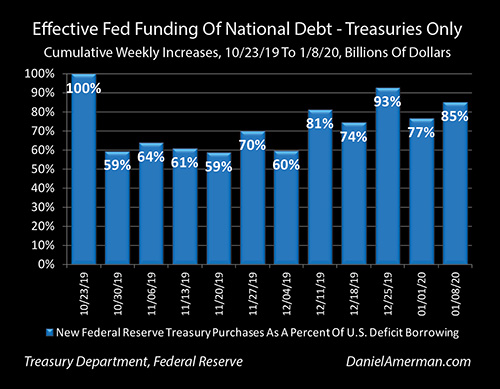
As can be seen in the graph above, over those 12 weeks the Federal Reserve effectively funded about 85% of the growth in the national debt simply by purchasing Treasury obligations. This percentage has been rising over the last five weeks, and there is some important information value there.
In the first week of the Federal Reserve intervention they purchased 100 percent of the net issuance of new debt. That then more or less stabilized in a range of about 60% during the next five weeks, from the end of October to the beginning of December.
Going back to the dollar graph with the orange and green bars, we can see that the green bars of the cumulative deficits do not grow in an even manner, and there can indeed be some weeks or months that the national debt shrinks slightly as the government runs a (small and temporary) surplus.
The weekly and monthly deficits vary when it comes to both spending and the money coming in from tax collections. A particularly important factor is those months when the Treasury is collecting disproportionately more taxes, such as when the corporate income tax withholding payments are due, or when individual income tax withholding payments are due, or particularly with year end tax collections in April. At such times, the cumulative amount of the deficits can fall substantially on a weekly or monthly basis.
During those time periods, some of which we saw in December in particular, the Federal Reserve buying the same amount of debt per week and per month will lead to a greater percentage funding of the national debt than would otherwise be the case. These factors are what led to the percentage of the U.S. deficit spending being effectively funded by monetary creation rising to 85% on a cumulative basis through early January of 2020, even though the weekly purchases did not rise.
The Effective 100% Financing Of Government Deficits Via Monetary Creation
The graph below shows the combination of both repo lending by the Federal Reserve, and the Treasury purchases as well. As covered in much more detail in previous analyses (Chapter 18 link here), repo lending requires collateral, which is generally U.S. Treasury obligations. Indeed, the owner of the Treasuries usually buys them specifically to use as collateral for accessing the very low interest rates available through the repurchase agreement market. So when the Federal Reserve extends a repo loan - it is funding the ownership of a U.S. Treasury obligation which was likely purchased specifically to be used as collateral for that loan.
Every billion dollars in repo loans by the Fed thus means funding for another billion dollars of the national debt at very low interest rates, which means another billion dollars of funding for the debt that does not have to come from other investors at what could be higher interest rates. So when the Federal Reserve creates billions of dollars to extend repo loans to banks and other financial borrowers - it is indeed funding the growth in the U.S. national debt with those dollars, albeit in a slightly less direct manner than with direct purchases of Treasury obligations by the Fed.
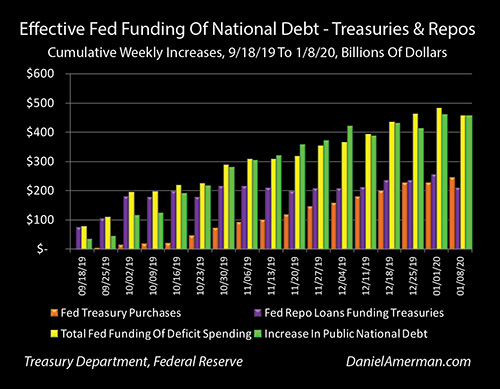
The time period shown in this graph goes back to the original crisis in the repo market in the week ending on September 18th, 2019 (weeks ending mid-week for the markets, i.e. Wednesdays). As can be seen, the early monetary creation by the Fed was almost exclusively used to fund repo loans, and it leaped from about $75 billion in the first week, to about $100 billion in the 2nd week, to about $175 billion in the third week, and about $200 billion in the fifth week. This was a major crisis - even if the general public has no idea it was happening - and the solvency of the financial system would have indeed been in peril if the Federal Reserve had not created hundreds of billions of dollars in new money to alleviate the lack of funds in the market, that had been caused by the Federal government pulling too much money out of the system to fund its spending.
To the extent that it has been covered at all in the financial press, most of the Federal Reserve's actions have been covered in terms of the repo crisis, or the so-called "Repocalypse" as it has been referred to by some commentators. There were fears for year end, and as can be seen above, the crisis at least temporarily peaked without ever taking down the markets.
However, it's also interesting to note that when we compare the purple bars of repo lending in early January and in late October, they're not all that different, and are in fact even down a little bit. Through repo lending, the Federal Reserve was funding a cumulative total of $216 billion of the national deficit through the week ending October 30th, 2019, and it was cumulatively funding $211 billion for the week ending January 8th, 2020.
In contrast, the orange bars of cumulative Treasury debt purchases by the Federal Reserve have grown from almost nothing in October, to passing the cumulative total for repo lending by early January. When we add the repo lending and the Treasury obligation purchases together, we get the yellow bar of the total cumulative funding of the national debt via monetary creation by the Federal Reserve.
So, despite the headlines and given the lack of a year end crisis, this hasn't really been about repos since the end of October. The total repo loans are down, but the total funding of the national debt has more than doubled. It is the Fed's purchase of Treasury obligations that is now that dominant source of cumulative deficit financing.
Although the crisis in the repurchase agreement market was legitimate, and if the Fed had not created the money to contain it there could have indeed been a systemic financial crisis - the repo market problems are not the issue but the symptom, and the Federal Reserve knows it.
The crisis began with the national debt and the Treasury department pulling more liquidity out of the system than the system could handle - to the surprise of the Federal Reserve, which made a major mistake.
Starting particularly with the 5th week, which ended on October 16, 2019, look at the almost uncanny correlation between the yellow bars of total debt funding by the Federal Reserve using monetary creation, and the green bars of the cumulative growth in the national debt. The correlation with the repo market falls apart in the next two weeks. And from that point forward - it is all about funding a trillion dollar a year deficit at rates lower than what the markets would fund on their own.
Remarkably, after 17 weeks or almost exactly one third of year of Federal Reserve funding and the growth in the national debt - the two are exactly equal (to the nearest billion anyway). The national debt grew by $457 billion, and the Fed used monetary creation (new or shifting of previous monetary creation) to fund $457 billion of the growth in the national debt
This remarkable correlation which shows what is really happening is even more clear in the percentages graph shown above. What the Federal Reserve has really been doing is creating almost half a trillion dollars - in just one third of a year - to fund the growth of the national debt, in an amount that has been bouncing up and down around 100% since mid October, and that equals exactly 100% on a cumulative basis as of early January of 2020.
The Threat To Retirement Account & Home Values From The National Debt
As covered in the free book, the artificially low interest rates that the Federal Reserve has been continuously forcing on the system since 2008 have created the highest asset prices we have ever experienced.
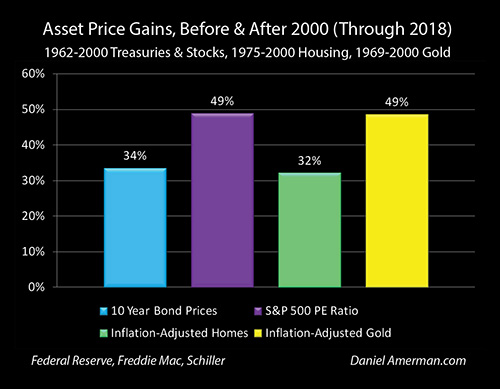
We do not currently have record stock values, record retirement account values and record home values in spite of the Federal Reserve's heavy-handed interventions to prevent crisis – but specifically because of them, as covered in much more detail in the individual book chapters.

Now that the national debt supercycle has merged with these Federal Reserve cycles, the growth in the national debt and the Fed's funding of that debt via monetary creation have become perhaps the single most important determinants of financial security for all of us today.
The rapid growth of the national debt is also likely to become one of the biggest future threats to standards of living in retirement. This is not just from some distant future default or bout of hyperinflation, but because of the current pressures today on our elevated asset prices for retirement accounts and homes, that are dependent on the indefinite continuation of interest rates at levels that are too low to attract the money to fund the growth in the debt on a free market basis. As we enter the 2020s, the game has fundamentally changed just in the last few months, and we are in a totally different place.
Few people realize this today, but yet there will be no getting away from it over the coming years. Hopefully this analysis is been helpful for you in understanding just how dramatically things have been changing even in the last few months.
Learn more about the free book.
********************************************