
Rising Inflation Is Punishing Savers With Deeply Negative Real Interest Rates
By Daniel R. Amerman, CFA
TweetSupply chain disruptions have created a scarcity of goods in some categories. At the same time, the U.S. government continues to flood the economy with dollars, trying to keep spending up and the economy out of recession. This combination of too many dollars chasing too few goods is a classic formula for inflation, and on a rolling average basis we have indeed experienced the highest rates of inflation this past spring and summer that we have seen in the last forty years.
However, inflation is only half of the equation when it comes to maintaining the value of savings. The other half is interest rates, which can offset or even more than offset the rate of inflation, leaving savers with the purchasing power of their savings intact.
The historical norm with freer markets has been for savers to demand higher interest rates to compensate for higher inflation. What is completely different this time around is that we no longer have a free market in interest rates, but rather a Federal Reserve that has forced very low interest rates in general and near zero percent interest rates in the short term.
As analyzed herein, this combination of the Federal Reserve simultaneously feeding inflation while cheating savers out of any compensation for that inflation has created a situation that is far, far worse than what was seen with the high inflation of the 1970s and early 1980s. The stripping away of wealth from ordinary savers for the benefit of the government and Wall Street has reached punishing levels, with a 6.6X increase in the pain during the spring and summer of 2021.
This analysis is part of a series of related analyses, which support a book that is in the process of being written. Some key chapters from the book and an overview of the series are linked here.
Inflation-Adjusted (Real) Interest Rates
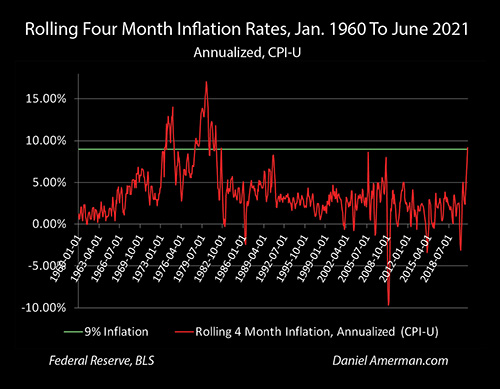
As explored in the analysis linked here, the combination of physical supply shortages and abundant money has produced the highest rates of inflation seen in forty years. The rolling four month rate of inflation reached an annualized level of 9.18%, which was the highest we have seen since October of 1981.
The years 1981 and 1982 marked the end of the prolonged bout of high inflation that had gripped the United States since ramping up in 1973 and 1974. There was however a critical difference for investors and the government between current conditions and what they were forty years ago.
Yes, on an annual basis, the official annual rate of inflation (CPI-U) was 10.38% for the year 1981. However, the average yield on a three month Treasury bill in 1981 was 14.03%. This meant that an investor could keep their liquid safety reserves either in bills or money market funds invested in Treasury bills, and earn a 3.65% after-inflation return. Even after losing 10.38% of the value of their dollars, because they could earn a risk-free rate of 14.03%, they could still end the year with 3.65% more purchasing power than they started with.
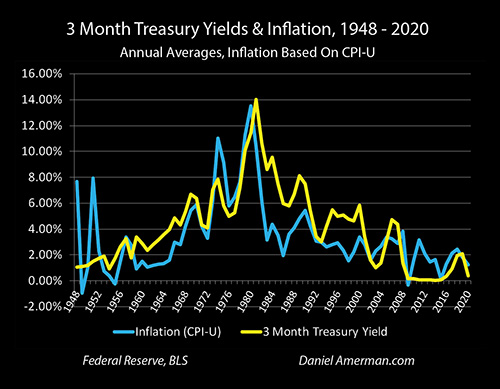
This relationship from the 1970s and 1980s can be clearly seen in the graph above, which compares annual average rates of inflation and three month Treasury yields. Yes, inflation was much higher during that time - but so were interest rates. Most of the time, the yellow line of risk free interest was well above the blue line of inflation, meaning that investors were not only being fully compensated for inflation, but they were also earning a substantial "real" return above the rate of inflation.
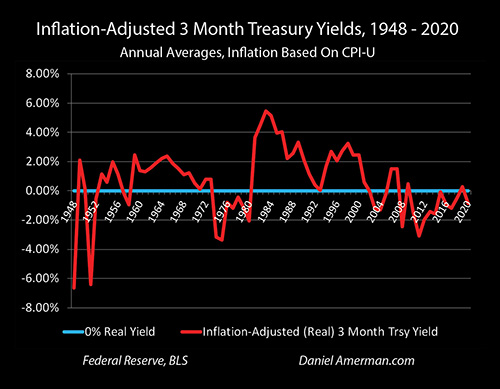
"Real interest rates" is the term that economists use to refer to inflation-adjusted interest rates, and a historical graph of the difference between three month Treasury yields and inflation can be seen in the graph above. Real short term interest rates were continuously positive between 1959 and 1973, and then again from 1981 through 2002.
The Federal Reserve slammed down interest rates in the early 2000s, deliberately creating negative real yields in the attempt to contain the damage from the popping of the tech bubble and the resulting recession. However, the biggest change was the Fed using its new powers of reserves-based money creation to force nearly continuously negative interest rates on the nation between 2008 and 2021.
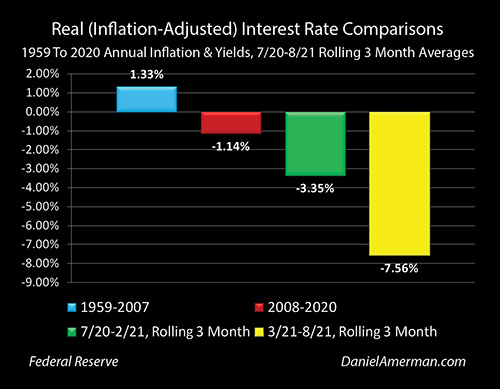
While it has received almost no attention in the media, the Federal Reserve used its greatly expanded powers to force a massive redistribution of wealth from the ordinary people of the nation to the federal government and Wall Street. Between 1959 and 2007, before the Fed used money creation to control interest rates to an unprecedented degree, real interest rates on 3 month Treasury bills had averaged a positive 1.33%, meaning a saver or investor could come out ahead of inflation just by investing in short term Treasuries with effectively no credit or interest rate risk.
Real interest rates were forced down as a matter of policy by the Federal Reserve to negative 1.14% between 2008 and 2020. This destroyed the traditional wealth building nature of savings, and reversed it to a slow destruction of wealth, where money in the bank or in a money market account was worth a little less in purchasing power terms at the end of each year than it had been at the beginning. The damage was the worst for retirees, as the traditional financial planning move from stock to bonds in retirement, for reasons of both principal safety and ample cash flow, was effectively removed as a cash flow option.
Higher Inflation & Punitive Negative Real Interest Rates
A defining difference between the inflation in late 1981 and the current inflation in 2021 is the level of interest rates.
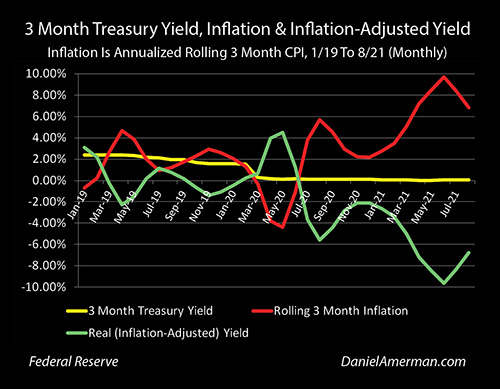
The graph above shows the three month Treasury yield, the rolling three month rate of inflation that has been annualized, and the real yield that is obtained by subtracting the rate of inflation from the Treasury yield. The unprecedented effects of the pandemic shutdowns and the Fed's response can be seen starting in early 2020.
The Fed engaged in a massive round of money creation, while forcing the yellow line of the 3 month Treasury yield down to near 0%. The scale of the unprecedented shutdowns created a brief and uncommon window of what the government said was three months of deflation between March and May of 2020. When there is price deflation, money is growing more valuable, which can also be expressed as a negative rate of inflation. Deflation is effectively then added to interest rates instead of being subtracted, and there was the unusual sight of the green real yield line spiking up above the yellow near zero percent interest rate line, as the rolling three month real yield (briefly) rose to around an annualized 4% in March and April of 2020.
The anomaly of adding deflation to interest rates was short lived, however, as the three month rate of inflation climbed by an annualized near 4% in July and close to 6% in August, wiping out the previous round of deflation altogether. As the red line of inflation spiked upwards, it was wiping out the purchasing power of the dollars that were invested at near zero percent interest rates, and the green line of real yields spiked downward to a punishing negative 6% by August of 2020.
The negative yield then fell back a bit and ended up averaging about negative 3.35% between July of 2020 and February of 2021. While not remarked about in the press at all, there is critical information value here when it comes to the deliberate redistribution of wealth. During this time, the financial viability of small and local businesses were being destroyed all around the nation, even as the major chain stores and huge internet-based businesses prospered. At the same time, the Federal Reserve was tripling the annual inflation losses for ordinary individual savers, from the negative 1.14% that prevailed from 2008 through 2020, to a negative 3.35% rate.
That same negative 3.35% real interest rate was a very important financial benefit to the government as it issued more new debt in a single year than it did in its first two centuries of existence, even on an inflation-adjusted basis (analysis link here). It also created tremendous wealth for major institutional investors who were effectively being paid to borrow money, thereby enabling the massive move into the single family rental market by big investors that is now fundamentally changing home prices (one of multiple factors that is doing so, as explored in detail at the September workshop).
As explored in the analysis linked here, by March of 2021 supply chain shortfalls were leading to fast rising prices for cars, used cars, gasoline, food, semiconductor chips and the costs of building new homes. The households of the nation were flush with another round of stimulus money that the Treasury had borrowed much of from the Federal Reserve, still more money chased after still scarcer goods, basic economics prevailed, and the rate of inflation spiked up to a level that the United States had not seen since the early 1980s.
On an annualized basis, the three month rolling rate of inflation jumped to 5.2% by March, then 7.2%, then 8.5% and then peaked (for now) at 9.6% in June, before falling back to a still very high 8.4% and then 6.7%.
We've seen those rates of inflation before, forty to fifty years ago. We know that supply chain shortages are a particularly dangerous form of inflation that central banks can be effectively helpless against, with the OPEC oil embargo supply side price shock playing a key role in the 1970s inflation. We know that far from being "transitory", this type of inflation can become persistent through the creation of self-reinforcing inflationary cycles with wages and the prices of goods, where one year of high inflation sets off another year of high inflation, that then sets off the next year of high inflation.
As a bit of an aside, it seems like many people have forgotten this hard-won knowledge, and are instead focused on the hyperinflation scenarios. Yes, hyperinflation happens, it is high drama, it is very easy to understand, and writing about it feeds into confirmation bias for a large audience - but from the perspective of actual economic history it is not the most common form of highly destructive inflation. Inflationary cycles that knock off 8%, 10%, or 15% of the purchasing power of a currency per year, year after year, have destroyed extraordinary sums of wealth and they have done so in our lifetimes, for people of an age in most developed nations.
We know what this much more common but still highly destructive type of inflation looks like - indeed, we are seeing it right now. It might become hyperinflation and the quick annihilation of the value of the dollar, and it also might not. Let me suggest that the more important information is not what could be happening next, but what we are seeing right now, in practice, which is numerous supply side price shocks that are creating the highest rates of inflation in forty years. These supply side factors are ongoing and even worsening, as chip factories have recently begun shutting down in China due to energy problems, even as fleets of anchored ships build up outside of bottlenecked US ports, and even as shortages of trucks and truck drivers create problems in the US and havoc in the UK.
What is very different this time around is the Federal Reserve using a form of massive money creation to cheat investors out of their ordinary compensation for inflation, and to instead hold short term interest rates down to near zero percent, even while feeding that money to a free spending federal government and thereby feeding powerful inflationary pressures. This combination of artificially low rates and artificially high amounts of money to be spent is creating a degree of pain for savers and investors that we did not see in the last round of major inflation.
If we average the rolling three month inflation rates between March and August of 2021, then our annualized average is 7.60%. Thanks to the Fed forcing down interest rates , the average yield on the three month Treasury was 0.04% for that same time period. This means that average savers and investors were enduring extreme pain from an inflation-adjusted perspective, with a negative 7.56% return on their money.
Another way of phrasing this, is that starting in 2008, the Federal Reserve used its new powers of money creation to flip the real return from savings from the positive 1.33% that had prevailed from 1959 to 2007, to the negative 1.14% real return that became the new normal from 2008 to 2020. The ordinary savers of the nation now lost wealth every year instead of building wealth, while the federal government and Wall Street each strongly financially benefited from the vast new supplies of artificially cheap debt.
In the midst of the pandemic shutdowns and the government stimulus, the Federal Reserve radically increased its power, with an unprecedented degree of money creation even while it slammed interest rates down to zero. The net effect by the spring and summer of 2021 was to increase the degree of pain for the average saver by 6.6X, from negative 1.14% to negative 7.56%.
This current financial pain is very real and can be seen every time any particular person compares price changes to the interest rates on their bank statements or money market account statements. When the price of a car goes up, or the price of gasoline, or the price of a steak, or the price of a single family home - but the amount of dollars in the bank does not go up because of zero percent interest rates - then that person is losing wealth, losing spending power, and losing standard of living in the most real of terms. The recent difference is that this is happening much faster than it had been, and if we use government inflation statistics, then we can put a number on it - the rate of losing wealth and standard of living has recently been happening 6.6X as fast as it had been in the previous 13 years.
This steep rate of declining real wealth is hitting every normal person with savings in the United States, in every state and city - but it is not natural, it is instead an artificial distortion, and an artificial redistribution of wealth.
The real cost of the national debt for the federal government is plunging. When it comes to short term rates, it is now 6.6X times cheaper for the Treasury to borrow in inflation-adjusted terms. As individuals lose 7.5% of the value of their money each year due to negative real interest rates - the federal government sees 7.5% of the real value of its outstanding short term debt evaporate.
The cost of the soaring national debt is not theoretical in the slightest, it hits all of us every time we go to the store. Unfortunately, most people do not understand the linkage, and the government would very much like to keep it that way.
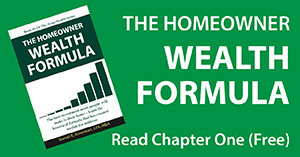
Wall Street and large institutional investors can borrow money at rates that are far lower than ordinary individuals. Depending on the particulars, the cost of borrowing could be near zero percent, 1%, 2% or 3%. When the much higher recent inflation rates are taken into account, that then means that in inflation-adjusted terms these insiders are able to borrow at negative rates of between -7.5% and -4.5%. What is flowing out of the household wealth of the average American is flowing into the wealth of the powerful few, as they are literally paid to borrow in inflation-adjusted terms, while keeping the asset profits for themselves. (Housing is one of the few ways for individuals to take advantage of what the major investors are doing, as introduced in the Chapter One link here.)
This rapid increase in the rate of the destruction of household wealth for savers can also be seen when using the "boiling frog" analogy. The idea with that analogy is that so long as the temperature of the water in the pan is only slowly increasing instead of rapidly increasing, the frog won't notice until it is too late.
With normal interest rates as seen from 1959 to 2007, then after discounting for inflation, the average saver would see $1.00 increase to $1.07 in five years, and $1.14 in ten years. The gains were modest, but before the massive interventions from the Federal Reserve, the long term average was for savers to slowly build wealth in inflation-adjusted terms.
With the negative 1.14% real interest rate that was the average between 2008 and 2020 as a result of quite deliberate Federal Reserve policies, the average saver saw their savings fall to a real value of 94 cents in five years, and 89 cents in ten years. Every "frog" in the country was seeing the real value of their money in the bank and money market funds falling just a bit every year, but the rate of decline was slow, and perhaps not noticeably painful in any given year.
With the recent 7.56% negative interest rate using 3 month rolling inflation measures in the spring and summer of 2021, the average saver would see the real value of their savings fall to 69 cents in five years, and to 48 cents in ten years. That water is now coming to a boil fast, and we "frogs" can feel the pain of the wealth loss in real time - as most of us are right now, in 2021 (at least when it comes to the purchasing power of money in the bank).
For those skeptical "frogs" who don't trust the government (shocking idea!) but believe it to be capable of massaging inflation statistics for its own benefit, then there is a case for increasing the rate of the boil to a negative 10% real interest rate. The rapid boil now increases to a dollar only being worth 62 cents after five years, and 39 cents after ten years.
A 10% actual rate of inflation is not that far from the historical rate of 10.38% for the year 1981, so it is worth going back and visually comparing the situation from 40 years ago to what it is today, in order to see just how completely different it is, even with comparable rates of inflation.
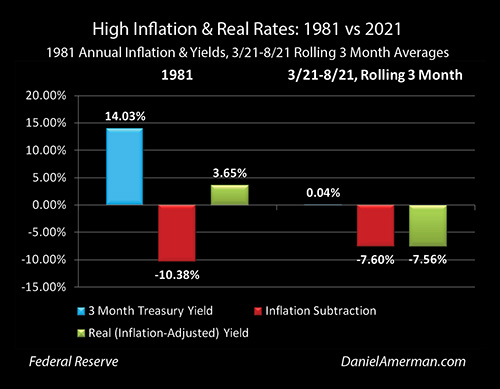
Yes, the official annual rate of inflation was higher in 1981 than what the government is saying is our recent rate of inflation. But saver income was starting from a towering height of 14.03%, enabling savers and investors to overcome inflation entirely and still earn substantial positive yields with something that is generally considered to be close to a risk-free investment (at least in pre-tax terms).
When we compare just inflation rates - we only see half of the picture. The other half is the interest income - which in a free market is supposed to compensate us for the rate of inflation, as rational investors should not lend money at negative real yields. However, we are not even remotely in a free market for interest rates nor have we been so for a very long time, that is more or less the point behind the massive monetary creation by the Fed is to override free market forces and to cheat savers out of what would be their normal compensation for inflation.
The government wants zero percent yields for the short term, and far below free market yields for the long term. The Federal Reserve is using the extraordinary powers that Congress gave it in 2008 in the midst of crisis, to make sure that the government gets what it wants on what it intends to be a more or less permanent basis (although that is very much in play at the moment, as we reviewed at the September workshop).
Were it not for these government controls, we would likely be seeing interest rates of perhaps 6% to 10% - with the associated potentially catastrophic damage to stock prices, bond prices and real estate prices. However, because these controls do exist, savers across the nation are left with nothing - no real interest income and nothing but the pain of seeing the purchasing power of their savings stripped from them at a rate that has accelerated to being 6.6X as great as it had been since 2008.
I think that most would acknowledge that we are currently living in very strange times. There are extraordinary changes underway in multiple areas at the same time. One of these changes happens to be the most punishing financial abuse of ordinary savers by the government and Wall Street in our lifetimes. This abuse is being covered over by none of the "powers that be" discussing it, and by the concept of "real interest rates" being just a little more complex than the way that information is usually presented to the average voter or saver. Hopefully this analysis has provided you with both the information and the understanding, to see what is being done to us all.
Learn more about the free book.
********************************************
High rates of inflation and artificially low interest rates can create another formula as well, and that is a formula for building wealth through housing investments. Indeed as covered in the book "The Eight Levels Of Homeowner Wealth Multiplication" (link here), four of the eight times that the homeowners of the nation "won the lottery" were during the high inflation of the 1970s and 1980s, as the power of inflation was multiplied to the extraordinary financial benefit of the nation's homeowners.
A much more sophisticated but still readily understandable version of how to turn high inflation and low interest rates into wealth on a risk-managed basis can be found in the "Creating Win-Win-Win Solutions Using Real Estate-Based Asset/Liability Strategies" video course, link here. What is developed in the course is not real estate investment in the way that most traditional individual investors see it, but the quite different and more sophisticated perspective used by professional financial analysts that is helping to currently drive so many institutional dollars into the single family rental marketplace in this environment of rising inflationary pressures.