

A Still Strong Signal For A Secular Bull Market In Gold
By Daniel R. Amerman, CFA
TweetWith gold having retreated from its August highs even while the S&P 500 has been setting new records, it would seem that the relationship that dominated the markets through most of the 2010s has returned, with stock returns dominating gold returns.
But yet, when we take a longer term look - gold is still doing very well relative to stocks. Indeed, for nine straight months, from March through November of 2020, we have seen something that has only happened twice before in the last fifty years. Each of the two previous times this has occurred after a long run up in stock prices, and it has been part of a cyclical change to a cycle favoring gold over stocks for a decade or more thereafter.
This analysis is part of a series of related analyses, which support a book that is in the process of being written. Some key chapters from the book and an overview of the series are linked here.
(This is an update of an analysis from July of 2020, with five additional months of market data.)
Understanding The Contracyclical Relationship
This analysis is an important market update, but it is not intended to be a stand-alone explanation of the two year rolling end value ratio, the secular cycles, or the extraordinary swings in profits or losses that can produced from the contracyclical relationship between stocks and gold. That information is developed in Chapter Nineteen (link here), and that is the place to go if you have any questions about the measures, the methodology, or the many implications for investment purposes.
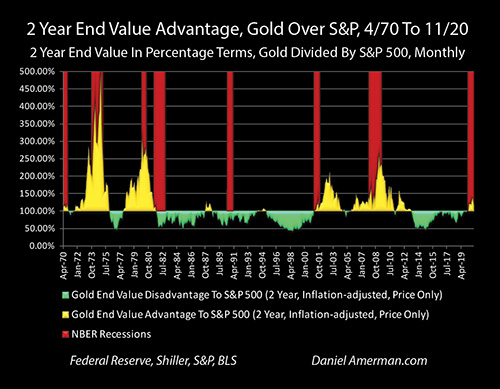
What the above graph shows is the rolling 2 year advantage to gold over stocks on a monthly average basis, expressed in percentage terms. Where the area of the graph is gold, there is a two year running advantage to gold, and where the graph is green, there is a two year running advantage to stocks.
There are 608 two year comparisons that make up the graph, with the first being April of 1968 to April of 1970, and the most recent being November of 2018 to November of 2020 (using monthly averages).
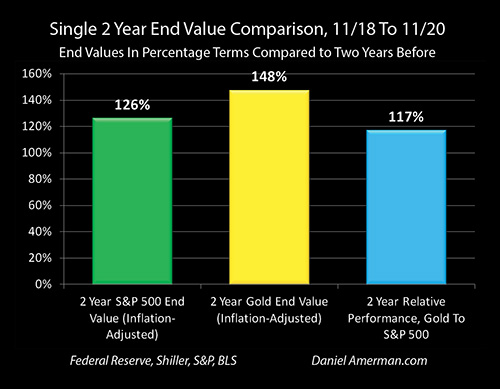
The final comparison in the longer term graph is also shown above, to illustrate how the numbers work. Even in inflation-adjusted terms, the S&P 500 was indeed up sharply over two years as it set new records, climbing to 126% of where it was in November of 2018.
However, even with gold being off its August highs - it was still up in November of 2020 to an inflation-adjusted 148% of where it had been two years before. So, when we compare the relative advantage of owning gold versus stocks, then on a price basis investors would have been 17% better off owning gold than stocks (148% / 126% = 117%).
Another way of phrasing this is that once we adjust for inflation, then gold was up by a little less than half, stocks were up by a little more than a quarter, and investors had indeed substantially changed their perception of the value of gold relative to stocks over the two years, the new stock market highs notwithstanding.
Now, if we look back to August when the average price for gold was $1,969 an ounce, on an inflation-adjusted basis it was up by 59% compared to August of 2018, stocks were up by 15%, and there was a much larger 38% advantage to holding gold over stocks on a price basis over the two years. But nonetheless, both August and November still reflected that investors over two years had changed their perceptions in favor of gold over stocks by a significant margin, and this has been true for every month since March of 2020.
As developed in detail in Chapters 19, stocks and gold are contracyclical assets in secular cycles.
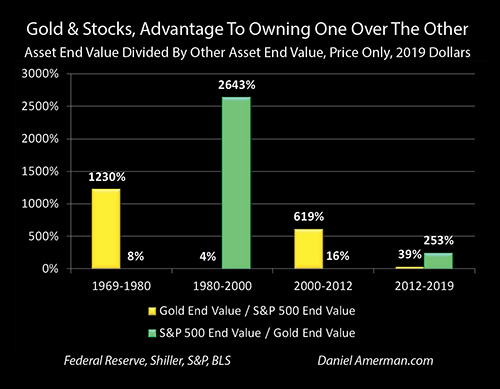
There are enormous advantages to owning the asset in its up cycle, relative to owning the asset in its down cycle. There was a 12 to 1 advantage to owning gold over stocks between 1969 and 1980 (price only), and a 6 to 1 advantage between 2000 and 2012. There was a 26 to 1 advantage of owning stocks over gold from 1980 to 2000, and a 2.5 to 1 advantage to owning stocks over gold from 2012 to 2019. This becomes even more important when we take sequence of returns risks into account for retirees or those who are close to retirement, as developed in Chapters 20 through 22.
Of course, the practical problem is identifying which asset is in its up cycle, and whether there has been a change in the cycles.
Based on my research, daily and monthly information seemed almost useless when it came to identifying changes in the long term cycles, and even annual comparisons were much less reliable than I would like.
However, when we move to two years comparison using the six step process developed in Chapter 19, a lot of the noise and randomness drop out, and there is a consistency to the changes in investor perceptions about the relative values of the two asset classes that usually persists for many years thereafter.
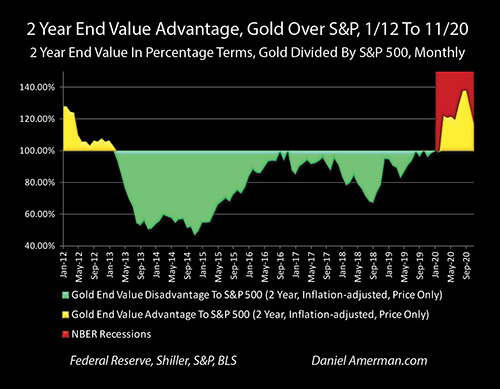
When we "zoom in" a bit, and just look at the rolling two comparisons between stocks and gold between January of 2012 and November of 2020, then we can see the consistency for investor perceptions when it comes to stocks versus gold that dominated the price relationship between 2013 and 2019.
In March of 2013, the two year rolling perception advantage shifted to stocks, and stayed there for every two year comparison for many years. (There was a miniscule 0.34% advantage to gold near the very end, from October of 2017 to October of 2019 that is too small to create even a single fully golden pixel on the graph, it was the only exception.)
When we look at the golden area for the nine months in 2020 of significant 2 year advantages for gold over stocks - that is meaningful. Those kinds of shifts do not happen very often.
As covered in more detail in my July analysis (link here), we have only seen two other instances of a 10%+ two year rolling advantage shifting to gold after a long bull market in stocks, that were also associated with recessions - and each one of those did indeed call the beginnings of a secular shift in the cycles to gold strongly outperforming stocks for the next decade or more.
Now, that doesn't mean that this comparison is some sort of crystal ball or magic decoder ring when it comes to infallibly predicting the future. Once that obvious limitation is accepted, then it is fair to say that as of the end of 2020, we still have a very strong and historically proven indicator showing that a shift in the secular cycles between stocks and gold may indeed be underway.
Learn more about the free book.
********************************************
Watch The 2020s Edition Online
Learn more about the contracyclical strategies for gold and stocks, brochure link here.