

Gold & Bonds During A Pandemic - Comparing Two Opposite Sources Of Crisis Profits
By Daniel R. Amerman, CFA
TweetWhile stocks were performing very poorly in the early days of the pandemic shutdowns, gold was doing quite well. There was another crisis investment that was doing even better however, as can be seen in the graph below, which shows price changes in percentage terms when compared to mid-February.
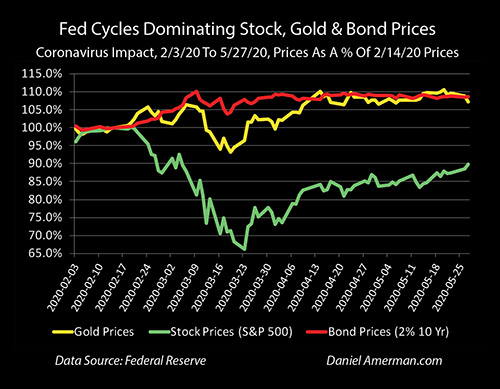
Stocks are the green line, gold is the yellow line, and the red line is the prices of 10 year U.S. Treasury obligations.
There is a great deal of similarity between how long term Treasury bonds performed and how gold performed as the crisis was rapidly growing. There were however two very important differences, with some important implications for the future, as will be explored in this analysis:
1) The source of the bond profits in crisis was the direct opposite of the source of the gold profits, despite the similar appearance.
2) While it might come as a surprise for many investors, long bonds were a substantially more profitable investment than gold at the height of the market crisis, as can be seen by comparing the heights of the red bond line and the yellow gold line, at the time of the bottom for the green stock line. Indeed, compared to prices before the breakout began, gold was losing money on the day of the stock market bottom, even while bonds were at near peak prices.
This analysis is part of a series of related analyses, which support a book that is in the process of being written. Some key chapters from the book and an overview of the series are linked here.
Gold, Stocks & Bonds
In the previous analysis in this series (link here), we explored the relative performance of gold and stocks (as represented by the S&P 500) between early February and late May, as the coronavirus pandemic and the resulting economic shutdowns transformed global economies and markets.
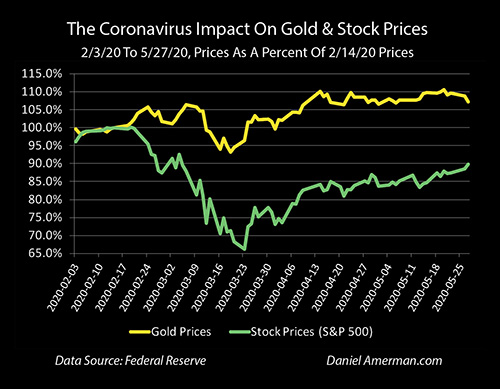
The wide gap that developed betwee gold and stock prices with the pandemic and shutdown is a very good short term example of the contracyclical relationship between gold and stocks.
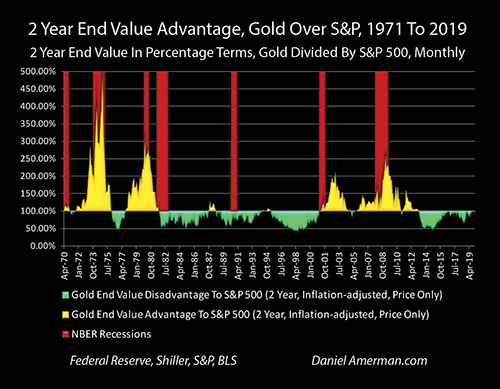
That short term relationship was also an almost perfect match with what fifty years of financial history shows us is perhaps gold's most valuable investment attribute over the long term, which is not just inflation protection, but its contracyclical relationship with stock prices, as shown in the graph above.
When we add the red line for percentage changes in ten year U.S. Treasury prices, it can be plainly seen there is another asset category that has also been moving in the opposite direction of stocks, and that is long term Treasury bonds
That long bond prices would soar with another round of crisis and the containment of crisis was entirely predictable and expected, as I have been exploring for readers for what is now years in advance - but the source of the price movement is quite different from that of gold. Indeed, it could be called night and day different, as illustrated in the graphic below.

Gold investment is a method for protecting against a deepening of the crisis, and a failure on the part of the Federal Reserve to maintain financial, market or monetary stability. Gold is a form of portfolio insurance, and as such is essentially betting against the Fed succeeding in its unprecedented efforts. As developed in Chapter 19 and explored in previous analyses - over the long term, in secular cycles, gold has a track record of superb performance for troubled times when stocks are at their worst.
In contrast, long term treasury bonds are a perfect example of aligning one's interests with the Fed, and trying to profit from the Federal Reserve playbook when it comes to containing crises.
Translating Fed Intentions Into Bond Price Movements
What is happening in the day to day financial headlines in practice has been following what was described in detail in Chapters 4, 5 and 9-14 of the free book, written well in advance of the pandemic and shutdowns.
Those chapters are meant to be an in-depth tutorial exploring how ever more extraordinary Federal Reserve interventions in response to crisis, following a known playbook, will transform investment prices in all asset categories in ways that are not part of normal free markets. I won't repeat them, but will instead offer a very quick summary of a few relevant points for bonds in particular.
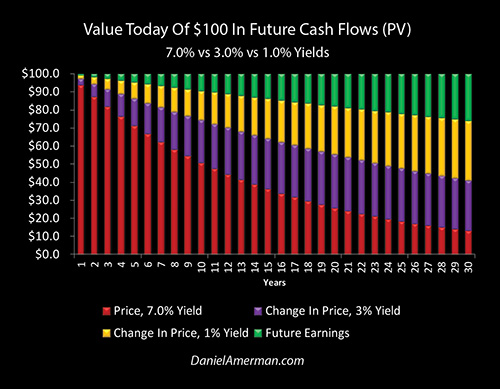
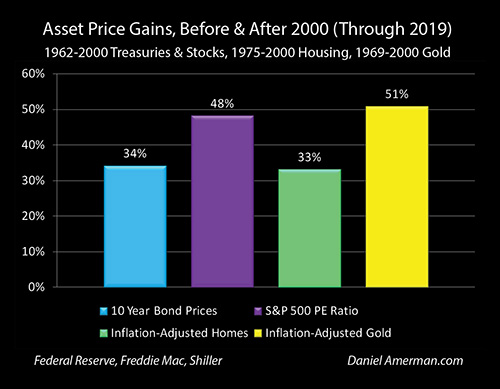
As shown above, the price we pay for cash flows we will receive in the future - including bond principal and interest payments - changes based on interest rates. The red bars represent how much an investor would pay for a single cash flow from 1 to 30 years in the future, in order to earn a 7% yield - which was about the average yield on 10 year Treasury obligations between 1962 and 2000, before the Fed's extraordinary cycles of interventions kicked into gear.
The purple bars represent the prices paid for cash flows at a 3% yield, which would have been quite relevant for around 2018, when I was first preparing these graphs. The degree of profit relative to historic norms can be seen by comparing the height of the purple bars, the increase in price, relative to the underlying red bars, the average historical price paid. As can easily be seen, the farther out we go, the longer the term of the cash flow (or the duration to get a bit more technical), the "bigger the bang" in terms of the increase in profits relative to the red bar of the price paid.
The yellow bars show the increase in price from a future decrease in interest rates - which has since happened, with 10 year yields moving well below 1% at the peak of the crisis. As explored in those chapters, for those who understand how the Federal Reserve attempts to escape crises and recessions, the primary tool is to reduce interest rates. With this round, the Fed had been openly working on its strategy for years in preparation, as covered in particular detail in Chapter 13. Long before the pandemic, and whatever the source of the recession would be, we knew there would be a particular focus on long bonds and monetary creation to buy long bonds in terms of the Fed's intentions for fighting another recession, and the movement from purple to yellow - with the accompanying extraordinary profits for bond investors - was "baked in" long in advance of the actual pandemic and shutdowns.
So when we look at the three lines above, we see three different assets each following their own scripts and their own expected roles - as could be understood well in advance - even if the particular source of the crisis being a coronavirus pandemic leading to unprecedented government shutdowns of entire economies, could not be anticipated in advance.
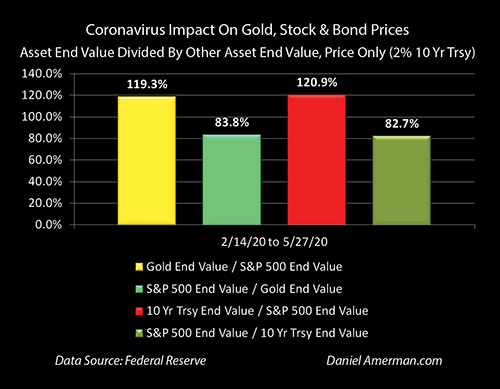
When we compare the end values as of late May, using the same methodology developed in the previous analysis, then we have almost identical results for bonds and gold. Someone invested in gold rather than stocks on February 14th would have had 119.3% more assets on May 27th, and someone who was in 10 year bonds would have had 120.9% of the assets (both based on price changes only).
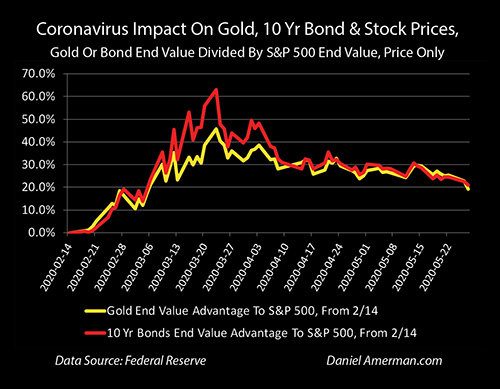
However, when we track over time, we can see something that may come as a surprise to many investors. If we look at ten year U.S. Treasury bond prices, then the relative advantage to owning long bonds over stocks peaked on March 23rd, the same day that gold reached its peak advantage, which was also the same day stocks bottomed out.
What's fascinating is that ten year U.S. Treasury bonds outperformed gold by almost 40% on a cumulative basis through that day, holding a 62.9% advantage over the S&P 500 since February 14th, versus the 45.7% advantage a gold investor would have had over a stock investor.
Two entirely different sources of crisis profits - with one being buying insurance against the system melting down, and the other being aligning with the system and trying to profit from the known tools for how the containment of crisis would be attempted. As it turned out - alignment was outperforming fear of deeper crisis.
The reason that bonds were performing so much better than gold on the path to that peak day of crisis, was that a lot more money was chasing being aligned with the Fed using its extraordinary powers, than was chasing being protected against a potential meltdown of the system.
As explained in the analysis "Three Beautiful Arbitrages" which I sent to readers in December of 2018, and would later become Chapter Five in the free book (link here), there is a playbook for what the Fed would do, it was understood by professional and institutional investors, and they stampeded into long bonds because they anticipated how the deepening crisis would lead to higher bond prices.
To be clear, what is analyzed herein is short term price movements in a time of crisis, which can be a very different from long term returns when an asset is held for many years. Current bond interest rates are very low, below even the rates of inflation of recent years, and once peak prices are reached are likely to generate negative inflation-adjusted returns if held for long periods of time, unless... there are further rounds of the attempted containment of crisis, further attempts to get the economy out of recession, which lead to still lower interest rates. Particularly if the United States moves to negative interest rates, then by far the largest bond profits yet could still be ahead, as I plan to explore in my next analysis.
Gold delivers no cash flow, and is entirely reliant on price gains for investor income. However, while gold's relationship with inflation is not perfect (as explored in Chapter 16), it can still perform far better than very low interest rate bonds when held over the long term in a potential inflationary environment.
Asset Prices & The Containment Of Crisis
It is also worth noting that (in my opinion) stock price movements since the March 23rd bottom can only be explained by the markets pricing in Federal Reserve interventions, rather than the underlying economic and financial fundamentals.
The economy was in freefall, no one had any idea of how bad the pandemic would turn out to be, or how long the economic shutdowns would last. Week after week, there was nothing but record bad news with regard to unemployment, the economy, corporate profits - but yet the stock market turned around and began a major rally, with the NASDAQ setting all-time highs even while the S&P 500 got back to above even for 2020.
What was happening was that asset prices were moving not in response to a free market pricing in the underlying fundamentals, but to the anticipation of the actions that the Federal Reserve would take to contain the crisis. And this was not new, but the continuation and amplification of a process that has already been underway for 20 years.
As explained in more detail in Chapter One (link here), bond, stock, home and gold prices have been dominated by the containment of crisis since 2001. There was the crisis of the collapse of the tech stock bubble that was contained by the Fed forcing interest rates to 50 years lows, then there was the amplification of the containment of crisis with the Financial Crisis of 2008, and now there is the further amplification of the containment of crisis with the pandemic and shutdown crisis of 2020.
Each escalating round of deeper crisis has ultimately led to the counterintuitive result of escalating asset prices, due to the amplification of the monetary and financial interventions.
With each round, interest rates and asset prices grow ever more unnatural, even as the degree of monetary creation by the Federal Reserve needed to create and maintain the artificial investment environment grows. And while it sounds like this must fly apart at any time - and it could - what history shows us is that it can be surprisingly stable, as was seen between 2009 and 2019.
The end result - so far - is record prices for stocks, bonds, homes and gold.
It is this process, and the ongoing successful containment of - or failure to contain - crisis, that is likely to be the dominant determinant of long term investing results over the coming years, rather than the repetition of historical results from markets that were free of such interventions.
Because integrating how cycles of crisis and the containment of crisis can change investment results is not part of traditional financial education for most people, I created the framework shown below to help people better understand how this works.
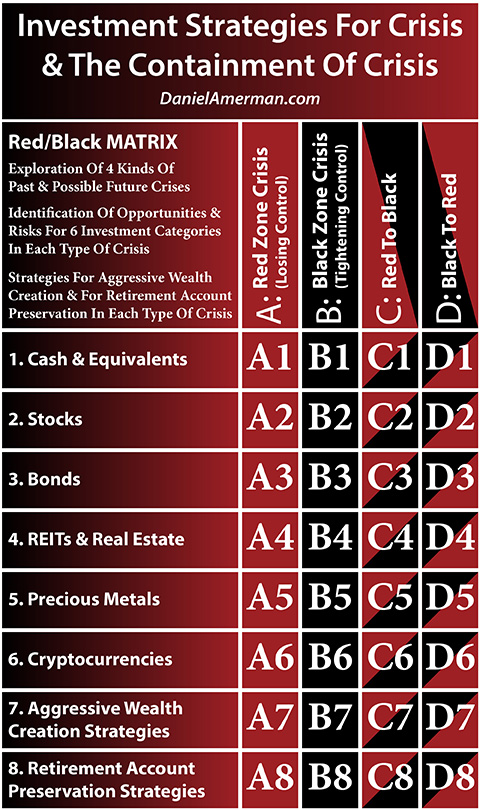
What was explored in this and the preceding analysis were rows 2 (stocks), 3 (bonds) and 5 (precious metals), during a developing crisis, and then how prices changed with the early stage attempted containment of crisis by the Federal Reserve.
Learn more about the free book.
********************************************
Much more information about the three very different types of strategies for the pandemic economic crisis and the attempted containment of crisis is linked here.