

Truth Testing Inflation With Reality
By Daniel R. Amerman, CFA
TweetThere is a fundamental and mandatory aspect of inflation that most investors do not take into account: one cannot understate inflation without simultaneously overstating inflation-adjusted wealth creation.
As will be explored in this analysis, a very good way of determining whether inflation statistics are accurate is to measure the degree of physical (not market) wealth creation, and see whether it can pass a reasonableness test. This same approach can be used to test the reasonableness of different inflation assumptions, in terms of whether they are too high or too low. Indeed, as demonstrated herein, we can determine a range for actual inflation through comparisons to physical goods creation.
(In the workshop section (below the asterisks), there is a broader discussion of current fast-moving financial events.)
This analysis is part of a series of related analyses, which support a book that is in the process of being written. Some key chapters from the book and an overview of the series are linked here.
Real GDP Goods Per Capita
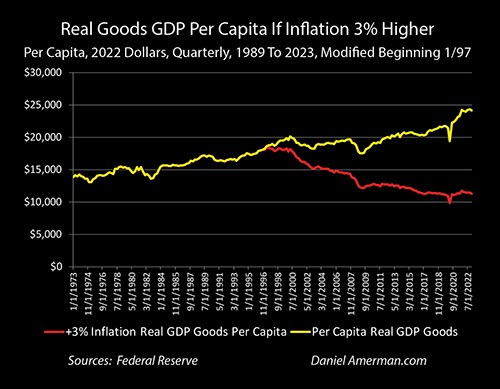
The graph below has become one of my favorites for testing the accuracy of inflation rates. It is difficult on a personal basis to directly interpret a number like Gross Domestic Product - GDP covers the entire nation, it includes government and business investments, which are hard to see, and most people are not even sure what is in it. By its very nature, GDP is large and abstract.
However, people are pretty good at noticing the physical goods around them, things like food and clothing as well as cars and appliances. These are tangible objects that we experience on a personal level, both in our own lives and in the lives of friends and family.
The goods portion of the Gross Domestic Product is the final sales of durable (such as appliances) and nondurable (such as food) goods in the United States, and on an annualized basis it was $8.4 trillion as of the second quarter of 2023. If we adjust for inflation (using the GDP deflator), then we get the real goods GDP. Divide by the population, and we get the per capita real goods GDP. Now we have something personal and tangible that everyone experiences, and this gives us an ability to test over time whether what we are being told corresponds to what we are experiencing. Unlike this week's grocery bills, this is a slow cumulative test over time, where we can see the results for not just ourselves but all of those around us.
 Let's think it through. Any time a claimed rate of inflation is too high for too long of a period, then the basics of life and standard of living - durable and nondurable physical goods (including food, housing and energy) - will appear to decrease at a rate that is in excess of the physical reality we can observe around us.
The higher the rate of inflation, then the higher the cost of physical goods relative to income - particularly if income is not keeping up with inflation. Therefore the less the physical goods consumed, the lower the standard of living for the entire nation. At particularly high rates of inflation, this must then translate into a depression in the form of fast falling physical standards of living that get rapidly worse every year. If you don't see that rapidly worsening depression, the sharp drop in goods consumed annually - then the persistent and particularly high rate of inflation doesn't exist, it fails the physical reality truth test.
The red line above tests what per capita real goods GDP would have been if the real rate of inflation had been 3% higher than the official rate since 1997. For that to be true, then on average physical standard of living would have fallen by about 19% between 1997 and 2007, and by a total of about 37% between 1997 and 2023. This is a depression level reduction in the physical standard of living for a nation over a 25 year period, meaning a 25 year depression.
Does this correspond to your life experience and what you see of the people around you? Do you find it to be a credible number? If, based on your personal observations for physical goods, you do not find the number to be credible, then you have just established a boundary - the real rate of inflation has to have been less than 3% above the official rate of inflation since the late 90s. (This is a more refined version of the test for purported persistent rates of inflation above 10%, contained in the analysis linked here.)
Conversely, any time a claimed rate of inflation is too low for too long of a period, then the basics of life and standard of living - durable and nondurable physical goods (including food, housing and energy) - will appear to increase at a rate that is in excess of the physical reality we can observe around us.
A sustained low rate of inflation, particularly when the growth in income is higher than the rate of inflation - as the government says has been happening for decades - means that standards of living for the median person will be rising every year. So, more and higher quality food is consumed by each family, even as more and higher quality appliances and furniture are purchased, even as a higher percentage of the population becomes the owners of ever larger and nicer homes, even as more people own more cars and take ever nicer vacations.
If we look back over the last century, we can indeed see some periods when this happened. The US did become much wealthier over the 1940s to 1960s in particular, and the nearly 20 year expansion between the early 1980s and the late 1990s was another sustained example. We know what those years looked like, everything was there in terms of the increase in average standards of living. Homeownership and home sizes did increase, along with the quality and quantity of the appliances and the furniture, even as the quality and quantity of food (particularly meats and protein) increased. We didn't have to go looking for evidence of prosperity - the tangible evidence of an entire nation becoming more prosperous as the standards of living climbed was all around us.
As shown in the yellow line in the graph above, we have just (allegedly) been through one of the sharpest increases in average physical standards of living in US history, with inflation-adjusted per capita goods consumption increasing by about $4,000 in the five years between the beginning of 2017 and the end of 2022. This is equal to the same (inflation-adjusted 2022 dollars) $4,000 increase in physical goods consumption by the average person that we saw between 1979 and 1999, during the longest economic expansion that most people have experienced in their lifetimes.
Where are the goods today? Where is the tangible, physical prosperity that comes from cramming the prosperity of twenty years of the longest economic expansion of most of our lifetimes into a mere five years? Is this unparalleled rapid increase in physical abundance in the room with us now?
Let's step back for a moment. According to the United States government, final sales of durable and non-durable goods increased from $5,574 billion (annualized) in the first quarter of 2017 to $8,291 billion in the last quarter of 2022, an increase of almost 50%. Adjust for the estimated 8.2 million person increase in population, and the official 17.4% decrease in the purchasing power of a dollar (GDP deflator), and that works out to a 19.9% increase in physical goods consumption per person. Those tangible real goods have to be there, we have to see them for the average person, there should be no possible way we could miss them, no matter which way we turn.
Unless... as a round number example, the actual decrease in the purchasing power of the dollar over five years was 28%, not 17.4%. In this case, the actual increase in physical goods is only 4.5%. So, if we more accurately account for inflation, then about 75% of that mysterious vast increase in physical goods just kind of shimmers and disappears. The millions of big new homes, the tens of millions of upgraded new refrigerators and couches, the weekly filet mignon and king crab leg dinners for everyone, they all wink out of existence as if they never existed in the first place.
If we reject the yellow line as not being realistic for what we see with actual goods, and we also reject the red line as not being realistic, then we have just done something very useful indeed - we have set boundaries. We have rejected the official rate of inflation as being unrealistically low - and that is major. We have rejected a +3% real rate of inflation as being unrealistically high. And therefore, based upon what we personally experience, we can be confident that the actual rate is somewhere in between.
But, here's the thing. If those 75% of new physical goods all shimmer and disappear, then so does a very large part of the common Narrative that drives almost all business, investment, and financial planning decisions. Indeed, it is no exaggeration to say that everything we think about the past, present and future economy must change along with it, as a mathematical necessity.
Looking At The Bigger Picture
For the graphs that follow, I used a simplified measure for defining recessions, which is indeed one of the basic measures. If the size of the national economy in inflation-adjusted terms is lower than it was two quarters before, that is defined as being in a recession, and that appears in red. Conversely, so long as the inflation-adjusted economy is larger than it was two quarters before then we are in an expansion.
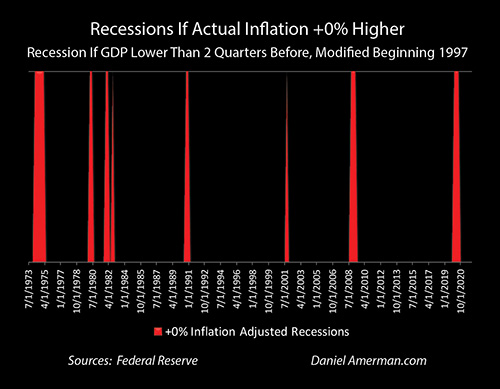
This simplification produces an economic history of recessions that is almost identical to the official version, so long as we use the official rate of inflation. There have been only three recessions, and the US experienced a little less than 2 total years of recession out of the last 26 years, with the other 24+ years consisting of endless prosperity and expansion.
Note that so long as we stick to the official version of inflation, then there is consistency. Of course, prosperity for 24 of 26 years would produce perhaps the single highest increase in average physical standards of living in human history, with the already wealthiest nation in the world experiencing a 33% increase in real per capita goods consumption over that time.
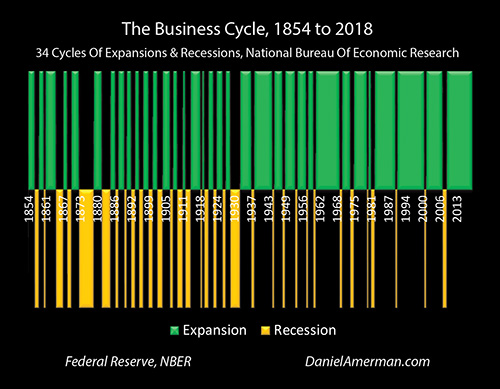
Now, for a quarter century that included the tech bubble popping, the Financial Crash of 2008, the Great Recession, the secular stagnation of the early 2010s, the pandemic, the shutdowns, and the disruptions to the global supply chains, there might be some skeptics who would say "are you sure about that?" Yet, as shown in the long term graph above, when we stick to the official inflation rate, then we are still in what is the most consistent period of prosperity in the history of the nation.
However, if we do a reality test on real per capita goods GDP, and determine that the official rate of inflation fails our test, then as a mathematical necessity, this means that we have also determined that the official narrative on recessions and expansions is itself a work of fiction. The higher the actual rate of inflation - the greater the number of actual recessions, the greater the depth of each recession, and the longer that they lasted in practice. (This would mean that the Great Recession actually lasted longer than 19 months - who could have known?)
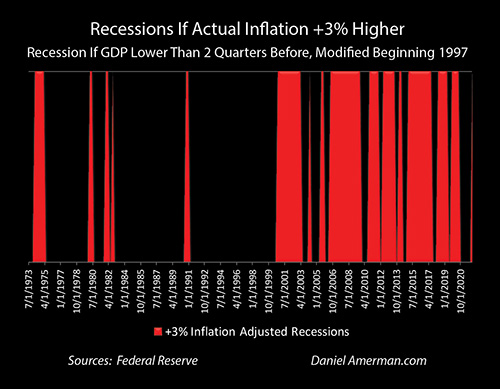
What if the real rate of inflation was 3% higher than the official rate? Well, if that were true, then much of the recession graph needs to turn red. Indeed, with a 3% higher real rate of inflation, then most of the last quarter century would turn out to be a long series of recessions, punctuated by very brief periods of expansion. On a secular basis, we as a nation would have spent the last quarter century in a depression, that on average has gotten worse every year. Indeed, this would have been the worst depression in U.S. history, much worse than the Great Depression of the 1930s.
Does that pass your personal reasonableness test? If it doesn't, then that is very useful information, because we have another boundary. We have a rate of inflation that produces two conflicts, in terms of a drastic decline in the physical standard of living, as well as the worst depression in US history, and if those aren't true, then we have to reject secular real rates of inflation that exceed the official rate by 3% or more.
On the flip side, we have two reasonableness tests in the other direction. If we have not seen one of the largest increases in physical standard of living in history crammed into the last five years, and if it is hard to believe that the tech stock market crash, the Financial Crash of 2008, the Great Recession and the pandemic shutdowns represent one of the most consistently prosperous periods in US history, then we have to reject the official rate of inflation and accept that it is not accurate.
Changing Contradictions With Changing Inflation Calculations
Identifying how much they change is the important part, and for that, we need more tests. As part of my preparation for my upcoming workshop, I'm working with about a dozen inflation reasonableness tests, of which the real per capita goods GDP is one. My theory - and this has been working out very well - is that any persistently and materially incorrect rate of inflation is going to create results over time that don't make sense, there will necessarily be contradictions that will appear in the data, and this will occur in multiple categories. The key then is to go on a hunt for where those discrepancies should occur, find a series of them in different categories, and to test them. As the number of test categories is expanded, this should increase the reliability and robustness of the results. Any inflation rate that is persistently too high will throw off numerous contradictions, any rate that is persistently too low will also throw off numerous contradictions for a reasonable observer.
Some tests are non-financial factors that reflect consumer behavior - if the behavior is changing in a way that doesn't make sense with a given inflation rate, then we have a contradiction. Some tests are physically tangible, such as the real per capita goods GDP. Some tests are cross-comparisons across categories. Some tests are ratios, where one inflation-adjusted number is divided by another, the inflation drops out, and we are left with an inflation-independent ratio that can be tracked for reasonableness over time.
When we throw out what doesn't make sense, what causes too many contradictions on both the high and low sides, then we are left with a reasonable range, that does not throw out contradictions. In that range is - financial and economic reality.
What is reasonable is much closer to the official version than the cartoonish gloom and doom version of inflation, it might seem like pretty weak tea indeed when compared to some of the popular versions of inflation that are currently out there.
Reality is much more boring - it is a long, slow, bureaucratic process of changing the way inflation is calculated, that has now reached the point where the official data is becoming dangerously misleading. How do we know the methodology has been changing? The government tells us this has been happening, the Bureau of Labor Statistics is continuously "improving" how it gathers data and calculates inflation rates.
As we will be reviewing at the workshop, interestingly enough, the old "unimproved" versions of inflation used to work really well at not creating contradictions in the data - the data was logically self-consistent. Since that time, however, we've had a multi-decade process of a bureaucracy redefining the methodology, with strong institutional incentives to make choices that would lower the reported rate of inflation. As stated in my previous analysis:
"That said - I've also been arguing since 2007 that the government is and will be generating inflation statistics that at least somewhat understate the real rate of inflation. The importance of inflation calculations in determining national elections has been very clear since at least the 1970s. High rates of inflation and frequent recessions lead to poor election results. Using somewhat lower rates of inflation not only looks better for elections, but it also produces higher official economic growth, meaning higher stock market valuations, as well as higher real incomes, and shorter and less frequent recessions.
Systematically pushing down inflation over time does not require a people in black cloaks kind of conspiracy, where a "real" inflation rate is known but a fake one is published. Reality is much more mundane. There is no single objective real rate of inflation, but rather there is an extremely complex group of calculations, that are dependent upon methodologies and assumptions that change over time. There is a bureaucracy that makes the determinations of the changes in the methodologies and assumptions, and that bureaucracy is very much politically controlled, it is vital for both politicians and the Administrative state. Looking at the thousands of decisions made in determining how inflation is calculated, those bureaucrats who make the "correct" decisions each year, are that much more likely to be promoted by the politically-appointed executives - and this will be very clear to those employees. Human nature + bureaucracy + motivated political agendas + a period of decades will likely systematically produce a methodology that will on a cumulative basis calculate a steadily lower official rate of inflation, relative to the price changes being measured."
The effects of this process can indeed be seen and identified, by observing the introduction of contradictions that did not previously exist, and that grow stronger with time as the inflation calculation methodology moves ever further away from the real rate of inflation. If you step back and think about it - it is mathematically mandatory that introducing a falsehood in the form of misstating the rate of inflation will lead to inconsistencies in the data that depends on that rate, and that should be observable. And indeed, problems in the data that did not used to exist now do exist - and to an increasing degree, exactly as would be expected.
The next step is perhaps the hardest one - but it is also mathematically mandatory. Let's consider a financial paper, the Wall Street Journal, that every day carries the information flow that investment and business decision making is based upon. If we accept that the official rate of inflation is at least somewhat misstated (as it is), that this has been true for many years, and that there is bureaucratic/statistical drift that has been slowly increasing the discrepancy over time, then every page of that newspaper on any given day that uses data that is based upon the rate of inflation - is necessarily at least somewhat wrong.
The economic growth rate is wrong - as is the valuation of the stock market. The Fed's effectiveness in controlling inflation is materially misstated. The projected abilities to pay Social Security and service the national debt (particularly with higher interest rates) are grossly misstated. Real consumer incomes are falling at a significantly higher rate than stated, and this means that any business selling to consumers is likely using bad data when it comes to making decisions. The housing market is not as overpriced as the market thinks it is, and gold has a very different value in real terms. The government is taking a substantially higher piece of the economy via inflation taxes and financial repression than the general public has any idea. Many of the foundation assumptions underlying financial planning and long term investments - are wrong.
For this situation to persist, incidentally, logically requires that inflation rates not be grossly understated, they have to be within a reasonable range over time, or the whole facade would quickly collapse in a series of lies. However, it only takes a modest degree of difference - particularly over time - to invalidate much of the data used by businesses and the public for decision making.(Over a short period of time, then yes, one can have grossly understated rates of inflation where the real rate is 5% or 10% above the official rate, but this cannot persist for long without collapsing the facade.)
A Common But Flawed Approach To Inflation
For those who find that their personal experience with inflation is different than the official inflation statistics - and there are many millions of us these days - let me suggest that the following is a common approach for dealing with the discrepancy.
1. There is the economy, as widely and officially reported in great detail, with markets hanging on the latest information.
2. There is the opportunity to build wealth through the markets and business investment opportunities.
3. A better understanding of the economy and economic changes provides a superior ability to identify wealth-building opportunities with markets and businesses
4. Real wealth building occurs in inflation-adjusted terms, and if inflation is higher than officially stated, higher rates of returns are needed to overcome the higher real inflation.
Adjusting for inflation is therefore something that is done on the back end. There is an alternative approach, where adjusting for inflation is done on the front end.
1. If the real rate of inflation is not what is officially reported, then the economy as a mathematical necessity is also not what is officially reported, and to see real economic growth and activities we must first determine a reasonable real rate of inflation, and then adjust the public economic figures appropriately.
2. Business and market opportunities can be sorted into three relevant categories: A) those that are purely based upon widespread market beliefs; B) those that are purely based on real economic activities (such as owning a business); and C) those where real economic activities can be expected to change market beliefs within the investment time frame.
3. While superior information is always superior information, making investment decisions based on different economic beliefs than the market (A), particularly on a short term basis, will often produce poor results, as trading and the resulting prices will be determined not by facts but the prevalent beliefs, which is the reason for the old saying: "markets can remain irrational for longer than a rational investor can remain solvent".
4. However, when it comes to (B) and (C), where results may be driven by actual consumer and business behavior, then a more accurate understanding of the economic reality, may indeed provide the basis for better decision making.
5. The importance of adjusting real returns for the actual rate of inflation remains, however, it now arguably becomes one of the less important uses when it comes to wealth creation, rather than the primary use.
Fully accepting that the real inflation rate is even moderately different from the official rate therefore means reversing the way that the information is used. The traditional form is pessimism, to take the "black pill" in terms of the current online vernacular, where the situation is much worse than most people understand. And it would indeed be awful -almost beyond description - if we had indeed been experiencing 10%+ inflation for decades.
However, when we understand how better identifying even moderate differences between official and real inflation can give us better information for better decisions, then we get the optimistic "white pill" instead, an edge instead of bleakness. Hopefully, this analysis has been helpful for you in seeing the difference in the perspectives.
********************************************
October 28-29 Workshop Brochure link:
Using a multitude of tests we will find inflation numbers at the workshop that are reasonable, that do not throw off contradictions, and in the process, we will be redefining the Narrative about what has been happening with the US economy. It is very different from what we are routinely told. This information will provide fundamental new information about investments and businesses, and will by itself, make for a most worthwhile weekend.
However, there is a bit more currently going on in the world than inflation calculations, and better seeing economic reality will be only one part of the weekend.
Long term interest rates have been rising - although they are still well below long term averages. The distortions that have resulted from the Fed using the purchasing power of the money in our bank accounts to suppress long term interest rates have been one of my major areas of analysis and research for many years, and we are going to have a broad set of tools for examining the numerous implications as these distortions are reduced.
There is a name for what is happening, we've been discussing every element for years, and now it has arrived: the Fatal Flaw. The inability to control inflation without raising interest rates to the point where they inflict major bond losses while pulling down stock prices as well. This was a known risk, we've got the tools to understand it and the many implications.
As we explored at the last workshop, the entire banking system and Fed were effectively bankrupt even without commercial lending losses, and as we will explore, the situation has gotten materially worse since then.
The dollar is rising fast, specifically because of the higher interest rates. We've been talking about that for a good while, we have the tools to understand.
Fundamentally, on the most basic terms, the Fed and banking system have each been tightening, reducing their funding of the national debt, even while the Treasury has been issuing new debt at a dizzying pace. This combination has brought back something we have not seen in fifteen years - genuine market forces increasing long term rates, outside of the Fed's short term control of interest rates. All the rules of the 2010s just went out the window, we have a new/old game in town, even as the interest payments on the national debt soar upwards.
Simultaneously, as we've been reviewing in detail for years, the Fed has been effectively subsidizing the housing markets through its massive purchases of MBSs at very low rates, creating a situation for alignment and earning excess profits. The situation has reversed, market forces have returned, and there are major implications for housing investors.
Perhaps the biggest issue of all is the existence and size of the Fed put. The markets had come to believe for years that the Fed could always come up with the money to save them, and that pricing for assumed rescue is still built in.
But, can the Fed "print" the money without triggering much higher inflation? In the last workshop, we established the size of the rescue that the Fed could do without crossing into all new territory, whether we are talking about the attempted rescue of the banking industry, retaking control of long term interest rates, containing a liquidity crisis, attempting to rescue the stock market, or funding new stimulus spending in the event of a recession.
This information is valuable and unique, I have substantially updated it, and we will be using it at the October workshop. As always we will be reviewing the investment implications for all of these issues - including more accurate inflation and economic data - on Sunday.