
Stepping Back From The Chaos: The Coronavirus Cycle Of Crisis In Perspective
By Daniel R. Amerman, CFA
TweetThe United States is currently reeling, as much of the nation shuts down in the attempt to prevent the spread of the coronavirus. We can only hope for the best when it comes to the containment of the medical crisis, and the lives of so many people in the U.S. and around the world.
At the same time, the economic future of the nation - and financial futures of the savers, investors and retirees of the nation - is rapidly changing in multiple ways. One aspect is that a recession has almost certainly already started. How bad it gets depends on what path the nation follows with CORVID-19 over the coming weeks and potentially months. While that path can't be known yet, there is a good chance that the shutdowns will produce a particularly severe recession.
Yes, there is ongoing carnage in the global equities and oil markets as a part of what is happening, but if we step back the daily chaos - major and long term changes are occurring, even if there is a reversal of course for the shutdowns in the coming weeks. Once a national or global recession gets started and much of the economy shuts down - history shows us it takes time to get things going again. We also know that aggressive governmental efforts will be used to aid the process.
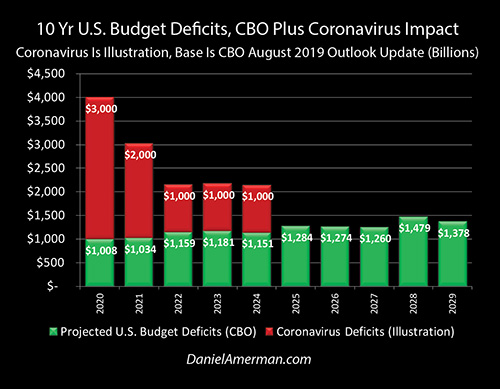
One example of extraordinary and persistent change is the illustration above of what could happen to budget deficits. The green bars are the extraordinary projected budget deficits over the coming ten years - before the crisis. The red bars are one possibility for the cost of the stimulus to contain the economic damage from coronavirus crisis this year and get the nation going again over the next several years. In combination this could quickly double the national debt, sending it over $40 trillion before the year 2030 - meaning a staggering increase even before the peak pressure hits the system when it comes to making maximum Social Security & Medicare payments to the peak number of Boomer retirees.
When it comes to investment prices and financial planning very little is likely to be insulated from what is happening. Stock prices, bond prices, home prices, investment real estate prices, precious metals prices, interest rates, inflation rates and financial stability itself (particularly in Europe) are all in play. This is true not just in the current headlines, but in terms of fundamental changes over the coming months and years.
This analysis is not intended as a critique of the actions that are being taken to contain the spread of CORVID-19 in the United States or elsewhere around the word. There are many lives at stake, and the advantages for human life are enormous when it comes to "flattening the curve", and preventing an overwhelming of the medical system that far outstrips the number of ICU beds and respirators. We are in the early stages, and what lies ahead for the nation in terms of health cannot be known at this time, nor the economic costs.
That said, arguably every element of the financial futures of the savers and investors of the nation are currently in play. We know already that many things have changed, and what many people would have ignored as being "unimaginable" even a few months ago, may be dominant events when it comes to their actual future standard of living and financial security. Four particularly important considerations are briefly analyzed below.
This analysis is part of a series of related analyses, which support a book that is in the process of being written. Some key chapters from the book and an overview of the series are linked here.
Consideration One: Elevated Markets Because Of Very Low Rates
The first and perhaps most important consideration is that the coronavirus economic and market shock is not slamming into normal markets, but quite the reverse. Instead of normality, we had abnormally high asset prices for stocks, bonds and homes that are the result of extraordinary Federal Reserve interventions. Indeed, at this stage and even including stocks, the major asset markets at still at far above historic averages - no fundamental repricing has yet occurred.

As can be seen in the graph above from Chapter One of the book (link here), in order to contain crisis, the Federal Reserve first slammed interest rates down when the tech stock bubble popping resulted in a recession, and then the Fed slammed interest rates all the way down to zero percent to help contain the Financial Crisis of 2008 and the resulting Great Recession.
Going back to the years 1962 to 2000, the average Fed Funds rate was 6.80%, however since 2001 it has averaged only 1.55%. The Fed's actions have helped to reduce average interest rates to less than a quarter, only about 23%, of their long term averages.
I've already got a full length book on the subject, so read the chapter link if you would like the details, but these very low interest rates working at the very foundation level of financial mathematics, raised asset prices across the major asset categories of stocks, bonds and real estate, as can be seen below.
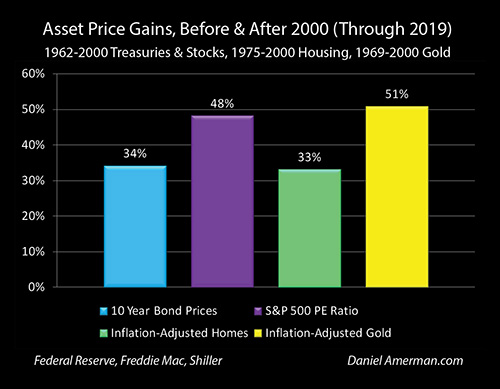
As the entirely rational and expected result of very low interest rates (and explored in the greatest detail in Chapter 11), we have had some of the highest asset prices in history since 2001 - even after including the effects of both prior recessions - and this was particularly true in the latter half of the 2010s.
The issue is that the higher that asset prices go above long term averages, then the greater the losses if we return to long term averages. This could be likened to a form of kinetic energy, the higher a large boulder is pushed up a mountain, the more devastating the damage when the boulder rolls downhill. This is even more true when instead of reaching a plain at the base, that boulder plunges down into a deep valley, such as a return to the depths of the long term averages that are associated with bear markets and deep recessions.
By keeping interest rates so low for so long, the Fed created the energy potential for far greater losses than would usually be expected for stocks, bonds, and real estate. This danger has long been there and was an extraordinarily powerful source of devastating potential market losses that was entirely independent of what has happened with the sudden emergence of the coronavirus pandemic.
In some ways this could be likened to tossing a grenade on top of a case of dynamite. The coronavirus pandemic is the grenade, and what we are seeing now is not just the grenade going off, but also the dynamite that has been set off in terms of abnormally high asset prices that were created by many years of Federal Reserve policies of forcing abnormally low interest rates on the markets. It may look like one explosion - but there are really two explosions. Both "explosions" could be very powerful, and the combined strength - which we have not yet seen - could be extraordinary.
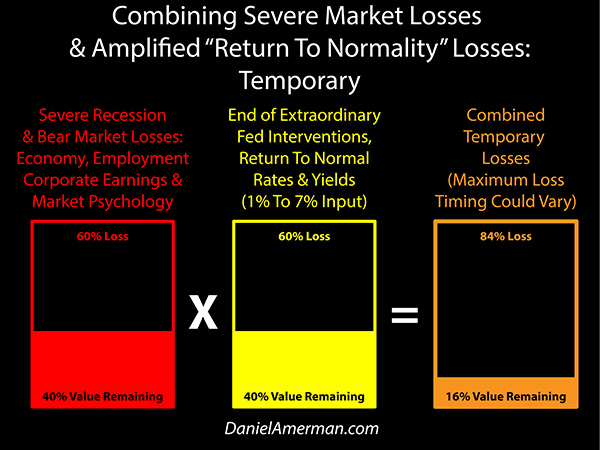
An example graphic that was developed in Chapter 12 is shown above, and while not a forecast, it illustrates the two separate issues. If the coronavirus damage persists and really craters the stock markets, then there could be the red bar on the left and a market bottom somewhere in the range of a 60% price decline within the next 1-2 years - or an inflation-adjusted bottom iover the next 10+ years in a secular bear market. Either would be in the range of possibilities.
Now, if, and it's a big "IF" (there are multiple possibilities), the Fed were to truly lose control in the process, and we went back to ordinary markets, higher inflation and ordinary historical interest rates, then we could get the yellow bar in the middle, particularly on an inflation-adjusted basis. There would be two sources of losses here, the first being the direct impact that the coronavirus would have if it hit a normal market, and the second being the fall from the elevated heights created by extraordinary Federal Reserve interventions.
Critically, the two potential sources of losses are not additive but multiplicative. There is also the issue, as developed in Chapter 12, that while we could hope to fully recover from the stock losses over time (although history shows it could be a long time if it were a secular bear market), there is no particular reason to think that we would recover the losses from the extraordinarily elevated asset prices that existed because of extraordinary Federal Reserve interventions.
Long term bull markets develop their own mythologies, and one of the biggest that was presented by perma-bull cheerleaders in the most recent round was that even if there was a recession, stocks would reliably bounce right back and investors could count on being whole within a couple of years, indeed they could effectively bet their retirements on it, with the downturn representing only a buying opportunity.
This belief is badly, badly mistaken when it comes to actual financial history. Going back to the start of the 20th century, and looking in inflation-adjusted price terms, we have four major and distinct examples of secular bear stock markets, where even ten and more years down the road, investors had not recovered their losses, and they were sometimes still deteriorating. Particularly for a retiree to believe that if stocks go down much more now, that they can somehow reliably count on inflation-adjusted prices bouncing back by 2021 or 2022 (or even 2030), would be a tragic case of misinformation.
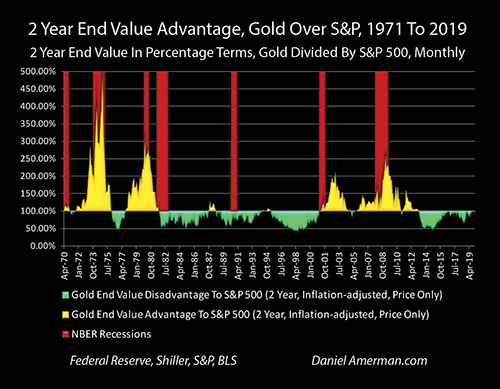
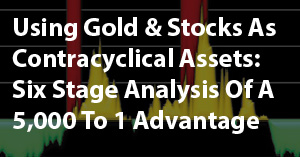
The graph above which looks at the relationship between secular bull and bear markets for stocks and gold (analysis link here) is not quite the same thing, but when we look at the yellow areas where there was a persistent two year rolling advantage to being in the contracyclical asset of gold - those didn't come for a year or two and then disappear, but mostly persisted for a decade or more each time.
Now, as of right now, does that mean that a long term bear market is guaranteed? Not at all, there is are still far too many unknowns when it comes to the economic fundamentals resulting from the still developing pandemic, as well as the types and effectiveness of the economic and market interventions that will be attempted by the Federal Reserve and the U.S. government. But, given what history shows us, the possibility of a true secular bear market in stocks lasting potentially well into the 2030s, particularly given our still elevated price levels (on a long term basis), needs to be given very serious consideration.
Consideration Two: The U.S. Government Will Be Creating By Far The Largest Debt The Nation Has Seen
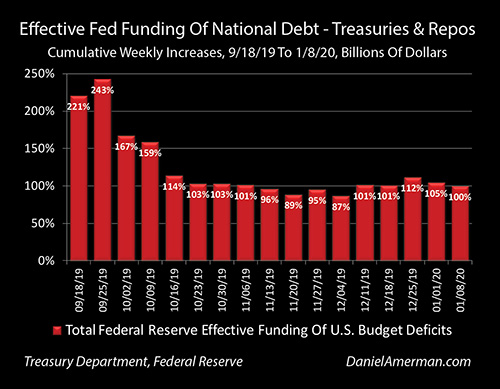
As explored in the analysis linked here, even before the coronavirus reached the United States and Europe, the United States government was already running enormous deficits, and as shown in the red bars above, the Federal Reserve was already effectively creating 100% of the money needed to keep federal government spending funded at rates below what private lenders were willing to lend at.
It was a fantastic situation, something so large and historically unprecedented for a time of peaceful prosperity that it was hard to fully comprehend, even in January. And it is now long obsolete, other than perhaps as a wistful reminder of the days gone by when we still had it easy when it came to deficits and the national debt.
The red bars in the graph above could be called a somewhat conservative illustration of the amount of stimulus spending that may be deployed to try to contain the damage from the shutdown of much of the U.S. economy in the attempt to control the rate of spread of the coronavirus. The green bars start with Congressional Budget Office projections of budget deficits before the coronavirus pandemic, and this starting base is already unprecedented and surreal, with $1+ trillion deficits (assuming prosperity) for each of the next ten years.
The first red bar above shows $3 trillion in stimulus in 2020 - between the combination of increased federal dollars spent and tax reductions. This is $1 trillion above the $2 trillion number that is currently being floated, which was itself $1 trillion above the $1 trillion number being floated the week before. If we look at the extraordinary cost to all the tens of millions of people who have lost work or seen hours slashed, all the millions of small businesses that have shut down or severely cut back, the costs to airlines, hotels, factories, restaurants, bars, dentists, hair stylists, all the loan and mortgage payments that will not be made, and on, and on, and on... let me suggest that $3 trillion in 2020 stimulus spending bringing the total annual deficit over $4 trillion may sound a bit high for March of 2020, but it may not sound high at all for what is being discussed - or implemented - by summer and fall.
This is in some ways happening almost without debate - who is disagreeing?
Beyond that, a fairly rapid ramp-down is assumed, with $2 trillion in stimulus spending above the base previously expected $1 trillion deficit in 2021 (total deficit of $3+ trillion), and a doubling of deficits each of the next three years, with $1 trillion in stimulus spending over and above the previous $1 trillion deficit projections (total deficits of $2+ trillion). Again, this is all a somewhat conservative illustration from a time before the pandemic is contained. It is far too early for better numbers, and in terms of total dollar amount of stimulus spending over five years, it is not all that different from the spending after the 2008 financial crisis, on an inflation-adjusted basis.
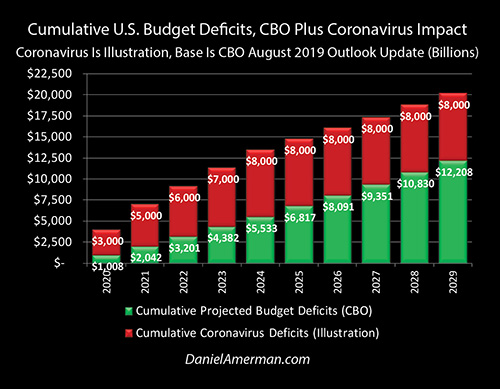
If we run it out on a cumulative basis, then as illustrated above, we would have $7 trillion in new debt by 2023, bringing the national debt over $30 trillion. There would be about $15 trillion in new debt by 2025, bring the total up to over $38 trillion. There would be over $20 trillion in new debt by 2029, meaning the U.S. would enter the 2030s with almost twice the level of debt that it has right now.
This is a very simple illustration, by the way, increasing interest payments on the debt could make it much higher, particularly if the Federal Reserve does lose control.

Again, if we look at the last round, this is not an astonishing projection. The total Federal debt was $8.8 trillion in the first quarter of 2007, and $17.6 trillion by the first quarter of 2014, which was a doubling in seven years. Effectively doubling in ten years is therefore a somewhat slower pace.
It is also worth noting that if we look the slower economic growth rates that are typically associated with nations that have excessively large national debts relative to the size of their economies, then a much higher national debt would be consistent with a potential secular bear market in stocks.
Consideration Three: The Federal Reserve Is Fighting This Cycle Of Crisis With By Far Its Most Extraordinary Interventions Yet
As developed at length in previous chapters in the book, the Federal Reserve is starting this crisis having already depleted its only historically-proven recession fighting tool on the front end. The Fed historically contains recessions by forcing short term interest rates down by an average of 7.25%, as can be seen in the graph below.
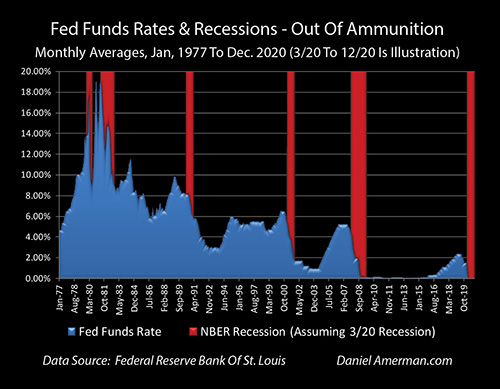
This time around, the ammunition has already all been spent, before the recession has even officially been declared. The graph above illustrates this situation, showing the fall to zero percent which is assumed to persist through the end of 2020 even as the recession is retroactively (which is how this usually happens) declared to have started in March of 2020. The extraordinary and unprecedented lack of firepower on the part of the Fed is boldly, visually obvious. (The graph could also be called somewhat optimistic as it does not include negative interest rates, which depending on the extent of the still developing economic damage, are a very real possibility before 2020 is over.)
This is not a new development - the United States has not once been in normal times since 2001, and particularly since the Financial Crisis of 2008. As I have been writing about for some years, including the current book that was at 18 chapters before the coronavirus hit the headlines, underneath the veneer of normality we have continuously been in a historically unprecedented and fragile situation, where abnormally low interest rates created abnormally high asset prices - with no proven ability to handle another round of recession. All the Fed could do is hope that a normal recession would not come along, because it didn't have the proven tools on hand to handle it - and the Fed knew this very well indeed, every step of the way.
I was not the only one warning about the dangers, and the analysis linked here that I shared with readers in August of 2018, contains the warning and the plea from the (now late) prominent economist Martin Feldstein, former economics advisor to Reagan and president of the National Bureau of Economic Research. Feldstein was urging the Fed to get its ammunition back even at the cost of triggering an ordinary recession and creating a bear market in stocks and commercial real estate, so that much worse losses could be avoided in the event something really bad happened.
Unfortunately, Feldstein was ignored, and the price of ignoring this clear danger to the nation for so long is that we are in much worse shape than we were when Feldstein pleaded for responsibility in his Wall Street Journal editorial. Asset prices are much higher as the inevitable result, and a true doozy of a recessionary event has slammed into the fundamental fragility that was always there, and was always known to be there, but was always too financially or politically inconvenient on a personal basis to fix for the insiders of Wall Street and the federal government.
That an event would emerge that could take down that fragility with potentially devastating lifetime costs for many millions or tens of millions of retirement investors across the nation is no way, shape or form a "Black Swan" event. Instead, the eventual failure of the fragility is the direct opposite as it was plainly visible the whole time, and it was indeed more or less inevitable, given enough time. Now, the specifics that it would be a pandemic (also not a "Black Swan" event) that would do the job, or that it would occur in 2020, could of course not be predicted in advance.
As I have been sharing with readers in previous chapters, because the Fed has known that it was incapable of fulfilling its base responsibilities to the nation all along, it has publicly made a series of plans for the future that include unprecedented and unproven - but massive - monetary and market interventions.
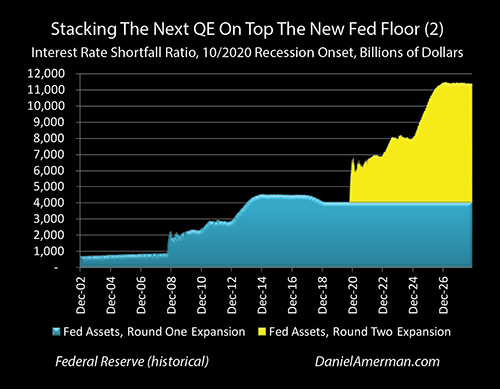
I have previously written about these at length in such chapters as 8, 13, and 14. A short version, that I will expand in later analyses, is that we are likely to see the single largest monetization event in the history of the United States (with a mild version from Chapter 8 illustrated above), and the Federal Reserve will use this money to not only fund the explosive growth in the national debt, but to also create some of the largest and most unnatural price movements that we have ever seen.
Such interventions mean that the coming months could not only include massive losses, but some of the largest and fastest profits ever seen, in the specific investment categories that will be benefit from the firehose of money that the Federal Reserve will be pumping into the system.
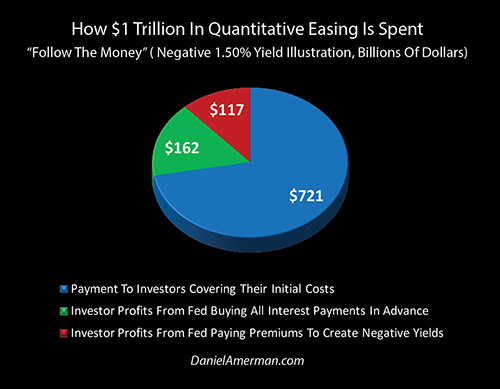
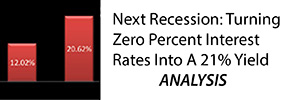
The above graph from Chapter 14 (link here) shows one of the possibilities (developed step by step in chapters 5, 9, 11, 13 and 14), that would be a complete surprise to the average saver and investor, but not a surprise at all to Wall Street and the Fed. While there is no certainty, there is a good chance that the Federal Reserve could join the European Central Bank and the Bank of Japan and use monetary creation to fund the establishment of negative interest rates. "Negative interest rates" sounds pretty bleak - and they are for the average saver - but for those who understand how they work, what it can come down to for longer term securities such as the ten year bond illustrated above, is that the Fed creates trillions of dollars, and uses the money to pump hundreds of billions of dollars of artificial profits into Wall Street and other financial institutions.
In the illustration above, $279 of billion of $1 trillion in new money creation, would be handed straight over as profits to Wall Street and other institutional investors. Now, this is not a closed game, but knowledge is needed to play, and relatively few individual investors have the knowledge to see what is happening in advance.
Wall Street and the big banks heavily profiting during the creation of a fragile environment, that helps to set the stage for a potential national emergency if something goes wrong, that then blindsides millions of unknowing individual investors around the country with massive investment losses when something does go wrong, even while the big banks and Wall Street somehow coincidentally make record sums of money from the desperately needed and unquestioned Federal Reserve cures for the emergency - may sound sadly familiar, even if the specifics are quite different.
But that is what happened the last time around, it was never fixed, there was never personal accountability, and it is quite possible that new versions of the same old insider game will play out even as the ICU beds fill up as a result of the pandemic. (This does not mean anything was planned or intentional in terms of the pandemic - not at all - but that is the way our system happens to be set up, regardless of the source of the crisis.)
The profits from a possible move to negative interest rates are just one example of what will be an extremely powerful and non-random source of profits. The Fed will be engaging in what will be an unprecedented degree of monetary creation to fight the economic impact of the pandemic, that money will be created to be spent, investors in those asset classes where the massive sums of new money is spent will be disproportionately rewarded in ways that have little to do with free markets, even as investors in other asset classes that were at fragile and artificially high levels are penalized in ways that are also not based on free markets or long term financial history.
Consideration Four: The Framework & The Four Way Intersection.
Investment results over the coming months and years, as well as financial security in retirement for the decade ahead, will not be based on the coronavirus alone, but the four way intersection of 1) the pandemic; 2) artificially elevated asset prices coming into 2020; 3) extraordinary Federal Reserve interventions in 2020 and beyond, and 4) a huge increase in government spending funded by an explosive growth in the national debt in 2020 and beyond.
For regular readers, while it has many unique elements, placed in context the coronavirus crisis is the 3rd cycle of crisis, which is still in the early stages of breaking the 2nd cycle of the containment of crisis. The Federal Reserve & U.S. government will be attempting to create a 3rd cycle of the containment of crisis in response, which will be the most extreme yet.

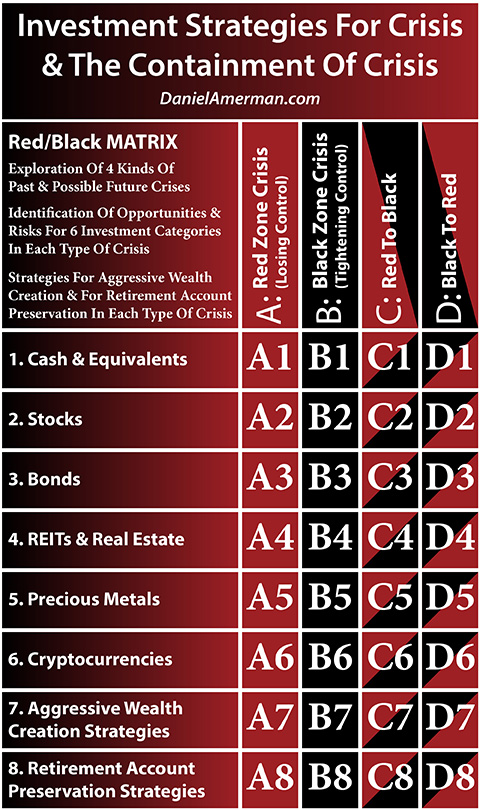
The Red/Black Matrix was in no way specifically set up for the coronavirus pandemic, or with any knowledge that such an event would occur, or that it would happen in 2020. It is not a crystal ball or a means of seeing into the future.
Instead, it is a framework and toolbox for helping to understand what can happen to prices if a new cycle of crisis (from whatever the source) were to hit the elevated asset prices in each row of the matrix, the direct impact during the cycle of crisis, the attempts that would be made by the Fed to contain the crisis, and how those would change investment prices.
An explanatory analysis for the matrix is linked here.
The stages in the cycles are the columns and the individual investment category results in each stage are the rows.
The coronavirus pandemic has moved the United States into the "D" column - Black to Red and the abrupt and major price movements that come when a new round of crisis hits the elevated asset prices and artificial stability that were associated with the previous cycle of the containment of crisis. This impacts each of the six rows of the individual asset classes, as well as the two rows of aggressive combined strategies, and defensive combined strategies.
The Fed and the government will be attempting the "C" column in response - Red to Black, to contain the new Red cycle of crisis, and move back into the Black cycle of the containment of crisis. Should they succeed, we will have two major rounds of price changes, those associated with the crisis itself, and those that happen after the crisis is (possibly) contained.
These double movements will create amplified profits and amplified losses on both sides, D and C (if containment works, otherwise A). Those who miss both sides, caught in the amplified losses while missing the amplified gains could see extraordinary damage. Those who see both sides and catch the amplified gains while dodging the amplified losess could do very well indeed.
The Red/Black Matrix framework doesn't guarantee the results. It is a toolbox for taking artificial markets and artificial interventions, and helping investors to see what is happening, and where the risks and opportunities can be.
I do appreciate the letters from those of you who are currently applying the framework as you seek better personal understanding of what is happening, and am glad you have found it to be so helpful. We are still likely just getting started in the "D" column, and looking at headlines over the last week, it is not just the D2 and A2 cells for stocks that apply, although they certainly do. If you look at the headlines for what is going on with money market funds and the flight to cash, the D1 and A1 cells are also very applicable. Similarly, the differentiation between Treasury bonds, municipal bonds and corporate bonds is also well underway, as discussed in advance in the D3 and A3 matrix cells.
Learn more about the free book.
********************************************
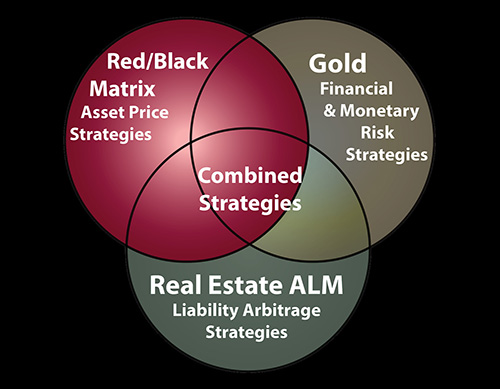
This analysis relates to the Red/Black Matrix group of asset price strategies, which are introduced in the free book, and which are explored in depth in the "Investment Strategies For Cycles of Crisis & The Containment Of Crisis" DVD set (brochure link here).
The Red/Black Matrix strategies are one of the three categories of solutions found in the Triple Strategies solutions sets. More information on all three of the Triple Strategies is available here.