Does The Containment Of Crisis Create Record Investor Wealth?
By Daniel R. Amerman, CFA
TweetThere has been quite a bit of good news lately when it comes to employment and economic growth. Does that mean that we are back in "normal" times, with the problems that followed the 2008 financial crisis now completely behind us?
There is a "truth test" of sorts that is sometimes used in financial analysis and it is called "reversion to the mean". In simple terms, the idea is to test what happens if something returns to its long term historic average.
This could be inflation-adjusted real estate prices or gold prices, it could be stock prices relative to earnings, or it could be interest rates. This type of analysis is particularly useful for identifying outliers, prices or valuation that are far above or far below average, as these are the most likely to have a major correction.
Outliers can create major losses - but they can also create major gains. Indeed, as we will explore herein, there could be new records ahead for stocks, bonds, precious metals and real estate.
This analysis is part of a series of related analyses, an overview of the rest of the series is linked here.
Testing Historically Average Interest Rates
In general terms, the 10 year Treasury is a medium term bond that can be used as a proxy for average interest rates, although the exact relationship changes with the time and the shape of the yield curve. Since 2012, it has been bouncing up and down between about 1.50% and 3.0%, which is a range of around 0.75% above and below the approximately 2.25% average interest rate paid on the U.S. national debt.
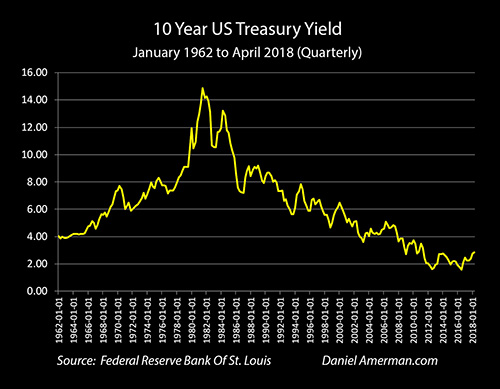
The above is a graph of historical yields on the 10 year U.S. Treasury bond. It has been moving up a bit lately, but is still far below historic averages.
To determine a historic average, we will look at the 36 years between 1962 and 2007 (inclusive). Before 1962 the United States had unusually low interest rates as it tried to cope with the high debts left by paying for World War II (analysis linked here), and by 2008 and thereafter there was another round of unusually low interest rates caused by Federal Reserve policy and quantitative easing.
The first item to note is that there is almost no overlap. By the 3rd quarter of 2008 - the peak of the Financial Crisis - the yield had dropped to 3.23%, and this was lower than any yield in the entire period between 1962 and 2007. There has been a lot of financial chatter about 10 year Treasury yields reaching 3% in 2018, but what needs to be remembered is that 3% is still entirely outside the normal range between 1962 and 2007.
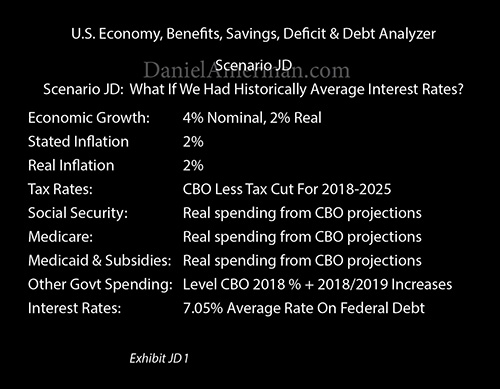
The average yield on the 10 year Treasury between 1962 and 2007 was 7.05%. For our reversion to the mean test - what would happen if current interest rates equaled the historic average?
The graph below shows inflation-adjusted deficits for the United States government under three interest rate scenarios. The blue zone assumes interest rates continue at their current levels. The yellow zone shows deficits if the Federal Reserve continues with its plans to gradually raise interest rates, and those higher interest rates slowly raise average interest costs for the U.S. government as new debt is issued and old debt is rolled over.
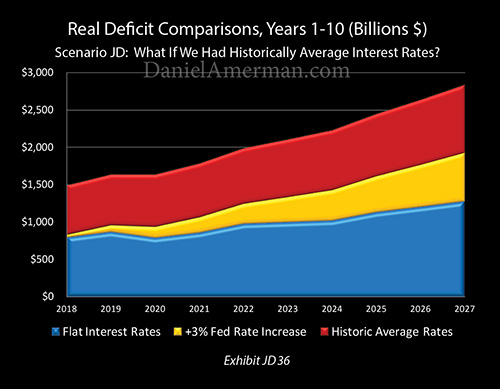
The red zone is our reversion to the mean scenario, our "what if" scenario. As can be clearly seen - if we had historically average interest rates right now, and the average interest rate on the U.S. debt were 7.05%, it would indeed create a financial disaster scenario. Even in inflation-adjusted terms, the deficit would jump to about $1.5 trillion this year, to about $2 trillion per year in 4 years, and to almost $3 trillion per year by 2027.
Yes, we currently have high deficit forecasts, but as is visually obvious above, they are nothing compared to what they would be if we simply had historically average interest rates.
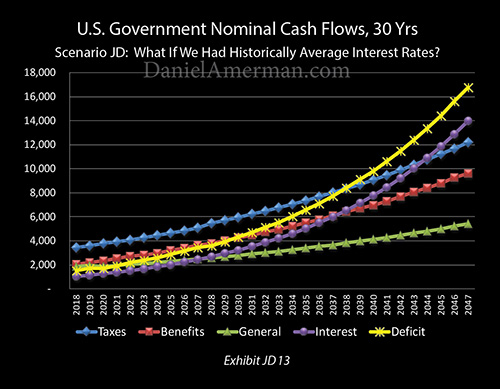
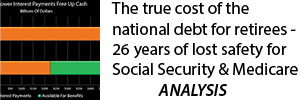
The purple line of interest payments on the debt would explode upwards, bringing up the yellow line of annual deficits along with it. Because compound interest is so powerful at a 7.05% interest rate, interest on the national debt would first pass total general governmental spending (the green line), then spending on Social Security, Medicare & Medicaid (the red line), and would eventually surpass even total tax collections (the blue line).
In nominal terms, deficits would reach about $4 trillion per year by 2029, $6 trillion per year by 2034, almost $10 trillion per year by 2040, and almost $17 trillion per year by 2047.
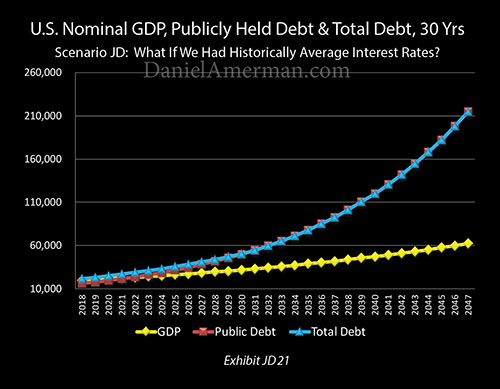
This would set off an exponential increase in the national debt that would drive it up over 10X in the next 30 years, to over $210 trillion and more than 3X the size of the economy at that time.
(These calculations are based on the assumptions above, more information is available in the methodology notes linked here.)
Normality Is An Illusion
The above is a very simple test. If we currently had historically normal interest rates, then we would be inside a financial doomsday loop of sorts, where paying far higher interest payments would create much larger deficits to finance, upon which high interest would also have to paid, until the payment of interest on money borrowed to pay interest would eventually exceed all other governmental spending.
When a simple reversion to the mean creates a financial disaster scenario what that tells us is that we are not in anywhere close to normal times. We do have a $20+ trillion national debt. We are coming into a time of soaring Social Security and Medicare payments. And in that situation, there is simply not room to pay historically average interest rates without triggering a disaster scenario.
Indeed, all that shields us from that disaster scenario is that we are not in normal times - but rather we are still living inside an environment of the containment of crisis.
We are inside of a double "cocoon" of sorts, because interest rates are still abnormally low - indeed they are entirely outside the normal range - as a result of extraordinary Federal Reserve interventions. What is even more important over the next several years is that most of the national debt is still paying interest rates that are based on the post-crisis lows, not current interest rate levels. It is these two layers of crisis containment protection that produce the environment we see today.
Yes, people are right to be concerned about trillion dollar deficits. The unfortunate part, however, is that trillion dollar deficits will be occurring with what are still some of the lowest interest rates on the national debt that we have seen in history. If this truly were normal times, then the situation would be far worse.
A Different Kind Of Binary Risk
In the previous analysis "Binary Risk & The Italian Tempest" (linked here), we looked at market events in Europe, and issues such as liquidity, contagion and a different "doom loop". Those short term market issues in Europe may seem night and day different from the long term borrowing costs of the U.S. government. However, each provides us similar insights, when it comes to how to interpret where we are and where we may be going. As explored in that analysis:
"It is difficult to explain the week if we take the usual "binary" of normal economic times versus financial crises, which could also be called mainstream financial planning versus doom & gloom investing.
However, if we examine events using a different "binary" perspective, that of crisis versus the containment of crisis, then the week makes perfect sense."
If we look at the situation in the United States as being normal economic times versus financial crisis, or mainstream financial planning versus doom & gloom investing - then we are in real trouble.
However, if we use a different binary, and the perspective changes to crisis versus the containment of crisis - then doom and gloom and crisis are no longer inevitable.

We would normally be in crisis now - but we are not, because for ten years after 2008 we have continuously remained in the Black Zone of the containment of crisis. Stock prices, bond prices, real estate prices and precious metals prices are not normal, but are instead quite abnormal specifically because of the containment of crisis.
Indeed, let's extend our reversion to the mean analysis from the U.S. national budget to some popular investment categories.
Where would real estate prices be if 30 year fixed mortgage rates were at a more historically average 8.50% or so? With mortgage payments close to twice as high for any given home price - would home prices be anywhere close to where they are right now? What would happen to the value of your home, and how would that change your net worth?
If investors could get a historically average cash flow of over 7% simply by buying U.S. Treasury bonds - what would that do to the demand for stocks, and the prices people would be willing to pay? Where would dividend yields need to go? Where would the Dow go and the NASDAQ?
Where would REIT and utility stock yields need to go, if they were competing with a 7%+ yield on U.S. Treasury bonds? How far would prices have to fall to deliver that competitive yield level?
Let me suggest that the investment prices and yields that we have been seeing in each of the major asset categories over the last ten years - including today - have in fact not been based on "normality". Instead, a critical component of everything that we are seeing for prices and yields has been continually been based on a something so abnormal that it is completely outside the previous range for normality.
Embracing Reality & Rejecting Pessimism
As much as I enjoy economics and financial mathematics, perhaps the most fascinating part of the investment world is the human psychology side, the perceptions and the beliefs.
We live in an increasingly complex world, and we all deal with it by finding simplifying paradigms that we are comfortable with. We generally love and seek out "confirmation bias" where new evidence emerges which proves that it is our pre-existing beliefs which are true, and perhaps take satisfaction in the knowledge that it is all those other people with different beliefs who are wrong and have obviously always been wrong.
Conversely, conflicting paradigms which contradict confirmation bias are very uncomfortable, and most of us have defensive mechanisms in place to protect against that discomfort. A haze of sorts descends, we quickly categorize the information, perhaps reject it as being illogical nonsense, and move on.
As explored in the analysis linked here:
"The way it is too-often presented is that most savers and investors fall into one of two groups. There is group (A), for those who are for the most part secure in the comfortable Mainstream. They believe that creating wealth through investing is a mostly solved science, and that we can make informed choices today that will quite reliably build substantial wealth over the long-term future because we know what worked in the past – and the future will (implicitly) endlessly repeat the past.
For those who disagree with this, the conventional narrative automatically moves them all the way over to group (B), the "Gloom & Doom" camp. This group is typically presented as being comprised of marginalized, eternal pessimists who are always convinced an economic doomsday is nigh.
So, as the narrative goes, either we (A) buy into the unlimited and more or less guaranteed creation of wealth for all who follow the agreed-upon wisdom, or (B) we reject it, and prepare for the inevitable collapse of the financial system and the value of money."
Viewed from that common binary - this analysis is clearly easy to categorize as falling into group (B), the "Gloom & Doom" camp. There are some downright scary graphs about what would happen to the government if we just had historically average interest rates, and there are some quite disturbing questions about whether the values of all of our investments could be in peril.
This analysis was not, however, written to be "Gloom & Doom", or to fit into that dichotomy. Let's consider three statements about the last ten years.
#1) The Financial Crisis of 2008 and the subsequent Great Recession were the worst that had been experienced in the United States since the end of World War II.
#2) Historically unprecedented actions were taken to contain the damage and reboot the economy, including quantitative easing and the lowest interest rates in modern history.
#3) The stock, bond, precious metals and real estate markets have all achieved record or near record highs at different times over the ten years following the crisis.
Now here's the question - what if #1, #2 and #3 are logically consistent components of a single process? What if the binary is not mainstream versus contrarian, but crisis versus the containment of crisis?
What if (#3) record or near record highs in all the major markets were not in spite of (#1) the Financial Crisis, but were abnormalities that were produced by either the crisis or (#2) the extraordinary efforts that came into existence in order to contain the crisis?
Using this perspective let's revisit the "scary" graphs that are produced by a simple reversion to the mean for interest rates.

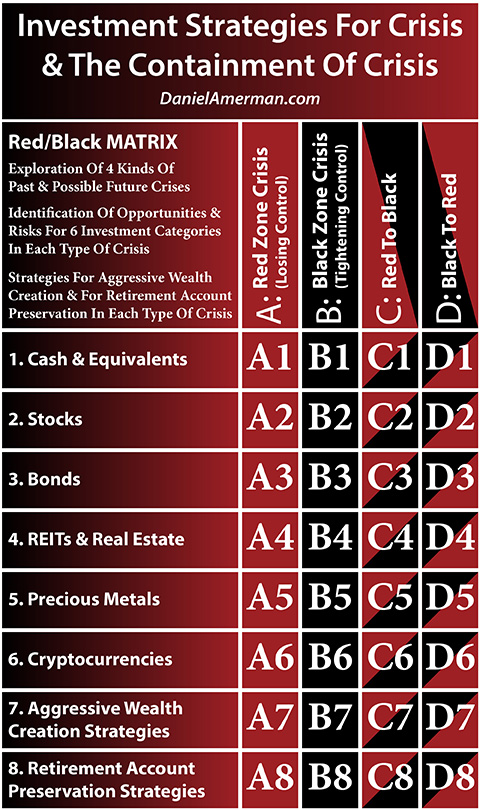
Yes, the red area in the graph above could be a warning about a brewing major Red Zone crisis that could devastate investors while pushing precious metals prices to a new record.
Or alternatively, the red area of potential increased deficits could produce a Black Zone containment of crisis that could lead to the highest stock market values in history, with an extraordinary increase in shareholder wealth along the way.
Or it could be both in sequence, in either order (Red/Black or Black/Red), which would produce the greatest potential losses - or profits - of all.
The purple line of compounding interest at historic average interest rates could indeed lead to a devastating future financial crisis, perhaps something much worse than 2008.
Or it could be that the containment and prevention of the purple line could lead to a record setting bull market in bonds, with the highest prices in history.
Or it could be both in sequence - in either order.
A potential national debt of over $200 trillion could destroy the value of the U.S. dollar, and change the financial status of the United States to that of being a "banana republic".
Or, preventing the national debt from reaching $200 trillion could create the most profitable conditions for buying real estate and REITs that we have seen in our lifetimes.
Or it could be both in sequence - in either order.
The last ten years have included some of the worst financial conditions that most of us have experienced in our lifetimes. The last ten years have also included some of the most profitable market conditions that we have ever seen.
Both are true simultaneously - and there is good reason to think that both could potentially be true in the future. To protect ourselves from the risks and to position ourselves to profit from the opportunities, we have to be able to truly see and understand the logical relationships between crisis, the containment of crisis, and investment price movements in each of the major categories.
*******************************************