
Persistence Of High Inflation Reaches 40 Year Record
By Daniel R. Amerman, CFA
TweetAs measured by the Consumer Price Index (CPI-U), the annualized one month rate of inflation reached 11.93% in October of 2021.
An almost 12% annualized rate of inflation is shocking, but it isn't actually the most dangerous part of what has been happening. Sharp one or two month bursts of inflation do happen every now and then, and they are usually associated with sharp movements in the price of energy or the price of food. These episodes are usually transitory, and they go away with little lasting damage to price levels or ongoing standards of living.
What is far more dangerous than transitory bursts of inflation is persistent inflation. It is persistent inflation that destroys standards of living, particularly in retirement or for those who are saving for retirement. Worst of all is that if it lasts long enough, persistent inflation can become self-sustaining, and can continue to dramatically reduce standards of living and the value of savings long after the original sources of inflation are gone.
As explored in this analysis, the United States is currently experiencing the most persistent rates of high inflation that we have seen in forty years. The sources of this inflation are not being addressed or cured. And when we look at current interest rates, the implications for savers are far worse than they were forty years ago.
This analysis is part of a series of related analyses, which support a book that is in the process of being written. Some key chapters from the book and an overview of the series are linked here.
Seeing Past The Narrative
As explored in my July analysis, "Four Month Inflation Rate Hits 40 Year High" (link here), there was a major change in inflation that occurred in March of 2021. The narrative from the government, the Federal Reserve, and the mainstream media at the time was that:
1) Year on year inflation was the highest in 13 years;
2) The inflation was caused by the rebound from the low prices at the height of the government-ordered pandemic shutdowns; and
3) Because the rebound was a temporary event, the inflation was therefore transitory and would not persist.
The July analysis moved to a four month inflation measure to refute those narrative points, and show that what was happening with inflation was much more dangerous than what we were being told.
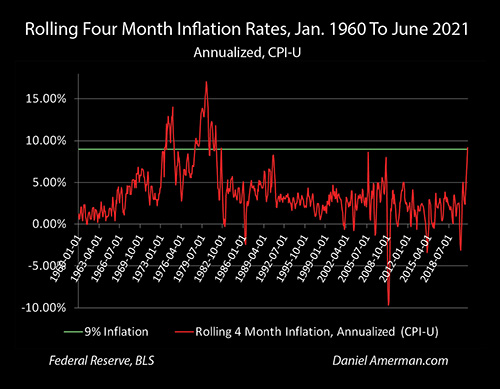
1) By moving to a shorter term inflation measure that nonetheless still included multiple months of data, the four month rate of inflation by June was found to be equal to an annualized 9.18%. This was the highest inflation seen since the great inflation of 1980 and 1981, it was the highest in 40 years instead of the highest in 13 years.
2) The monthly Consumer Price Index had fully recovered by August of 2020, and by 2021 was substantially higher than it had been during the pandemic lows experienced in May of 2020. By moving to a four month measure that was entirely based on 2021 data, the false narrative of the increase in inflation being the result of a rebound from early 2020 pandemic lows was therefore refuted.
3) As explored in more detail in a May analysis (link here), the new surge of inflation was not a rebound from pandemic lows, nor the result of the trillions in money creation by the Fed to fund the national debt (at least not yet), but it was instead a form of supply side inflation. The combination of the government keeping the country "stimulated" with plenty of cash in the face of ongoing supply shortages and supply chain issues, meant that too many dollars were chasing too few goods, which is a literal formula for creating persistent inflation. Their erroneous claims notwithstanding, the Fed does not have the tools to control inflation that is caused by shortages of physical goods, and this type of inflation is likely to persist for as long the underlying problems are still there.
Persistent Inflation In Practice
Six months after this formula for creating supply side inflation was identified, we have indeed seen the resulting six consecutive months of high rates of inflation. Along the way the former three narrative points have pretty much collapsed. Outside of the realm of purely political talking points, there are now substantially fewer claims from the Fed or media about the inflation being brief and transitory, or being entirely the result of a rebound from pandemic lows.
Unfortunately, what has been solidifying since that time is the most persistent - and most dangerous - inflation that we have seen in the last forty years.
After the end of the last major bout of inflation in 1981, the United States later experienced 31 one month rates of inflation that were equal to an annualized rate of 7% or higher. Of those, there were 26 episodes between 1982 and 2020. Each decade from the 1980s through the 2010s experienced at least one transitory month of high inflation - that then failed to persist. Another way of looking at this is that there was an average of an inflationary blip every 18 months.
Long after the economy had fully recovered from the pandemic lows (in CPI terms), in the first 10 months of 2021 there were five one month rates of inflation that exceeded 7% in annualized terms - they were occurring nine times more frequently than they had before in the previous 39 years. That measure may lack the high drama of a one month inflation spike that is near a 12% annual rate, but it is a very bad indicator when it comes to persistent inflation.
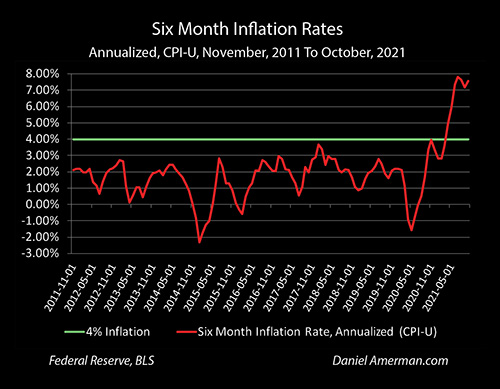
When we use the different but related measure of six month rates of inflation that annualize to 7% or higher rates of inflation - which are a much better measure of persistence than one month measures - then there are a total of only 7 episodes over 39 years.
Five of those episodes occurred in the last five months, with a 7.33% six month rate of inflation through June (annualized), 7.80% through July, 7.63% through August, 7.18% through September and 7.55% through October.
This is by far the most persistent inflation that we have seen since 1981, and as can be seen in the graph above, it is consistently well above more recent rates of inflation. Over the last ten years and before April of 2021, there had not been a single six month rate of inflation above 4%. Since April of 2021, there has not has not been a six month rate of inflation below 4%, with seven consecutive months coming in at 4.95% or higher.
We have passed an inflection point, the financial world has changed, and this change in state has been highly consistent since that time.
Please note that this change in state has occurred regardless of what one believes about the accuracy of U.S. government inflation statistics. As I have been writing about since 2007, the government has enormous incentives to choose inflation calculation methodologies that systematically understate the real rate of inflation. Indeed, the financial solvency of Social Security arguably depends upon the ability to use inflation index manipulation to at least slightly lower retiree standards of living each year, in a cumulative process that becomes much more powerful over the course of a medium to long term retirement.
So, if the real rate of inflation was previously more like 4% to 5% instead of the official 2%, then the current real rate of inflation is more like 9% to 10%+, instead of the official 7%+ calculated using the Consumer Price Index.
The reason that the inflation has been persistent is that the primary sources of inflation have not been addressed, and they have indeed been getting worse.
The government is politically committed to pumping the economy full of money, and it is continuing the programs to do so for political purposes - regardless of the inflationary consequences.
The supply chain shortages have not been addressed, and are persisting.
The shortages of truckers and port bottleneck issues have also not been addressed in substance, and political talking points are turning out to be remarkably ineffective at actually moving the goods through the ports.
What may turn out to be the most important issue of all is the rising cost of energy, as gasoline prices rise in the U.S., while coal is in short supply in China, and natural gas prices are exploding upwards in Europe. These issues are not being solved, and indeed, increasing energy production from traditional sources is being politically removed from consideration. This leaves the alternative of persistent and much higher energy prices as a matter of national and global policy.
As developed in the previously linked analyses, what supply side inflation is based upon is physical shortages that cannot be solved by monetary policies. That inflation can, however, be exacerbated by easy money policies, such as those that the government is currently pursuing.
Persistent Negative Real Returns
As explored in the analysis linked here, however, the current bout of persistent inflation is in some ways much worse than what was experienced in the 1970s and 1980s. In those years, there was something much closer to a free market for interest rates.
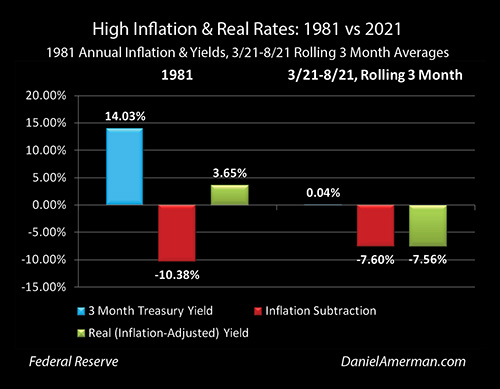
Yes, the average rate of inflation in 1981 was 10.38%. However, even for three month Treasury bills, investors were able to demand an average 14.03% interest return, to compensate them for that high rate of inflation. At least on a pre-tax basis, an investor could stick with the safety of 3 month Treasuries, and still come out ahead by 3.65% per year in terms of real yields, yields that have been adjusted for inflation.
In 2021, the situation is far worse for investors. As referenced in previous analyses, the Federal Reserve has used its greatly expanded powers of reserves-based money creation to keep interest rates forced down to historic lows - even in the face of rising and persistent inflation.
We therefore have government policies creating and feeding persistent high rates of inflation. At the same time, we have government policies making sure that savers and investors do not have any offset to that inflation, or any fair ability to earn higher interest rates to compensate them for the government-induced inflation.
Savers are therefore caught in a vice of the government's making. The value of money is falling by the equivalent of 7.60% annually, as shown in the graph above. The government (in the form of the Fed) is only allowing a 0.04% interest rate to be earned. This locks savers into a negative real yield of 7.56% per year, losing 7.56% of the purchasing power of their money per annum.
So, yes, we are seeing the highest persistent rates of inflation in forty years. But, the difference for savers is that they are over 11% worse off than they would have been in 1981. The difference between a saver coming out 3.65% ahead after inflation, or losing 7.56% after inflation, is an 11.21% swing.
That 11% difference in outcomes is likely to become a persistent rapid destruction of saver wealth, for so long as we have new and high rates of inflation, as well as a heavily indebted federal government that cannot afford to pay market interest rates on what is now close to $30 trillion in national debt.
This could be called a form of financial abuse, or even elder abuse, if one takes into account the life savings for so many millions of older savers that are now being rapidly shredded as a matter of governmental policy. The government, Federal Reserve and mainstream media may not be speaking about what is going on - but the math is there to be seen, in plain sight. Hopefully this and the previous analyses in this series have been helpful in seeing past the prevailing narrative, and instead understanding the mathematical and economic facts of what is being done to us all.
Learn more about the free book.
********************************************
In 2021 we have moved from persistent and high inflation being a theory about the future, to persistent and high inflation being our current reality. The cruel mathematics of what inflation can do to the value of savings and standards of living are now currently in motion, instead of being a possible future threat.
That said - the mathematics of inflation are neutral. The same math can create wealth or destroy wealth with equal ease. A progressive and irresistible destruction of wealth can be turned into a progressive and irresistible creation of wealth.
The book "The Homeowner Wealth Formula" (free first chapter link here) is a unique look at the mathematics of 45 years of inflation, and how to practically turn that inflation into wealth. Based on intense study of 395 historical one to ten year holding periods, the mathematics of turning inflation into wealth turn out to be both highly reliable and often lucrative. There is a very direct relationship - the higher and more persistent the inflation, then the more reliable and the more lucrative the ability to turn inflation into wealth.
Saving and investing during times of high and persistent inflation requires a very different skill set than investing for times of low inflation. Traveling a slow learning curve can be a particularly expensive form of education, as front end losses are increased while front end gains are never realized. Indeed, the more wealth that is lost in the first year or two, and the greater the opportunity costs of the foregone gains, then the harder it is to later compensate.
What "The Homeowner Wealth Formula" provides is an in-depth look at what can be learned by studying almost half a century of low, medium and high rates of inflation, and it explores a proven formula for creating wealth from inflation that is far better learned sooner rather than later.