


Reading Five:
How Millions Turned Inflation Into Wealth:
The Hidden Truth
We’ve been using simplification, exaggeration, highlighted colors and cartoon like “characters” to bring out relationships that elude most people, isolate these relationships, and make them so simple to see that you can’t miss them. These relationships can be harder to see in the real world, for it is not only complex, but almost all we read or hear about what is going on the world around us, generally comes from people who see only through “nominal dollar eyes”. So we can live right through the middle of a vicious, multi-year boxing match – and while everyone will know that Inflation has broken free of its shackles and is in the ring, most people will have no idea of how and why the all blows are landing, or the full details of the massive redistribution of wealth that is going on.
Today we leave theory behind and plunge into some precise historical details about a boxing match that occurred during the 70s and early 80s, when the United States went through its worst inflationary bout in modern history. There were many victims. There were also tens of millions of accidental victors, many of whom are still enjoying the fruits of their victory. These people knew that something good happened. But few understood what really happened.
The next section of today’s reading is excerpted from the second chapter of the book “The Secret Power Within Your Mortgage”. With your increasingly clear inflation vision, it should be quite easy to follow, and you may come out with a different understanding of the financial histories of some of the people you know – possibly even including your own history.
Book Excerpt:
When we look at the financial situation of people of retirement age, people who are currently in their 60s, 70s, and 80s, many of them have something in common. They are, or they were, “house rich”. That is, they became homeowners many years ago, when houses were far more affordable. As an example, the average price of a house in the United States in 1950 was only $7,354. By 1960 the average home price was up to $11,900. By 1970, the average home was all the way up to the dizzying price of $17,000 (2-1).
Some of the most fortunate among these people didn’t move for many years, indeed some are still in the same house they purchased in 1965 or 1970. You likely know someone like this, it could describe your parents, grandparents, aunts or uncles, parents of friends, or perhaps even yourself. Instead of moving, these homeowners paid off their little $6,000, $10,000, or $15,000 mortgage some years ago, after decades of making $50 or $100 mortgage payments. They now own free and clear, with no mortgage, a house that may be worth $100,000, $200,000, or perhaps even $300,000 or more. That house represents the largest asset many retired people have. That valuable house with no mortgage payment is indeed the basis for how many older people are able to enjoy a reasonable lifestyle with social security payments today, something that could be quite difficult if making rent payments, or current mortgage payments.
We can look at this reasonably common situation and say that there are many millions of people of a certain age who were fortunate enough to buy houses when prices were very cheap. That these people have done very well because they bought their houses before inflation had eroded the value of the dollar, and they have been well rewarded financially because of this, as the values of their homes soared.
We would, however, be only partially correct. Unfortunately, this misunderstanding of much of the real source of their wealth could be quite expensive to us, if the years ahead do bring dangers to the long-term value of the United States dollar. Because there is a time-proven financial strategy with a solid historical track record of raising the real (inflation-adjusted) net worths of millions of people. A strategy that thrived the last time the dollar went through a period of major stress. An entire generation of people benefited from their home ownership during a time of protracted inflation, and many of these people are still reaping those financial rewards today. It was not, however, the houses themselves that were the major source of real wealth gained.
To better understand what historically happened, let us consider the example illustrated in Exhibit 2A, of Mike, a fiscally conservative person, who didn't believe in mortgages or other types of borrowings. So when Mike purchased a completely average home in 1972, he paid cash. Which was $18,267, the average value of a home nationally in that year (2-2). When Mike held on to his property for the next 10 years, over a period of significant inflation, his completely average house became worth a nationally average $41,084 by 1982 (2-3). Therefore, it would appear that our fiscally prudent homeowner did very well indeed, as Mike’s house was worth 125% more than what he paid in 1972, meaning a profit of $22,817.
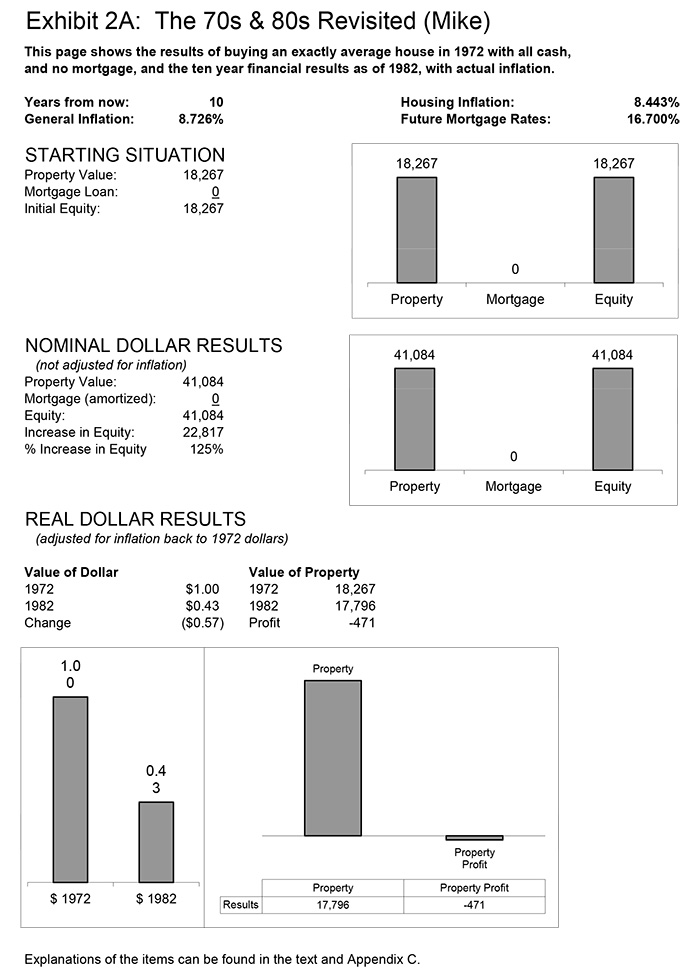
(In later chapters we will move to simple and rounded numbers for discussions. The reason for the precise numbers like “$22,817” in this and the following chapter is that we are exactly following historical averages, the real experience of average homeowners from 1972 to 1982, as documented in the footnotes.)
However, that is not adjusting the profitability of the home investment for inflation. The whole idea here is that we are looking at a time of inflation, and how we can preserve our dollars, or even make money in such an environment. So let's take a look at how Mike did with his home investment in inflation-adjusted terms. As shown in Exhibit 2A, by 1982, the value of a dollar had dropped to 43 cents, compared to the value of a dollar in 1972. Therefore, that $41,084 house in 1982 dollars was only worth $17,796 in 1972 dollar terms. As we can see in this exhibit, since our fiscally cautious homeowner paid $18,267 in 1972, not only did Mike not make any money in real dollar terms – he actually lost $471 in real terms!
While surprising on the surface, this is quite understandable when we think about houses, inflation, mortgage rates and affordability. When we buy an asset that keeps up with inflation, then by definition that is all it does - it keeps up. It doesn't make a profit over and above inflation. For example, if we buy something for $100 this year, inflation raises prices by 100% and the item is worth $200 next year, then on paper we have made a $100 profit. However, since the doubling of price levels means that the dollar is only worth half what it was the year before, we made no profit at all in real terms, we just kept up with inflation (and incurred a major tax liability should we ever sell the item).
Another issue that those who were in the market to buy homes in the 70s and early 80s likely remember well, is that the higher the inflation rate, the higher the mortgage rate, and the more difficult it was to afford a home at any given price. By October of 1981, average mortgage rates peaked at 18.45% (2-4). That was more than 10% higher than mortgage rates in 1972, making homes less affordable for people in general. Because homes were less affordable at higher mortgage rates, this hurt the housing market, and home prices were in fact, not quite able to keep up with inflation. Something that we would do well to keep in mind, if we are concerned about an upcoming period of potentially high inflation.
To better understand the true source of wealth for those millions of homeowners, let's look at someone else, who also bought a completely average house (also for precisely $18,267) in 1972. This homeowner's name was Jim, and Jim was fine with borrowing money when appropriate. So Jim took out a completely average loan and borrowed 80% of the price of his home purchase in the form of a mortgage. This 30-year mortgage, had a fixed interest rate of 7.37%, which was exactly average for that time (2-5). All of this information can be found in Exhibit 2B, The 70s & 80s Revisited, in the “Starting Situation” section. As you can see the difference between the property value and the mortgage loan amount meant that Jim had an equity of $3,653 in his average home.
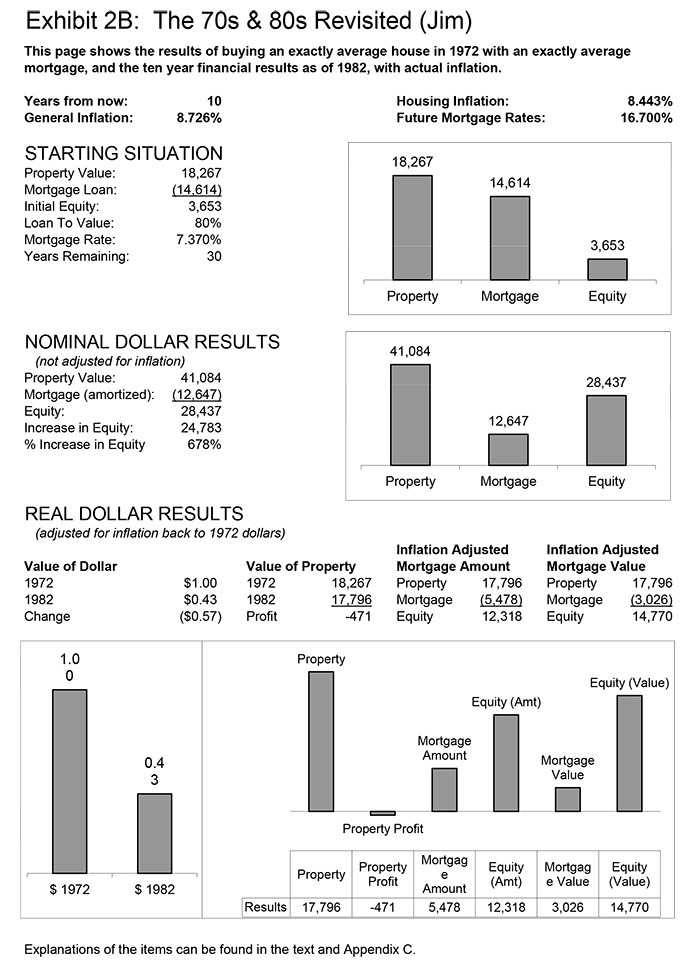
Now, let's move down to the “Nominal Dollar Results” section (“nominal” meaning that the numbers have not been adjusted for inflation). Like Mike, Jim experienced exactly average price
appreciation in his home for a 10-year period, as the value grew from $18,267 to $41,084 by 1982, an increase of $22,817. Comparatively little principal is paid down in the first 10 years of a mortgage amortization, but Jim's payments were sufficient to reduce his principal balance down to $12,647. Comparing the new value of the property to the new mortgage amount, we can see that Jim’s equity has grown from less than $4,000 to almost $30,000 –an increase of close to 700%! This looks great in nominal dollar terms, but will we lose it when we adjust for inflation, like we did with Mike?
To answer this question, we move down to the “Real Dollar Results” section of Exhibit 2B, where all of our dollars are adjusted from 1982, back to their 1972 equivalents. As we can see when we
look at the “Value of Dollar” chart and graph in the lower left section of the exhibit, a 1982 dollar is worth only 43 cents, compared to a 1972 dollar, meaning the dollar lost 57% of its value within a 10 year period. When we look just to the “Value of Property”, Jim's home is identical to Mike's home, in that it did not quite keep up with the rate of inflation. The high mortgage rates averaging over 16% in 1982 kept property prices lower than they otherwise would have been, and Jim actually had a small loss on his house in inflation-adjusted terms.
The first part to the true secret of how so many millions of homeowners benefited from inflation in the past can be found when we look at the “Inflation Adjusted Mortgage Amount". As you can see, when we adjust for inflation, the amount of money that we owe (in 1972 dollars) on the mortgage has fallen to about $5,500. It isn't that the value of the home soared in inflation-adjusted dollars, for it did not even keep even. What did happen for Jim, and so many others is that the inflation-adjusted amount that they owed on their mortgages plummeted. After ten years, Jim still owed $12,647 on the mortgage, out of his original $14,614. But, because the dollar was worth less than half what it had been, it meant that he really owed less than half what he otherwise would have. Inflation wiped out most of what Jim owed over the course of that 10-year period, so Jim never had to pay back what he borrowed in real terms.
That means that in real terms, in 1972 dollars, Jim now had $12,300 in real equity. This represents a huge increase in real (inflation adjusted) equity, when compared to the less than $4,000 that Jim had had only 10 years before. An increase in equity that did not come from the soaring value of Jim's house, which only kept pace with inflation. The increase instead came from the inflation-caused destruction of most of the value of Jim's mortgage. Where Mike lost $471 in real terms by simply owning a house with no debt in a time of sustained and high inflation, Jim made almost $7,000 (after adjusting for the $3,653 in the original equity, and the $1,967 in nominal dollar principal payments.)
If Jim sold his house in 1982, he would have directly collected the benefit at that time. He would have sold for $41,084, paid off the mortgage for $12,647, and walked away with $28,437 in profits (as shown in the nominal dollar results section). Even if Jim did not sell his house, he would still very much benefit from the effects of inflation on his mortgage. Indeed his benefits would be greater if he stayed, just as the greatest historical benefits were enjoyed by the millions of people who bought homes before the inflationary turmoil of the 70s and early 80s, and then stayed in those homes. An estimate of this benefit can be found in the section titled “Inflation Adjusted Mortgage Value” in the lower right corner of Exhibit 2B, and the explanation of these benefits will be the subject of Chapter Three.
(end of book excerpt)
Putting History In The Boxing Ring
On the next page, we take the numbers from 1972 to 1982 for exactly average homeowners, exactly average homes, real inflation, and combine them in our Boxing Ring format. We’re not going to go over the numbers again, as we just did that in book excerpt, we’re going to put them into perspective instead.
We’ve renamed our Glass Jaw, and are now calling it the Savings & Loan industry. The Savings & Loans originated the mortgages, got decked by inflation, and industry wide bankruptcy was the result. This disaster was alleviated only by a combination of “special” accounting rules and a government bailout.
Our right jab – mostly worked, but not quite all the way. Oh, home values appeared to sharply rise, but the average homeowner lost a bit on the real value of their tangible asset, about 3%.
The left hook – was everything. Inflation shredding the value of the mortgages transferred massive amounts of wealth from the savings and loans to mortgage borrowers. As a direct result, the real net worth of millions of families jumped upwards – even as the rest of the economy suffered.
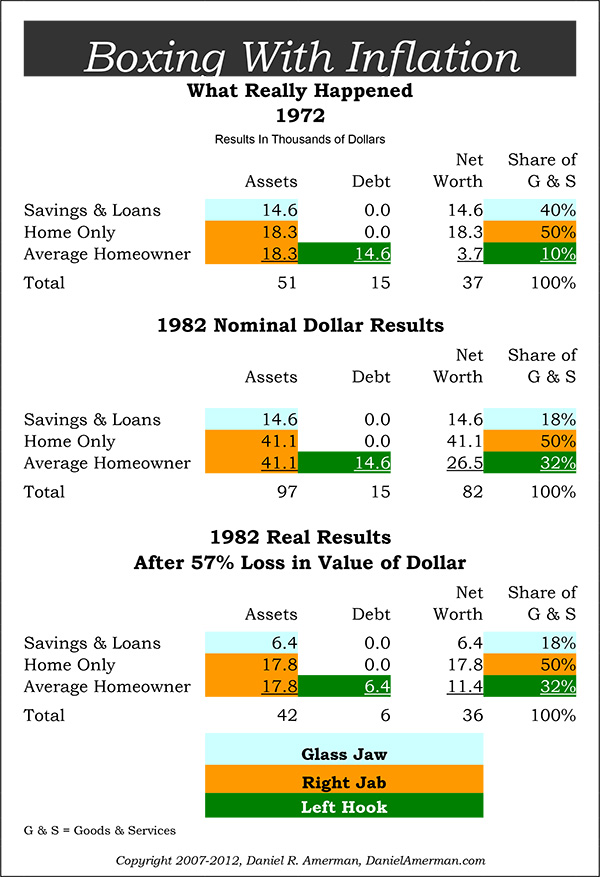
The real world Boxing Bottom line for 1972-1982, when we compare ending purchasing power for goods and services is:
Glass Jaw: Down 57%
Dow Jones (index only): Down 62%
Right Jab Alone: Down 3%
Right Jab + Left Hook: Up 220%
(In June of 1972 the DJIA stood at 929 and exactly ten years later, over a decade where inflation averaged 8.7%, the index was at a level of 812. Adjusting for the dollar losing 57% of its value over those 10 years, that means the index lost 62% of its value over a ten year period, in “real dollar” or purchasing power terms (exclusive of dividends). The total situation was a bit more complicated than we can show using the boxing perspective, but the above is quite close for a look at the principal-only side of the picture. Interim principal payments were accounted for by adding the inflation-adjusted principal ($900) to the ending outstanding loan for both S&L and homeowner. This understates the real value as most principal payments occurred before the full amount of inflation had occurred. However, this is much more than offset when we include the value to the homeowner – and the cost to the S&L – of having a far below market interest rate on a long term mortgage in 1982, as shown in the bottom right column of Exhibit 2B from the excerpt. Including the effects of price changes, interest payments, dividends on the DJIA, taxes – and the inflation adjustments to those four factors – are all important as well, but we’re taking things one step at a time here.)
Limbering Up For The Next Fight
The historical fact is, as we’ve established in today’s reading, when we had a decade of real, powerful inflation in the United States, all of the homeowner’s anti-inflation gain came from their left hook. (The sources of the statistics for inflation, mortgages and home values which we used in the book excerpt and boxing round were the U.S. Census Bureau, the Federal Home Loan Mortgage Corporation, and the U.S. Bureau of Labor Statistics.)
And what a blow that left hook landed. During the exact same decade that the Dow Jones Index lost 62% in inflation-adjusted terms, the housing based net worth of the average middle class homeowner was leaping upwards. Most people, looking through nominal dollar eyes, thought it was primarily the right jab of house appreciation that was doing it, with the left hook of their mortgage acting as a helper through staying in place. Thanks to your reading, you now know the real score: it was letting Inflation shred the values of the debts and the value of the debt payments that delivered all the benefits.
Unfortunately, for the years still to come – having this knowledge puts you in very small minority. The average person is either not aware of the financial battles that are likely on the way, or just crossing their fingers, hoping for the best and following the conventional wisdom. Which involves putting as much of their savings as they can into their glass jaw, and doing their level best to tie their left hand up behind their back, so they will have no left hook at all. Others have plenty large left hooks – but the wrong kind, with adjustable-rate mortgages that may very well destroy them in inflationary times.
Many millions of other people are aware of the dangers on the way, and the tech stock, subprime mortgage debacles and massive monetary creation ("quantitative easing") of recent years have shown these people how fallible the conventional "wisdom” can be when it comes to investing. Unfortunately, even many tangible asset investors have trouble seeing history with anything other than nominal dollar eyes. Which means they are concentrating almost exclusively on their right jabs – for they are boxing blindfolded.
A right jab can be more powerful than the one we’ve illustrated with the average American home. It can involve something like precious metals, where changes in investor psychology can cause prices to rise at a rate well above the rate of inflation. It can involve investing in gold or silver mining stocks that are essentially leveraged plays on the value of the tangible asset. There can be particularly powerful right jabs associated with investing in commercial and rental properties. These property based strategies generate ongoing cash flows to cover the debt payments, deliver tax advantages, and can generate rates of return that climb substantively faster than the rate of inflation. (We’ll be returning to these advantageous strategies which are not based on homes, in later readings.)
The problem is that the more powerful the tangible asset right jab – the more difficult it is to achieve. To have a right jab that is so powerful that it replaces the one-two combination of having two punches, requires both exceptional skills, and likely a good dose of luck as well. On the other hand, the powerful left hook that we’ve just shown was both completely average nationally, and mostly accidental. So an average left hook (particularly a deliberate one) and an average right jab in combination will likely outperform all but the most exceptional of right jabs by themselves. Which strategy sounds more likely to actually deliver superior results for your financial future?
Yet, most tangible asset investors are not even trying to deliberately make use their left hook. Indeed many tangible asset investors manage to combine inflationary fears with fears of their own left hook. They are concerned about the future value of the dollar, so they are doing everything they can to pay off their debts with expensive dollars now, to avoid the risk of inflation causing them to pay with much cheaper dollars in the future.
If A Friend Sent You This Link
If you found this reading because of a friend’s recommendation, then you should know that it is part of a free book on Turning Inflation Into Wealth. Sign-up below if you would like your own copy of this valuable educational resource, delivered via e-mail.

If there is something in this reading that you think a friend or colleague would find helpful, you are encouraged to send them a link to this webpage.
Please DO NOT use the form above to sign up friends without their permission. The book is intended only for people who want it, and have given their permission by signing up for it.
All readings in the book are the exclusive property of Daniel R. Amerman, CFA. Subscribers are allowed to print a single copy for their own usage. Any other copying of materials from these readings and reposting or reprinting elsewhere is strictly prohibited and constitutes a violation of international copyright law. If you would like to share these educational materials with others - please use a link to this website.