


Reading Six:
Boxing With The Future
In our previous reading we went back to the 1970s, which means aspects of that reading may have seemed a bit dated, or perhaps even quaint.
$18,000 for a house?
A whopping $25,000 gain for 10 years of effort?
If those numbers seem too small to be worthy of much time and consideration – that is exactly why you should be giving these materials a lot of consideration. Because not that long ago, $18,000 was an average three bedroom home in the suburbs. The reason the numbers seems quaint is that almost 80% of the value of the dollar has been destroyed since then. Which meant major losses in many people’s savings. Inflation is not an abstract danger – it is our collective past, and quite likely our future.
Today, we will update our example for the current housing market. We’re going to see what happens if an exactly average house is purchased today – and the inflation rates from the 1972-1982 period were to exactly repeat. We will again begin with an excerpt from Chapter Two of “The Secret Power Within Your Mortgage”, which picks up where our last reading left off.
Book Excerpt
Because we are talking about history here, we have been keeping the dollar as constant as possible, in 1972 terms. This does have the side effect of making the dollars involved seem quite small. Intellectually, we may know that what was worth a dollar in 1972 is only worth about 21 cents in 2007 (2-6). However it is difficult to really translate here, to make that jump to just how much more valuable a dollar was in 1972 than today, without looking at a more concrete example. So let us consider Exhibit 2C, the 70s and 80s updated. (Note as well that the average house is considerably larger in 2007 than 1972, so there has been an increase in median value for all houses that is well above just the rate of inflation.)
Here we look at what happens if the same situation that occurred between 1972 and 1982 were to simply repeat itself. That is, we’re not looking at any big disaster scenario here. We’re not saying Peak Oil and the end of a hydrocarbon fuel-based civilization, we’re not saying China economically takes over the world, we’re not saying the retirement of the baby boom devastates the economy, however real those risks may be. Instead, we just assume that the economy goes through, what will look like in historical terms, a hiccup. We get through it on the other side and everything turns out fine. What is the result for our home ownership and mortgage strategy?
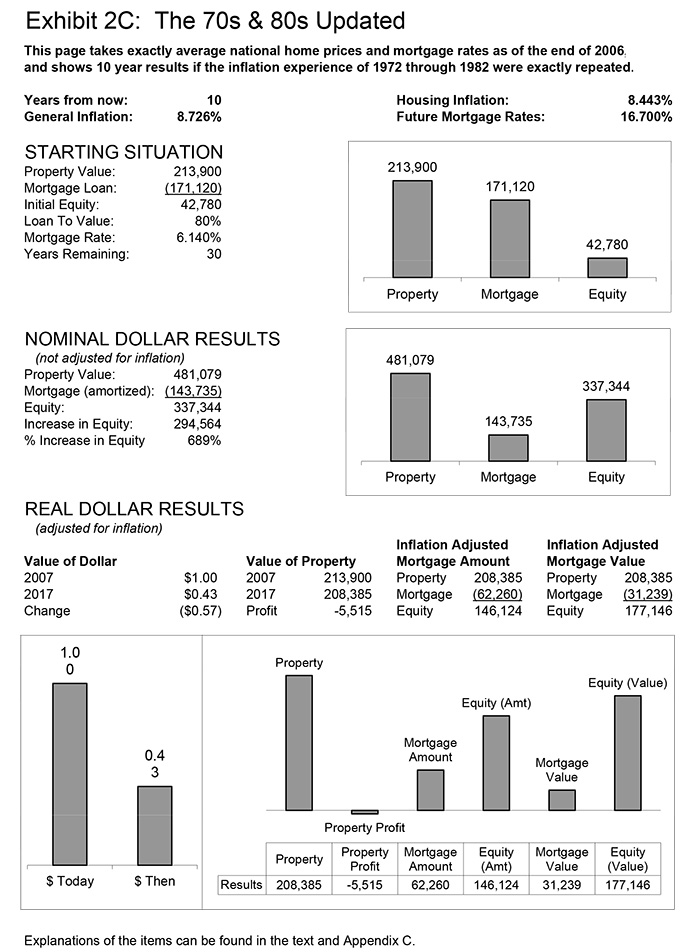
We start with the national median home price of $213,900 from the last quarter of 2005 (2-7). We finance 80% of the price (either purchase or refinance) with an exactly average 30-year fixed-rate mortgage, which means it therefore has a rate of 6.14% (2-8). If you own this average house with this average mortgage, and the hiccup of the early 70s to early 80s repeats itself, then your $43,000 in initial equity will turn into $337,000 over 10 years. A 688% return in nominal, or non-inflation adjusted terms (though $28,000 or so of that benefit, 8%, will come from amortization of the mortgage).
However, much as we saw for Mike’s 1972 example, a substantial increase in mortgage rates means that it could be very difficult for current home prices to keep up with inflation. If the past
were to repeat itself, this would mean that in inflation-adjusted terms, you would actually lose about $5,500 of the value of your home. The source of the $337,000? It is the destruction of the real inflation-adjusted value of the mortgage that you owe, as that mortgage drops to a level of only $62,000 in real dollars by 2017. It is the short of the dollar within the hedge that provides the profit as we will go through in more detail in the chapters to come.
Unfortunately, many millions of Americans turned this relationship upside down in the early 2000s. They bought as much house as they could possibly afford, in the belief that increases in the value of the house would make them wealthy. They financed these homes not with mortgages that would erode in value with inflation, but with mortgages whose payments would soar with inflation, and potentially make them unaffordable. Far too many people have been gambling on an asset that does not have a history of beating inflation, while taking their number one protector against inflation and turning it into something that threatens their personal financial viability in an inflationary environment. Fortunately, as we will discuss in the pages ahead, recognition of the real financial relationships between home and mortgage in an inflationary environment, may yet provide an escape route and even a path to prosperity, for many people currently in this situation.
The perspective presented herein may sound a bit unusual today, but the concept of inflation causing the destruction of the dollar value of mortgages was not the least bit controversial in the 1980s. The lending industry was all too well acquainted with the concept at that time. Indeed, you could say that it dominated the industry for a good decade and more, as hundreds of financial institutions went into insolvency, and thousands more clung to life, relying on special government accounting treatments to stay alive long after the value of their liabilities exceeded their assets.
As a young investment banker in the 1980s, the author participated in the portfolio restructurings of many billions of dollars of what were then known as “underwater” mortgage loans. For years, day after day, I spent my time analyzing portfolios in every state of the country. Whether the client was a little community bank in Montana or a major metropolitan savings and loans in California, every financial institution was carrying portfolios of hundreds, thousands, even tens of thousands of little mortgages. Each of them bearing interest rates that seemed absurdly low.
By the mid to late 1980s when a nice new home in the suburbs was already up to $100,000 with then current interest rates of 11%, 12% and 14%, there were all these little loans still outstanding of $4,000, $10,000, and $20,000; with interest rates of 7%, 8%, sometimes even 6% and below. Compared to even the home prices and mortgage rates of the 1980s, these were almost toy mortgages in comparison.
Yet, the cumulative impact of these many millions of small, low-interest rate mortgages were anything but small for my clients and the rest of the financial industry. Paying 10% and more to borrow money, and having that money invested at 7% in mortgages, locked in annual losses on every one of those mortgages, and could quickly drive a savings and loan into bankruptcy. Sell the loans however, and the huge loss per loan (as a 7% loan might only be sell 60 or 70 cents on the dollar) would even more quickly drive the lender into bankruptcy. This dilemma drove so many savings and loans into bankruptcy that a special government agency, the Resolution Trust Corporation, had to be set up to handle all the dispositions. If we bring the amounts involved forward into current dollars, the savings & loans and banks had a $2 trillion problem as shown in footnote (1-2).
While not the subject of the numerous headlines and congressional hearings caused by the Savings and Loan mortgage debacle, something equally powerful was happening on the other side. For every dollar of loss by the banks and savings and loans – there was a beneficiary. There was someone who was turning the lender’s loss into a dollar of personal gain. Hundreds of millions of dollars of gains for many millions of families.
Yes, something unusual was happening. Something that was rarely remarked upon then, and almost forgotten today. The little guy was actually winning! Every time my colleagues and I looked at a portfolio of a thousand “underwater” mortgages that was on the verge of bankrupting a $100 million financial institution, we were also looking at a thousand individual households, who were enjoying the benefits of being “short” their mortgage during a time of inflation. A thousand real households, with real people like our hypothetical “Jim”, who had borrowed money when mortgage rates were lower, before the inflation fully kicked in. Who borrowed dollars back when they were expensive – and paid the loans back with dollars that became cheap.
We were looking at a thousand families who could recognize a fat profit, anytime they sold their house, with their home equity growing at a rate that was well in excess of the rate of inflation - because inflation had destroyed the value of the money they had borrowed. Even better, was when they didn't sell their home, and the inflation-driven shrinkage of the real cost of their mortgage payments freed up vast amounts of wealth. These homeowners benefited every month they wrote one of those little mortgage payments, that were bankrupting their lenders.
There were thousands of mortgage portfolios like that, from coast to coast, and that means millions of households are still benefiting from them today. Indeed, $2 trillion is perhaps too conservative an estimate for the total compounded benefits that have been realized by so many millions of people. We will explore this in more detail in the following chapter, where we learn how millions of people were able to turn inflation to their advantage, and use it to effectively subsidize their lifestyles for many years – albeit unknowingly in many cases, and perhaps even accidentally.
Boxing With The Future
Next, we will take our numbers from today’s reading, and put them back into the boxing ring. In addition to looking at today’s housing values and mortgage rates, we’re going to make another couple of big changes as well. In our previous examples, we’ve kept the dollar amount of the loan the same between Glass Jaw and Left Hook, to demonstrate the wealth redistribution aspect of inflation. We’ve also kept the same value of the tangible asset investment for both strategies using homes, to clearly show where the gains were and were not coming from. However, this had the effect of meaning the Left Hook investor had much less money invested than either of the others, which tended to make ending results look smaller than they really were.
For our boxing match today, we are going to start with the amount of wealth at risk constant between our three boxers. We’re going to assume that the lender (the Glass Jaw), the equity only real estate investment (the Right Jab), and the homeowner converting Inflation into Wealth (the Right Jab + Left Hook) all start with equal investments of $43,000 each. Which means that they start with equal purchase rights of 33% each in terms of the goods and services they can buy with their investment.
Looking Through Nominal Eyes
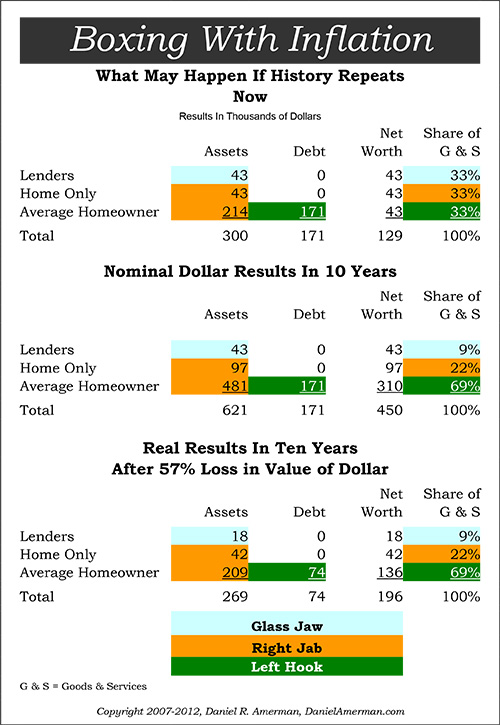
When we look at the nominal dollar results – a blind man could see what happened. The lender stays even at their initial $43,000. The home only investor more than doubles their money, up to $97,000, because their home value rises with inflation. The homeowner with the mortgage controls five times more home than the lender, and the value of their investment jumps to $481,000. Since they still owe $171,000 (we’re not adjusting lender or borrower for principal amortization), their equity has soared to $310,000!
Discerning The Real
When we use our real dollar vision to see not the dollars – but what the dollars will buy – then once again, we can see that our nominal vision has betrayed us, and we truly were seeing what a blind man was seeing. The lender did not maintain value – thanks to their Glass Jaw, their net worth in purchasing power terms plummeted 57% with the dollar, dropping from $43,000 down to $18,000.
The homeowner who used a mortgage to boost up the amount of their real estate investment didn’t produce five times the profit from the home itself – the leverage produced five times the loss, with a real estate (only) loss of $5,000, compared to a $1,000 loss for the investor who paid all cash. The bigger the Right Jab, the bigger the loss, albeit a quite small loss compared to a Glass Jaw Investor.
To find the true source of wealth, we need to look to the $171,000 mortgage that is now worth only $74,000. Because inflation has wiped out $97,000 in the real cost to repay the loan, the Left Hook has delivered in a major way. The net worth of the investor using both a Right Jab and Left Hook has soared, more than tripling in value. The difference between investment strategies becomes particularly dramatic when we compare beginning and ending shares of goods and services – what money will buy for us.
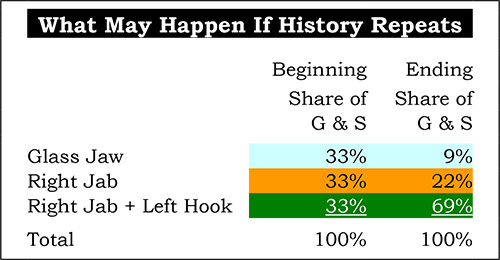
With equal starting investments and a replay of our last major bout of inflation, using our Left Hook leaves us with over seven times the real ending net worth of someone following a conventional Glass Jaw strategy, and more than three times the purchasing power of someone following a tangible asset only strategy.
Will History Repeat?
Probably not. In some ways, the dangers look much worse now than they were in 1972. The Baby Boom was at the opposite end of the job cycle – more members of that largest of generations were leaving their families and colleges for the workforce with each passing year. Indeed, for those who believe that “demography is destiny” it is no coincidence that a generation long surge in the economy and stock market began in the 1980s – the same years that the full Baby Boom reached the job markets. We are now on the precipice of an entirely different demographic change – more people retiring and leaving the workforce than ever before, while collecting more contractually guaranteed benefits than ever seen before. A decrease in the rate of growth in the economy and decrease in the value of the dollar are only two of the many fundamental changes that this will likely trigger. Instead of each year bringing another group of Boomers into the workforce and lifting the economy that much higher – we will be heading the other direction, with the economic growth rate shrinking even as retiree economic demands soar ever upwards, because of another four million Boomer reaching age 65 with each year.
There are other profound changes as well. During the 1970s we hit a temporary supply shock to the system, in the form of the oil embargo. It is this shock in combination with the costs of the Vietnam war, that are often viewed as being the two main sources of the inflation of the 1970s. This time we have oil prices soaring not because of a temporary political situation – but too many people using too much oil, and no end to the problem in sight. We have the enormous costs of the Iraq war to pay for. We have not just the rise of Japan to contend with in the competition for global resources (such as oil), but the rise of China, with India scrambling for its share as well. Each of these powerful forces intersecting and amplifying the generational problems.
This is not to say Doomsday is at hand. The American people are resourceful and resilient. However, major real economic changes tend to lead to major changes in economic symbols and their values as well. There are strong reasons to believe that the oncoming inflation will be far more powerful than we saw in the 1970s, and not so “easily” solved (not that it appeared easy at the time). What this means is that “Glass Jaw” investment strategies may very well fare much worse than a mere 57% drop as in the 1970s.
This also means that the next Left Hook can be much more powerful than the last one. Instead of doubling or tripling or real equity in the strategy, the profits can be much stronger with substantively higher rates of inflation. Some of these profits will accrue to people more or less accidentally, much like happened the last time around. However, the greatest profits from turning inflation into wealth will likely flow through to those who are prepared. Inflation will redistribute the greatest benefits to those who have gained the knowledge to optimize their Left Hook -- and then applied that knowledge.
Further Resources
The Turning Inflation Into Wealth mini-course that you have been reading is a free and self-contained educational asset. There are still a number of the readings to come, and they are intended to provide significant value in and of themselves, with no need to ever buy anything.
That said, the book-length free course also serves as an introduction to a much larger body of work, that has been developed over about a twenty year period. There are workshops, books and DVD learning materials, that go far beyond the base that is established in the initial course. If the readings are resonating with you, and you would like to learn more about this unique and extensive set of educational resources, please click the link below:
If A Friend Sent You This Link
If you found this reading because of a friend’s recommendation, then you should know that it is part of a free book on Turning Inflation Into Wealth. Sign-up below if you would like your own copy of this valuable educational resource, delivered via e-mail.

If there is something in this reading that you think a friend or colleague would find helpful, you are encouraged to send them a link to this webpage.
Please DO NOT use the form above to sign up friends without their permission. The book is intended only for people who want it, and have given their permission by signing up for it.
All readings in the book are the exclusive property of Daniel R. Amerman, CFA. Subscribers are allowed to print a single copy for their own usage. Any other copying of materials from these readings and reposting or reprinting elsewhere is strictly prohibited and constitutes a violation of international copyright law. If you would like to share these educational materials with others - please use a link to this website.