Reading Eight:
Real Investment Tax Rate Is
256% Higher Than Stated
(1972 – 2007, Illustrated)
Overview
Using simple to follow graphs and charts, in this article we will revisit the last 35 years, and show how your true historic tax rate on your investments may have been 256% higher than what appeared on your tax returns. We will then show how the hidden inflation component of taxation will likely grow still higher compared to the nominal tax rate in the years to come, and may reach confiscatory levels where all real investor income and economic growth is taken through taxes, even while nominal tax rates don’t necessarily rise at all.
The Heart Of The Problem
Governments face a basic problem – they want both more taxes and more economic growth. Yet, raise taxes too high and take too much of new economic growth – and the hamsters (that’s us) lose our motivation to keep spinning on our exercise wheels. If we the people are going to innovate, take risks, excel, and work long hours to grow the economy, then we want to enjoy most of the fruits of our labor, rather than passing the increase in the economy on to the government. Similarly, if people are going to defer gratification and take risks to grow the economy through investing their money – they will want to reap most of the returns from those sacrifices and risks. On the face of it, this relationship is the basis for the long debate about the tax rate that is best for increasing total taxes, and whether that rate is higher or lower than current rates.
In the pages below, we will demonstrate that this debate about the nominal tax rate is a distraction from the real issue, and that the government has long used another taxation tool that is of vital importance, but is little understood by most workers and investors. Because the true tax rate is not understood, the government has the ability to effectively confiscate most or all of the fruits of economic growth, even while we hamsters maintain our motivation to keep those exercise wheels spinning furiously, under the illusion we are keeping most of the profits that we generate.
Economic Growth & Investor Profits
Let’s start with some simple assumptions – you are an investor, and you have $100,000 in investment assets. As an investor you provide the capital that makes America grow, and you are an owner of the private economy – indeed, all investors together own most of the non-governmental economy. According to official government statistics, the real growth rate of the economy over the last 35 years has been almost exactly 3% per year, after discounting for inflation. (United States Bureau of Economic Analysis, 3q 1972 to 3 q 2007, http://www.bea.gov/national/xls/gdplev.xls ). As an average owner of the economy then, you could expect that your real return on your investments should be about 3% per year.
A reasonable tax might be to be taxed on the economic growth, which would be the real return on the investment. If you invest, and your investments help the economy grow 3% in real (after-inflation) terms, then your share of the economy and growth is 3% in real terms. For example, if we assume the average investment tax rate (blended long-term, short-term, federal & state) is 25%, then the government takes 25% of the 3% in real economic growth, and you keep 75% of the growth. So, if you have $100,000 invested in the markets, representing your ownership of the American economy, and thanks to your investments and everyone else’s investments, the real economy grows by the historic average of 3%, and that causes the value of your investment to grow by 3% or $3,000, then you pay $750 to the government, and keep $2,250. OK, nobody’s happy with giving up money in taxes, but if everyone does it, that’s a fair way of doing things.
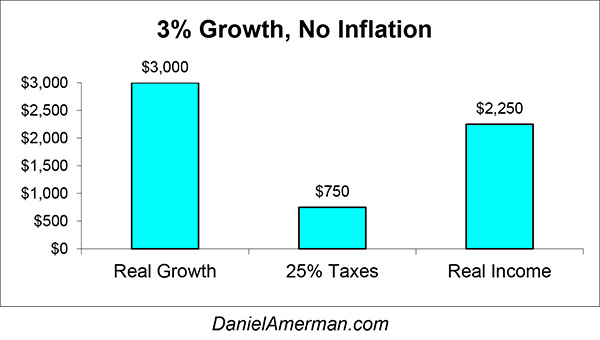
Unfortunately, from the government’s perspective that doesn’t produce nearly enough money. Not enough to pay for today’s government expenditures, let alone the much higher level that will be required in the future to meet Social Security and Medicare promises. What the government would really like is a 60% share, or better yet – a 100% share of new economic growth. However, if the government takes 60% --then because we are only keeping $1,200 instead of $2,100 in the economic growth, we are unlikely to spin that exercise wheel as hard to produce that growth in the first place. If the government is taking all $3,000 – why get on that exercise wheel in the first place, if we won’t get to keep any rewards from our hard work?
“Fortunately”, from the government’s perspective – and tragically, from the investor’s perspective – the government isn’t limited to taxing investors on economic growth. The government’s destruction of the value of money is every bit as taxable as economic growth, and investment taxes on the false income of inflation have been a far larger source of governmental income than taxes on the real income of economic growth.
The True Tax Rate, Illustrated
To illustrate, let’s go back to our 3% real, historic economic growth rate, and add something else – our historic inflation rate. Over the last 35 years, inflation has cumulatively destroyed 80% of the value of the dollar (United States Bureau of Labor Statistics, 9/72 to 9/2007) This 80% destruction of the value of a dollar (meaning a 2007 dollar will only buy what 20 cents did in 1972), is equal to a 4.7% annual drop in the value of a dollar, which is another way of saying our historical inflation rate averaged 4.7%.
If you owned investment assets that generated the same 3% after-inflation return that the overall economy did during those years, then there was really only one way to do so. You had to do the same thing the overall economy did from 1972 to 2007, and grow by a rate of 7.7% per year in total terms. It is a very simple relationship: the economy grows by 7.7% per year in simple (nominal) dollar terms, we subtract 4.7% per year because that is how much of the value of the dollar is being destroyed by inflation, and we are left with 3% real growth. The exact same principle applies to individual investors. You take your starting dollars, add your total returns, subtract how much of the value of your starting dollars was destroyed by inflation, and you are left with your real pre-tax gain (or loss). Not in simple dollars, but in purchasing power, or what those dollars will really buy for you.
Note the above key words “pre-tax”. What happens when we add the effect of taxes to the picture? What we get is the graph below:
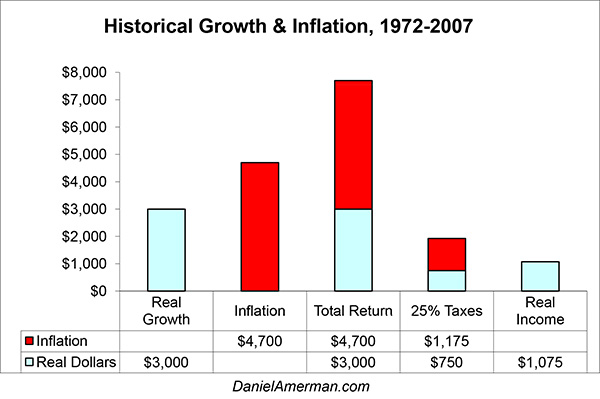
As illustrated above, we take in 3% in real income, add 4.7% in inflation, and we have a total return of 7.7%, or $7,700 in historical income and/or asset appreciation. Take off 25% taxes of $1,925, and we are keeping 75% of the income, or $5,775. Seems straightforward enough, and that is exactly what appears on our tax returns, and in our checking and brokerage accounts. We make a 7.7% rate of return, or $7,700, we keep 75% of that return, and we pay out 25% in taxes to the government. Because we keep 75%, we stay motivated, and we continue to defer our gratification so we can invest and grow the economy. Indeed, we even put in the occasional Saturday down at the office, so we can invest still more as we merrily run along the exercise wheel.
(It is no coincidence that the 7.7% return when we add inflation and real growth together, is not all that far away from a blended stock and bond return over the last 35 years for the average investor, particularly if we adjust for changes in the valuation of growth (P/E ratio)).
Except… that last bar on the right is a bit troubling. Remember, in our first graph, when we started with $3,000 in real economic growth, the government took out their 25%, and we ended up with that nice, tall bar of $2,250 for our 75% share of the real growth in the economy? Well, when we add inflation as actually experienced, we still have $3,000 in real economic growth – but now our share of that growth is only $1,075. Meaning that we are only keeping 36% of economic growth, and the government is taking a full 64% of the real growth in the economy through taxes. This would seem to show that our tax rate on real earnings has been 256% higher than we thought it was for the last 35 years. How could that be when our tax return in every one of those 35 years would have shown quite plainly that we were keeping 75% of what we earned, and the government was only taking 25%?
To explain, we need to keep in mind that the $7,700 total return wasn’t entirely real, and that indeed, the value of what we could buy with our investment only rose by $3,000. The remaining $4,700 wasn’t growth or income at all, but merely keeping up with inflation, keeping up with that steady and never-ending slide in the value of what a dollar will buy. If we remove the real growth component and look at inflation only, then our asset is now worth $104,700, but the dollar is only worth 95 cents, so in real terms, we still have a $100,000 asset.
Yet, while an economist would say our real income was only $3,000, our entirely real taxes are not based on that number. Instead, because the federal tax code is blind to inflation, both our accountant and the federal government would say that we had a full $7,700 in income, all of which was taxable. We must pay $750 in taxes on the $3,000 in real income, pay another $1,175 on what is effectively the inflation caused by the government’s destruction of the dollar, and our total taxes are $1,925. When we take a real $3,000 in income and subtract a real $1,925 in taxes, we are left with only $1,075 in after-inflation and after-tax income.
So when we look not at dollars, but at what dollars will buy – a 25% tax rate means the government took 64% of the economic growth our investments produced, and we quite plainly and unmistakably kept only 36% of the real return on our investment. We see a quite convincing 25% tax rate all around us – in our checkbook, in our tax returns, the newspapers. It is that tax rate that determines our motivation to spin our exercise wheel. Yet, when we start with what we could buy with our investment at the beginning of the year, and compare it to how much our investment will buy at the end of the year – we paid a 64% tax rate.
This may sound a bit theoretical to some people, but this viewpoint isn’t optional or some subjective interpretation – it is the plain truth of what is happening to your investments. If as an owner of the economy, you want a real return of 3%, and inflation is a historically average 4.7%, then you absolutely, categorically, had to earn a 7.7% total return. (We are simplifying a bit by using additive relationships rather than multiplicative, along with some other simplifications, but these don’t change the results. Making simplifications just allows us to bring clarity to the discussion.)
Your “earning” the rate of inflation and adding that to your real rate of return is non-negotiable if you are to achieve the same 3% real rate of return that was occurring in the economy as a whole. If you start with $100,000, and inflation drops 4.7% of the value of your portfolio, and you only earn 3% instead of the total 7.7% -- then you lose 1.7% that year on a pre-tax basis. In other words your dollars lost $4,700 of their value, you only had $3,000 in income, and that is a net loss of $1,700. Until you pay your $900 in taxes on your income, that is, which adds insult to injury and increases your annual purchasing power loss to $2,600.
Obviously, our blended tax rate of 25% over the last 35 years was an assumption, and probably didn’t correspond to your actual tax rate. If you lived in a low tax state and realized most of your income as long-term capital gains, dividends, or municipal bond coupons, then your total tax rate would have likely been lower. If you lived in a high tax state, and turned your portfolio over regularly, or bought corporate bonds, then your all-in marginal tax rate would have likely been higher. However, regardless of your actual tax rate, the relationship between total growth, real growth and inflation means that your real tax rate was likely 256% higher than your nominal tax rate (total growth / real growth = 7.7% / 3% = 256%), as shown in the table below.
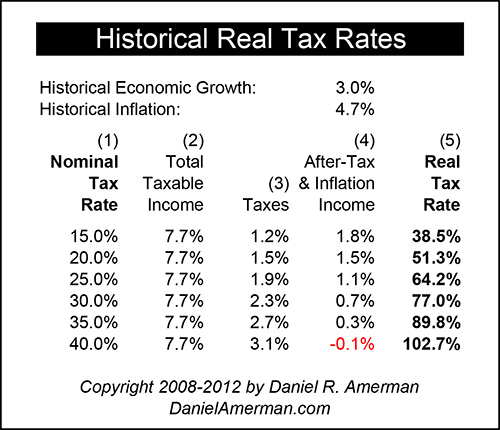
For this table, we have left the inflation and real economic growth rates unchanged at our 35 year historical averages. What we have varied is the nominal tax rate, to account for different individuals being in different tax situations for their investment income. If everything was long-term capital gains, then 15% taxes on 7.7% total income means taxes of 1.2%. Compared to real income (excluding inflation) of 3%, this means that our real tax “bite” was 38.5%, which is 256% greater than the reported tax rate of 15% that appeared on our tax returns.
However, if we change our assumptions to include some income being taxed at short-term or ordinary rates and then add some possible state taxes, then our marginal tax brackets will rise. As we go down column (1), our marginal tax bracket rises in nominal terms from 20%, to 25% to 30%. As this happens, our 256% multiplier (which is specific for a 4.7% inflation rate as part of 7.7% total growth), means that our real tax rate on after-inflation income rises from 51%, to 64%, to 77%. Finally, if we assume that we traded often enough that all income was short-term and that we lived in a high tax state, a 40% nominal tax rate would have translated to a real tax rate of 103%. For 35 years we would have thought that while our taxes were painful at 40%, at least we were keeping 60% -- when in fact our real taxes exceeded our real income for the entire time (a deception that would be disguised by the growth in nominal dollars in our portfolio with inflation.)
If you have been investing for many years, then the odds are good that over that time, you have already paid substantially more in taxes on inflation, than you have paid in taxes on real earnings. You have, in fact, paid more money out in real dollars on the government’s destruction of the value of its own currency, than what you have paid in taxes on your real gains.
Perfection, in other words, from a governmental perspective. For 35 years we hamsters have been spinning our exercise wheels furiously, based upon the belief that we were keeping most of what we produced. A belief that was reinforced every time we looked at our tax returns. Sure, we knew about inflation, but it was more or less an after-thought, maybe an adjustment we might make after we had already calculated our after-tax income. If we explicitly considered inflation at all (unlike the newspapers), then we might have started with 7.7% in total return, paid 1.9% in taxes (25% bracket), and then adjusted our remaining 5.8% after-tax return down by 5% to account for inflation, leaving us with 5.5% in after-inflation and after-tax returns. Or so it goes, when we think of inflation as a footnote, rather than the largest component of total return. (Take note that the reasonable looking methodology above discounts only the effect of inflation on income, while ignoring the far, far larger effects of inflation in reducing the principal value of our investment.)
Now sure, when we stop and think about 3% real growth, we might ask how adding inflation and taxes, each of which reduce our rate of return, could end up having the next effect of increasing our after-tax and after-inflation income from 3% economic growth to 5.1%? But then, who really thinks about it in those terms?
This sleight of hand, this difference between a dollar being a dollar (how we perceive the world) and the ever-changing value of a dollar, (the way the world really is) is the key to hamster motivation. So long as the average investor sees inflation as income, and so long as people view the world in terms of dollars rather than after-tax purchasing power, then the government is free to motivate us hamsters with what looks like attractive incentives, even while helping itself to far more of the real returns than all but a few of us realize.
A Higher Rate Of Inflation
Which then leads to the natural question – if real taxes were 256% higher than stated taxes in the past, could they grow higher still in the future? Unfortunately, the answer is “yes”, for as inflation rates grow higher, then so does the power of the hidden tax. As an example, let’s go back to our combination of a $100,000 investment and a 25% nominal tax rate, but this time we will assume a 15% rate of inflation and drop the real economic growth to 2% (for reasons we will discuss in the next section). As illustrated below, if the inflation rate is 15%, then our total return required to just stay even with inflation, and earn a 2% real economic return, is 17% ($15,000 + $2,000).
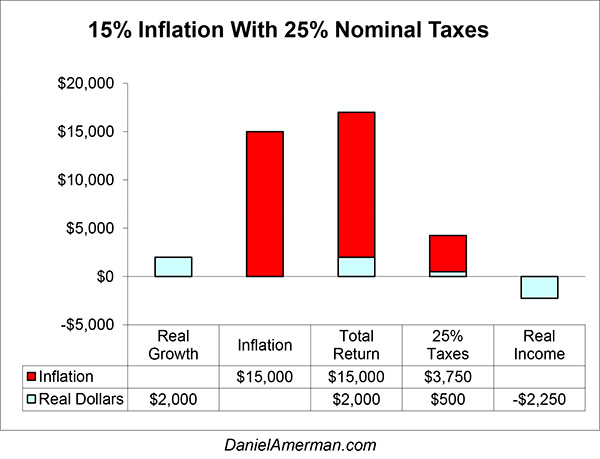
If the tax were based only upon real economic growth, then $500 (25%) of the $2,000 in real income would be taken by the government, and we would come out ahead by $1,500. However, the illusion of income that is necessary just to keep the purchasing power of our investment is every bit as taxable as our share of real economic growth. The value of our $100,000 investment drops $15,000 with 15% inflation, and if we are to stay even with inflation, so we can come out 2% ahead on a pre-tax basis, then we need to earn $15,000. The red “Inflation” bar on the graph is now a towering bar that now dwarfs our real growth. The taxes on that illusory income are also towering, and add $3,750 to our tax burden – a full 7.5X the $500 in taxes on our real income alone. When we add our inflation tax then, we start with $2,000 in real income (economic growth), pay $4,250 to the government in total taxes – and despite earning $17,000 in nominal income, the purchasing power of our investment has dropped by $2,250, after inflation and taxes are both fully incorporated. The government took 100% of our share of economic growth, and took another 113% on top of that, for a total tax rate of a punishing 213%. Effectively, through taxation, the government not only confiscated all of our real income, but also helped itself to part of the starting value of our assets.
The most important thing to keep in mind from a governmental perspective is that we are not alone. This means that for the economy as a whole, the government takes more than the total of all economic growth in taxes, even while maintaining the illusion of taking far less. Sufficiently high inflation rates allow the government to effectively confiscate all economic growth – even while maintaining the façade of every citizen thinking they are keeping 75% of what they earn.
The Full Picture
To fully understand how this relationship may very well be playing out in our of lives over the coming years, consider the chart below, the “Real Tax Rate On Real Earnings”:
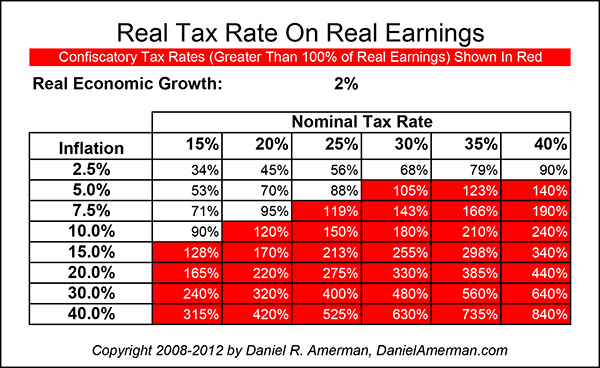
What this chart shows is how much of total economic growth is taken by the government through taxation, under a wide range of assumed tax rates and inflation rates. We have dropped to a 2% economic growth rate – because it is a fairly widely recognized expectation among economists that as our population ages, and we trend down to just two people of working age for each person of retirement age over the next 20 years, that our economic growth rate will also likely fall. Which creates a bit of conundrum for the government – an aging population means more real growth than ever will need be taken through taxes.
Which brings us back to the chart above. The horizontal axis is our nominal tax rate, and the vertical axis is the inflation rate. Each individual entry in the chart shows us what the real tax rate is, and what percentage of real growth and real earnings the government is actually taking for each individual combination of inflation and tax rate. For instance, if we look up 15% inflation and a 25% tax rate, then we see the 213% figure we derived in the previous section. If inflation is 5% and our tax rate is 20% -- then taxes will take 70% of real economic growth, and 70% of our after-inflation individual investment income. If inflation is 20% and our tax rate is 35% -- then taxes will take a full 385% of our real income. The higher the inflation rate, the more money it will look like we are making, and the higher the real taxes we will be paying – but the less money we are actually making.
As you will note, the chart has two different colors – the individual boxes are either white with black type or red with white type. The white boxes represent the tax and inflation combinations where you (and the rest of us) get to keep at least part of the real economic growth our investing creates, much like we have for the last 35 years. So we are paying a much higher rate than we think, but are still at least coming out ahead.
The red boxes show a much worse situation. In each of the red boxes, the government’s effective real tax rate is in excess of 100%. Meaning that not only does the government confiscate all of the real economic growth for the average investor, but it also confiscates some of the starting value of the investor’s assets as well.
Unfortunately, most of the chart is red boxes. Indeed, by the time we hit a 30% marginal combined federal and state tax bracket, all of the boxes are red, so long as the inflation rate is 5% or higher. When we look at 10% and higher rates of inflation – all of the tax brackets lead to red boxes and confiscatory taxes, except the 15% tax bracket, and even that box turns red by the time we reach a 15% rate of inflation.
There is something even more important to look at – and that is the rate of change as we move tax brackets and inflation rates in 5% intervals. Start in the 2.5% inflation row, and as we move from 15% to 30% tax brackets, our real tax rises by 9%, then 11%, then 12%. Now, go to the 15% nominal tax rate column, and move 5 percentage points at a time, from 5% inflation, to 10% inflation, to 15% and 20% inflation. Our real tax rate moves up 47%, then 38%, and then 37%. In other words, a 5 percent change in the rate of inflation is much more effective in increasing the government’s share of the real economy than is a 5 percent increase in tax brackets.
Now, consider the political difference between raising tax rates by 5%, let’s say from 15% to 20%, as opposed to a 5% increase in the inflation rate. An increase in the formal tax rate would mean a huge political battle that could throw individual politicians out of office even as control of Congress or the presidency might shift. People would see more of their money going to the government – and would be less inclined to spin that exercise wheel. On the other hand – how many people even understand that an increase in the inflation rate is an increase in the tax rate? Which means that it could be politically much less damaging. Particularly if the official inflation indexes are manipulated in such a way that the full extent of the increase in inflation rate is not understood by the general public. (Put this reading together my article “Inflation Index Manipulation: Theft By Statistics” (Reading 14) and you may find some useful insights into the years ahead.)


