


Six Layers Of Deficits Mean Retirement Disaster
By Daniel R. Amerman, CFA
Below is the 2nd half of this article, and it begins where the 1st half which is carried on other websites left off. If you would prefer to read (or link) the article in single page form, the private one page version for subscribers can be found here:
Layer 6: Total Obligations Per Non-Retired Household
There is a looping issue with the 97 million above poverty line household approach. This problem is that it includes currently retired households and tens of millions of future retirees making the payments from their retirement benefits in order to fund their own retirement benefits. While this can in theory be done with paper transactions, it isn't part of current law for retirees to make Social Security and Medicare payments.
More fundamentally, this implicit need for retirees to pay for their own government retirement programs doesn't work when it comes down to the governing bottom line of real goods and services. Retirees no longer produce goods and services (at least not to the extent of their working years), therefore it is current workers who produce the goods and services used to support retirement lifestyles. Wonks and pundits can play all sorts of elaborate games for partisan purposes when it comes to where the money will come from in ten or twenty years, but it is precisely those kinds of games that have helped create the current mess.
Because resources can't be manipulated as easily as money, they cut through this game and down to reality. Retirees won't be producing the resources that they will be consuming in retirement, rather those resources will be produced by then current workers, and only the workers in able-to-pay households will be producing enough goods and services to support other people outside of their own households.
Taking this approach, a reasonable estimate is an average of about 79 million non-retired and able to pay households over the coming decades. When we divide $62 trillion in unfunded government obligations by 79 million above poverty line households that are (on average) still working, then we come up with an unfunded obligation of about $785,000 per household.
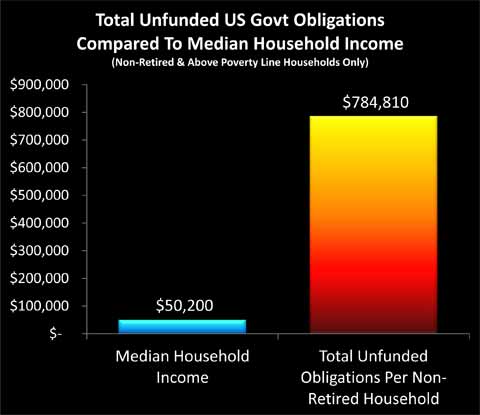
As can be seen in the above graph, unfunded obligations per non-retired household absolutely dwarf the thin blue bar of median household income. When we divide $784,810 by $50,200, we find that total obligations are 1563% of income. The average household has what are effectively five phantom mortgages to repay in addition to their real mortgage. These mortgages are phantom only to the extent that the five additional houses don't exist, but they are entirely real in terms of what we are all obligated to pay.
Your Personal Reality Check
The graph below is a composite of the previous graphs, with each level of per household deficits expressed in percentage terms, relative to our constant comparison of median household income.
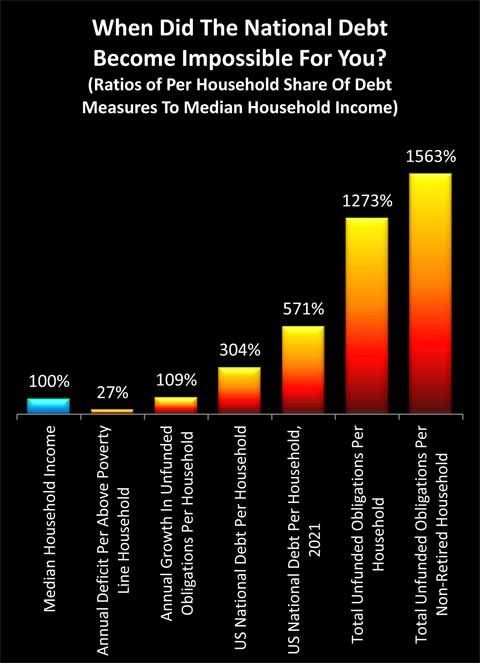
Here is the key question for all of us: at what point did you stop believing that you and your family could pay your share?
Did it take that final jump to over 1500% of the average household income, or did it happen before then?
Were you maxed out when you reached paying one additional "phantom" mortgage in addition to your current real mortgage? Do you believe that the average American household can handle the current national debt at about $150,000 per household - or 300% of the median household income - on top of their real mortgage and everything else?
Or did you begin to completely fail the reasonableness test somewhere between one and two phantom mortgages? In other words, the point of no return was passed somewhere between now and ten years from now?
Or could it be that you looked at your almost $55,000 personal household share of the annual increase in unfunded federal obligations in 2010 and became aware that the point of no return was passed a long time ago, and we are just piling impossibilities on top of impossibilities?
Your answer is vital, because once we accept that the average household doesn't have even a remote chance of paying the national debt on a per household basis, then we have to accept that taxes can’t pay.
Our taxes won't be able to pay for it. Our children's taxes won't be able to pay for it. And if you look at the debt total by 2021 - it becomes ludicrous to believe that it will be our grandchildren who will be paying for this. The problem is too big to be passed down the road a generation or two generations - instead, it will hit much sooner than that.
So, does this mean the US is bankrupt? Actually, no. Long story short, absent political fiascos, nations that can borrow in their own paper currency don’t go bankrupt. Not when they have the alternative of creating trillions of dollars out of thin air at will, Shazaam!, much like the Federal Reserve has been doing ever since 2008.
Covering The Gap
If taxes can’t pay (and it’s ludicrous to think they can), and the US doesn’t declare bankruptcy, then just how do we cover the gap?
Short answer: pay in full, but make the dollar worth five cents. Drops the per household cost for everything from almost $800,000 down to about $40,000. Painful, but manageable over a period of 20-30 years.
We talked about every above poverty line household in the United States paying off the equivalent of five mortgages worth of unfunded government obligations. How can the government possibly do that over the long term, without going into default? When it would appear that there is no possible way for the median household to pay off even one additional mortgage over and above their current household expenses, let alone five additional mortgages?
Very simply, the answer is to make the repayment of mortgages remarkably cheap over time. Pay off every $150,000 mortgage for less than $10,000 in inflation-adjusted terms, and now the taxpayers can realistically pay after all.
Unfortunately, this solution also drops your savings to a value of 5 cents on the dollar. Meaning that the $100,000 in savings you have slowly accumulated over the years - just became effectively worth $5,000. To cover your entire retirement.
History & Retirees
Historically, a collapse in the value of a currency necessarily forces a major redistribution of wealth, and the segment of the population that is most devastated by this seems to always be the same. It’s the retirees, and the people close to retirement. When we look to Germany, when we look to Argentina, when we look to Russia – it is the pensioners who are impoverished more than any other group.
Unfortunately, history is repeating itself again. When we look at the headlines about the destruction of retiree investment values, pension assets and so forth, we're really just seeing the beginning. Because the crisis "solution" that is being chosen, which is creating dollars without the ability to pay for those dollars, essentially represents the annihilation of most of the retirement dreams of the Baby Boom generation, even if that is not yet recognized. There is not an even cost that is being born by society as a whole, rather some segments are bearing much more of the burden than others.
If your peer group (particularly Boomers and older) is headed for disproportionate financial devastation, then happenstance is unlikely to offer a personal way out. Instead, you must take quite deliberate actions to change your personal financial position so that wealth is redistributed to you, rather than away from you.