
Six Layers Of Deficits Mean Retirement Disaster
By Daniel R. Amerman, CFA
There is a common but mistaken belief that the children and grandchildren of older Americans will be the ones who will be paying for today's massive government deficits. In this article we will look at six different layers of the deficit and unfunded government promises and put them into personal, per household terms in order to get to the truth of the matter. This truth is that the deficits are far too large to be repaid by taxpayers decades from now, but will be instead effectively repaid through the destruction of retiree savings and retirement investment portfolios in the coming years.
The value of your checking account, the value of your IRA or Keogh, and the value of all your investments are - and will be - the true source of payment for deficits. The end result could be a 95% reduction in value for all of our savings, retirement and otherwise, as we will illustrate step by step herein.
Layer 1: Annual US Government Deficit
The headline annual budget deficit for the United States government is about $1.3 trillion per year. This is our first layer, and it is a number that is so big that it becomes almost abstract. To better understand the very real and personal implications, we will express it in per household terms, and compare it to our household incomes.
According to the US Census bureau, there are about 113 million households in the US, of which about 16 million are below the poverty line. These 16 million households add to the deficit, they don't help pay for it, so that leaves about 97 million households above the poverty line whose taxes will be repaying government borrowing. On a per able-to-pay household basis, when we take $1.3 trillion, and divide by 97 million able-to-pay households, then each household's share of the government's annual borrowing is about $13,400, as shown in the graph below.
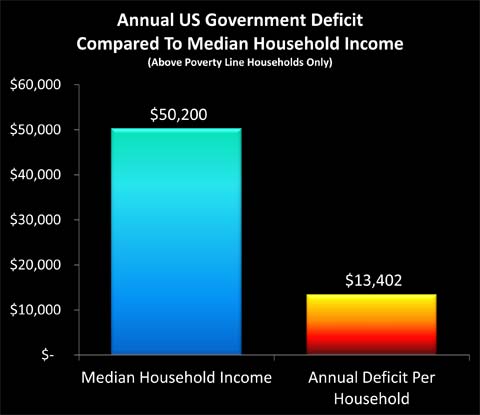
To keep a constant, personal comparison / reality check for the six layers of deficits, each graph has the same blue bar on the left, which is annual median household income of $50,200. The "fire" bar on the right is the particular deficit measure, which for layer one is the annual deficit of $13,402 per above poverty line household.
In other words, your share of the national "credit card" went up by about $13,400 in the last year, on top of whatever else was going on in your household. Your household - and 97 million others - essentially borrowed enough money to buy a new car just in the last year, albeit a quite basic subcompact.
This is a useful perspective when it comes to evaluating budgetary proposals. For instance, let's say someone wants to spend $500 billion in an attempt to improve the economy. Your share of this increased deficit spending comes to about $5,100. This means you are now borrowing enough to buy a 2nd car this year alone, albeit a five to ten year old used vehicle this time, on top of the new car equivalent you are borrowing with just the "normal" deficit. By itself, this doesn't answer the question about whether a $500 billion stimulus is worthwhile - that depends on whether you believe the stimulus will work or not - but it does remove the abstract nature of the question and make the very real and personal cost for each of us easy to evaluate.
Layer 2: Current US Government Debt Outstanding
Every able-to-pay household in the United States borrowing enough to buy a new car in the last year adds up to a whole lot of money - but it wasn't the first or only time that we took out a loan. Far from it, as the federal government has been incurring deficits much more often than not throughout our lifetimes, and deficit spending jumped up to the current fantastic levels of roughly a subcompact car per year about three years ago, when the financial crisis kicked fully into gear.
The total national debt outstanding is currently about $14.8 trillion. When we divide that by 97 million above poverty line households, then the government debt per household works out to a little over $152,000 per household, as shown below.
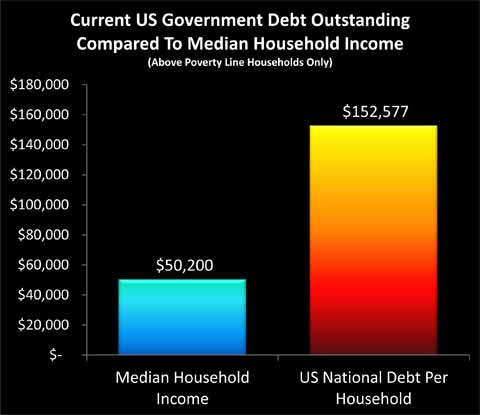
Forget a new car; we all already each owe enough to finance a second home equal to the value of our primary residence. The median value of a single family home in the US as of the first half of 2011 was $171,900 (per the National Association of Realtors), thus each of our households' share of the national debt is equivalent to having a mortgage outstanding at an 89% loan-to-value ratio on an average home.
So in addition to food, utilities, gas, health care payments, taxes and everything else, we also all have to make payments on a second house, even while we borrow enough to pay for a new car each consecutive year. Except that there is no actual house or annual new car to add to the line-up in the driveway, just an insatiable federal government.
Layer 3: US Govt Debt Outstanding In 10 Years
Buying a new car every year - while still making payments on the new cars from each previous year - would seem to be a good way to get in much worse shape and very quickly. If we keep this up - how much trouble will each of our households be in ten years from now?
There are a couple ways of approaching this question. The easy way is political gamesmanship, and making all kinds of assumptions about the future that make the numbers look good, so the politicians can justify the actions they want to take today. The bottom line is that the politicians, wonks and pundits all assume that future politicians will be braver and more disciplined than the current politicians, and will fearlessly make the changes in terms of slashing benefits that today's politicians refuse to do. The government also makes ever freer use of accounting gimmicks / deceptions, which is why the current deficit is reported as "only" $1.3 trillion.
Of even more importance to the projections used by the government is the assumption that economic growth gets right back on track, unemployment plummets, and tax revenues surge over time. Even with these optimistic economic projections, but absent major tax increases or much larger benefits reductions than those proposed in the latest rounds of agreements, the deficit continues right along at about $1.3 trillion per year over the next ten years. So the baseline optimism scenario translates to borrowing the money each year to buy yet another car.
Another way is to take a reality-based approach, and say that the Boomers are aging fast and the economy isn't performing. There are about 77 million Boomers, with an average of another 4 million reaching retirement age each year. Absent major structural cures (i.e. slashing entitlement benefits), the cost of making Social Security and Medicare payments to a rapidly growing retirement age population will create a spiking expense structure for the government.
If we don't assume that this whole unemployment / economic malaise thing goes away, then there won't be the soaring tax revenues that the politicians' economic projections rely upon. This means both higher expenses and lower tax revenues, which then produce a radically higher annual deficit that gets much worse each year. How bad the deficit gets depends on both the economy and politics, but each of our households borrowing enough money to buy an SUV once a year and every year over the next 10 years (on average) is within the range of possibilities.
Each of our households borrowing enough money each and every year to buy another SUV sounds borderline insane, and exploring this subject is depressing enough without adding economic and political pessimism to the mix. So, we will make the optimistic assumption that the deficit stays the same as it is today at about $1.3 trillion per year, or about $13,400 per household. In other words, we'll assume that the economy ends up getting fixed, and politicians set aside partisanship and personal ambitions to do what is right for the nation, making most of the tough choices on both taxes and entitlements that are needed to solve the soaring entitlements problem.
Ten years of deficits at $1.3 trillion per year is $13 trillion in total new deficits. Add that to the $14.8 trillion outstanding today, divide by 97 million above poverty line households, and we get about $286,000 per household, as shown in this next graph.
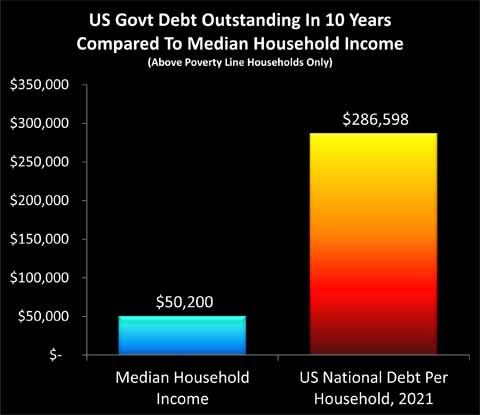
If we take the mortgage we are obligated to pay for today (Layer 3), and add in ten years of annual new subcompact car purchases, then we each end up owing the equivalent of almost two additional mortgages per household in ten years. With the optimistic assumptions about the economy and responsible behavior by politicians, that is.
Layer 4: Total Unfunded Federal Govt Obligations
There are two issues with our "Layer 3" approach of simply carrying forward current deficits into the indefinite future. The first problem is that the retirement entitlement crisis will be growing much worse, because of the simple reality of an aging population. The greater the number of retirees, then the higher the proportion of the population collecting benefits, and the lower the proportion of the population that is working and paying taxes to fund those benefits. Projections are that by the year 2027 the US will be down to two people working for every one person of retirement age, and therefore the 2020s and beyond are likely to produce much greater deficits than what we are seeing in the early 2010s.
The other problem is that deficits are based on governmental accounting, and there is a very different set of rules than the more familiar accounting used by corporations. When a corporation makes a contractual promise to pay in the future, the cost is included today - but when a government makes extraordinarily expensive promises for unfunded future benefit payments, the shortfall is ignored in current deficits.
Government accounting is also subject to numerous levels of manipulation, with most of the purported "benefits" of the last two rounds of deficit "reductions" consisting of loopholes in government accounting standards, with no corresponding real world savings. When 2011 is now officially reported as a $1.3 trillion deficit rather than $1.5 or $1.6 trillion, it is because of the manipulation of loopholes within the bizarre and politically influenced world of governmental accounting.
When we include the rapidly rising health care and Social Security costs of an aging population, and we take the private sector approach of actually including the costs to pay for promises that have been made by politicians - without the funding to pay for them - then a much worse picture of future deficits appears. There are estimates in the $100 to $200 trillion range that have been widely circulated. Those would be too depressing, however, so we are going to use some more optimistic assumptions.
According to a 2011 study by USA Today, total unfunded obligations of the United States federal government are approximately $62 trillion.
When we take $62 trillion in total unfunded federal government obligations, and divide by 97 million above poverty line households, then the total comes to just shy of $640,000 per household, as shown in the graph. This means that each of us is obligated to pay the equivalent of four additional mortgages over the coming decades, over and above our real mortgage and all our other costs and obligations.
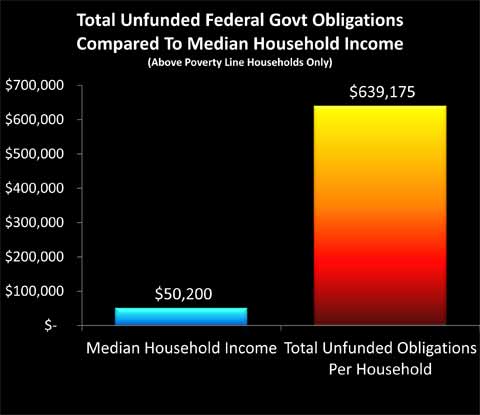
One of the most difficult things to emotionally or intellectually accept about these numbers is that they are the "good" projections. These numbers sound so depressing, that our natural emotional response may be to write them off as just more "gloom 'n doom", and walk away, hoping that things will turn out better. But these aren't pessimistic or from the fringe, rather, the $640,000 per household assumes a healthy economy, and that the government will somehow find methods to deeply slash the rate of growth in medical expenses in the coming years.
Layer 5: Annual Growth In Federal Obligations
Let's return to where we began, and take another look at the annual deficit per able-to-pay household. This time, however, we will step outside the deliberately distorted and bizarre world of government accounting, and simply look at the deficit in the same way that we would for an individual or private corporation.
Per the USA Today study referenced earlier, the annual growth in unfunded federal government obligations was $5.3 trillion in 2010. If we divide $5.3 trillion by 97 million above poverty line households, then the annual growth in the real deficit was almost $55,000. This number is larger than the median household income. Indeed, the annual real deficit in the United States is 109% of median household income.
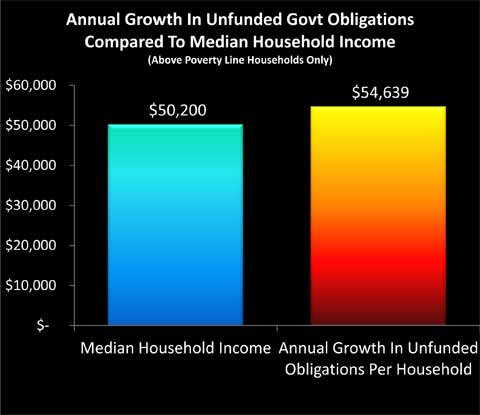
The bottom line is surreal, but it is not difficult to understand or document - just do the simple math. Take the annual growth in unfunded obligations as reported by a major national newspaper. Divide by the number of above poverty line households in the United States, as reported by the Census Bureau. Compare to the median household income, as reported by the Census Bureau.
When compared to the average household, the annual growth in the per household share of unfunded government obligations is indeed equal to 109% of the gross income of that household.
And once again, this is one of the "good" scenarios.
Layer 6: Total Obligations Per Non-Retired Household
There is a looping issue with the 97 million above poverty line household approach. This problem is that it includes currently retired households and tens of millions of future retirees making the payments from their retirement benefits in order to fund their own retirement benefits. While this can in theory be done with paper transactions, it isn't part of current law for retirees to make Social Security and Medicare payments.
More fundamentally, this implicit need for retirees to pay for their own government retirement programs doesn't work when it comes down to the governing bottom line of real goods and services. Retirees no longer produce goods and services (at least not to the extent of their working years), therefore it is current workers who produce the goods and services used to support retirement lifestyles. Wonks and pundits can play all sorts of elaborate games for partisan purposes when it comes to where the money will come from in ten or twenty years, but it is precisely those kinds of games that have helped create the current mess.
Because resources can't be manipulated as easily as money, they cut through this game and down to reality. Retirees won't be producing the resources that they will be consuming in retirement, rather those resources will be produced by then current workers, and only the workers in able-to-pay households will be producing enough goods and services to support other people outside of their own households.
Taking this approach, a reasonable estimate is an average of about 79 million non-retired and able to pay households over the coming decades. When we divide $62 trillion in unfunded government obligations by 79 million above poverty line households that are (on average) still working, then we come up with an unfunded obligation of about $785,000 per household.
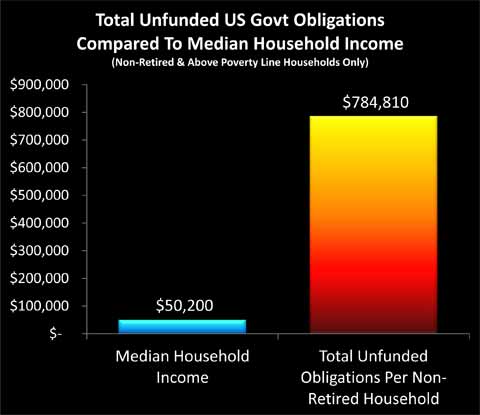
As can be seen in the above graph, unfunded obligations per non-retired household absolutely dwarf the thin blue bar of median household income. When we divide $784,810 by $50,200, we find that total obligations are 1563% of income. The average household has what are effectively five phantom mortgages to repay in addition to their real mortgage. These mortgages are phantom only to the extent that the five additional houses don't exist, but they are entirely real in terms of what we are all obligated to pay.
Your Personal Reality Check
The graph below is a composite of the previous graphs, with each level of per household deficits expressed in percentage terms, relative to our constant comparison of median household income.
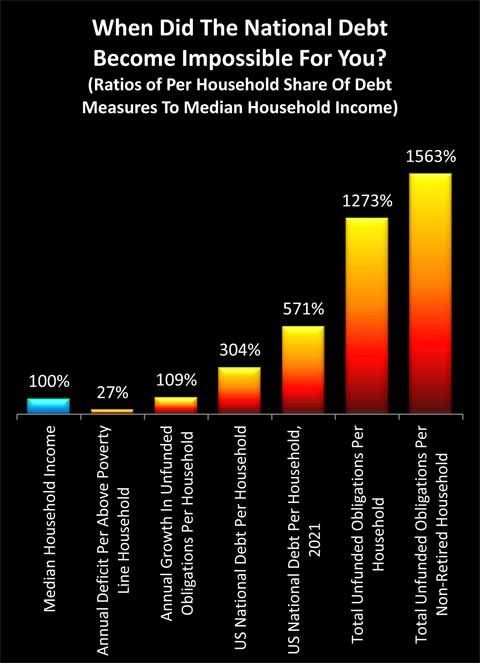
Here is the key question for all of us: at what point did you stop believing that you and your family could pay your share?
Did it take that final jump to over 1500% of the average household income, or did it happen before then?
Were you maxed out when you reached paying one additional "phantom" mortgage in addition to your current real mortgage? Do you believe that the average American household can handle the current national debt at about $150,000 per household - or 300% of the median household income - on top of their real mortgage and everything else?
Or did you begin to completely fail the reasonableness test somewhere between one and two phantom mortgages? In other words, the point of no return was passed somewhere between now and ten years from now?
Or could it be that you looked at your almost $55,000 personal household share of the annual increase in unfunded federal obligations in 2010 and became aware that the point of no return was passed a long time ago, and we are just piling impossibilities on top of impossibilities?
Your answer is vital, because once we accept that the average household doesn't have even a remote chance of paying the national debt on a per household basis, then we have to accept that taxes can’t pay.
Our taxes won't be able to pay for it. Our children's taxes won't be able to pay for it. And if you look at the debt total by 2021 - it becomes ludicrous to believe that it will be our grandchildren who will be paying for this. The problem is too big to be passed down the road a generation or two generations - instead, it will hit much sooner than that.
So, does this mean the US is bankrupt? Actually, no. Long story short, absent political fiascos, nations that can borrow in their own paper currency don’t go bankrupt. Not when they have the alternative of creating trillions of dollars out of thin air at will, Shazaam!, much like the Federal Reserve has been doing ever since 2008.
Covering The Gap
If taxes can’t pay (and it’s ludicrous to think they can), and the US doesn’t declare bankruptcy, then just how do we cover the gap?
Short answer: pay in full, but make the dollar worth five cents. Drops the per household cost for everything from almost $800,000 down to about $40,000. Painful, but manageable over a period of 20-30 years.
We talked about every above poverty line household in the United States paying off the equivalent of five mortgages worth of unfunded government obligations. How can the government possibly do that over the long term, without going into default? When it would appear that there is no possible way for the median household to pay off even one additional mortgage over and above their current household expenses, let alone five additional mortgages?
Very simply, the answer is to make the repayment of mortgages remarkably cheap over time. Pay off every $150,000 mortgage for less than $10,000 in inflation-adjusted terms, and now the taxpayers can realistically pay after all.
Unfortunately, this solution also drops your savings to a value of 5 cents on the dollar. Meaning that the $100,000 in savings you have slowly accumulated over the years - just became effectively worth $5,000. To cover your entire retirement.
History & Retirees
Historically, a collapse in the value of a currency necessarily forces a major redistribution of wealth, and the segment of the population that is most devastated by this seems to always be the same. It’s the retirees, and the people close to retirement. When we look to Germany, when we look to Argentina, when we look to Russia – it is the pensioners who are impoverished more than any other group.
Unfortunately, history is repeating itself again. When we look at the headlines about the destruction of retiree investment values, pension assets and so forth, we're really just seeing the beginning. Because the crisis "solution" that is being chosen, which is creating dollars without the ability to pay for those dollars, essentially represents the annihilation of most of the retirement dreams of the Baby Boom generation, even if that is not yet recognized. There is not an even cost that is being born by society as a whole, rather some segments are bearing much more of the burden than others.
If your peer group (particularly Boomers and older) is headed for disproportionate financial devastation, then happenstance is unlikely to offer a personal way out. Instead, you must take quite deliberate actions to change your personal financial position so that wealth is redistributed to you, rather than away from you.
 What you have just read is an "eye-opener" about just one of the ways in which a rapidly shifting world is removing the foundations beneath conventional investing - even while most investors continue to follow the traditional strategies, unware of just how much the financial playing field has changed.
 A personal retirement "eye-opener" linked here shows how the government's actions to reduce interest payments on the national debt can reduce retirement investment wealth accumulation by 95% over thirty years, and how the government is reducing standards of living for those already retired by almost 50%.
 An "eye-opener" tutorial of a quite different kind is linked here, and it shows how governments use inflation and the tax code to take wealth from unknowing precious metals investors, so that the higher inflation goes, and the higher precious metals prices climb - the more of the investor's net worth ends up with the government.
 Another "eye-opener" tutorial is linked here, and it shows how governments can use the 1-2 combination of their control over both interest rates and inflation to take wealth from unsuspecting private savers in order to pay down massive public debts.

If you find these "eye-openers" to be interesting and useful, there is an entire free book of them available here, including many that are only in the book. The advantage to the book is that the tutorials can build on each other, so that in combination we can find ways of defending ourselves, and even learn how to position ourselves to benefit from the hidden redistributions of wealth.