


Deadly Dow 36,000 & The Secret History Of A 70% Market Loss
By Daniel R. Amerman, CFA
Some investors fear that the Dow may go to 4,000 or 5,000. Surely that would be bad, but there is a worse possibility to consider, which is that the Dow could go to 36,000 instead. Now, Dow 36,000 may sound like a "problem" that most investors would love to have! So what's the danger?
To demonstrate why Dow 36,000 could be a nightmare scenario, we will begin with a review of how 70% of stock investor wealth was annihilated the last time the US endured the combination of sustained high unemployment and high rates of monetary inflation. Using a series of simple steps, we will pierce through the generally accepted but false narrative about that market, and show how even with an assumption of "perfect" market timing - that is, buying on the best single day over a near 12 period, and selling on the best single day over an almost 10 year period - that the historical end result was still crippling investor losses, caused by three distinct wealth-destroying forces.
We will then move to today's financial world, and show how the little understood interplay between these same three deadly wealth destroyers could create the glittering illusion of wealth that would be Dow 36,000 - even while wiping out 80% of real investment values.
How Inflation Hid A 70% Market Loss: 1968-1982
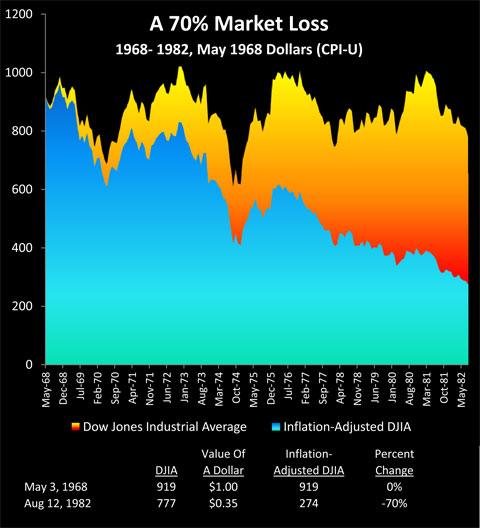
History has already shown us what can happen to long term investment returns when persistent high inflation collides with stubborn high unemployment, resulting in stagflation. Consider the graph below. As shown in yellow, the Dow Jones Industrial Average reached 919 in May of 1968, and by August of 1982, had fallen to a level of 777, for a loss of 15%.
Many investors recall a previous "Lost Decade" for the stock market when the market stayed flat to somewhat down, moving sideways but never persistently up, and what is seen in yellow is consistent with that market perception.
Except - a 15% loss in a long-term sideways market isn't what happened at all, not when we look at what a dollar would buy. That is, a US dollar in 1982 was only worth 35 cents compared to what it would have bought in 1968, because the dollar had lost 65% of its value to inflation.
As shown in blue in the graph, when we adjust the August, 1982 Dow index of 777 to account for a dollar being worth 35 cents, then the real value of the Dow drops to 274. So when we consider the purchasing power of the dollar, then our stock portfolio wasn't remotely close to flat, but rather had dropped by a staggering 70% in fourteen years, from 919 to 274.
This 70% decline in the value of what our assets would buy for us was entirely real, but to this day, many of us don't realize just how bad it was - because inflation in prices was hiding deflation in investment values. The 65% plunge in the value of the dollar "hid" the great majority of the 70% plunge in the value of stocks, with most of the surface value of the Dow index by 1982 consisting of dollars that were worth far less than what they had been before.
Three False Peaks & Inflation Hiding Deflation
Even though long-term asset deflation of 70% (in real terms) was the result of the last time we had persistent high unemployment coupled with inflation, many investors and newspaper readers of a certain age may not remember the 1970s that way at all. Instead they may recall three powerful bull markets when the Dow repeatedly flirted with the "magical" 1,000 mark. Each surge filled innumerable financial columns with the hopes that the good times and a long term bull market had returned again, with those hopes being quickly dashed as the market repeatedly proved unable to sustain itself above the 1,000 level.
The reality is that there never were three bull markets, but rather only an inflationary illusion fooling the public. Indeed when we look closely, instead of seeing three peaks, we will see three historical object lessons in how destroying the value of money can hide the destruction of the value of assets - and repeatedly fool the headline writers along with much of the investing public.
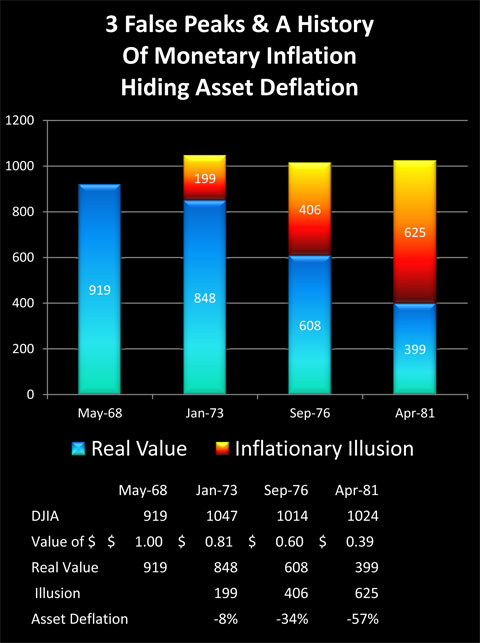
The cold reality of the Dow adjusted for inflation is shown in blue. There aren't three interim peaks, but merely a market moving steadily and powerfully down.
The "bull market" that peaked in January of 1973 when the Dow hit 1,047 - was in a reality a fall to Dow 848 (asset deflation in inflation-adjusted terms), that was masked by the dollar being worth only 81 cents when compared to May of 1968 (monetary inflation). Inflation had created an almost 200 point illusion in the Dow.
The "bull market" that peaked in September of 1976 at 1,014, really represented the Dow falling by over 300 points - translating to asset deflation of 34% - which was hidden from savers by the illusory profit created as a result of the dollar dropping in value by 40% (monetary inflation).
The cruelest illusion of all was the "bull market" of April of 1981, when the Dow finally reached 1,024. Because the real value of the market had fallen to 399, and a 57% destruction of the purchasing power of investor assets was being entirely hidden by the 61% destruction of the value of investor dollars.
Fully understanding this relationship of simultaneous monetary inflation and asset deflation is absolutely essential for financial survival, because there is a very good chance that we may all be seeing the greatest "bull market" in stocks that we have ever seen in the years ahead.
(We will use "monetary inflation" interchangeably with "price inflation" herein.)
Three Wealth Destroyers vs "Perfect Timing"
In my opinion, the greatest threat to long-term and retirement investors is the wealth-destroying triple combination of monetary inflation, asset deflation, and inflation taxes.
One of the most common investor approaches to a truly difficult market is to attempt to "outrun" the problems. Just make better decisions than the rest of the public, and make so much money that the problems can be overcome and wealth kept intact.
How well does that work in practice and just how good do you (or your financial advisor) have to be?
To answer that question, we will go back in history and assume that through the use of a time machine (or peerless skill, or uncanny luck) we did a perfect job of long-term market timing during an environment of asset deflation and monetary inflation.
Aided by this time machine, we put every dollar we had into the market on May 26, 1970, when the Dow closed at 631. What makes this day remarkable is that 631 is the lowest level the Dow index closed at between November 20, 1962 and September 12, 1974. It was the single cheapest day to buy stocks over an almost 12 year time period, and at the time, the lowest that stock prices had been at in more than 7 years. Perfection.
Subject to the conditions that 1) as long-term investors we need to be in the market ten or more years, and 2) that we want to stay within the 1968 - 1982 period of sustained asset deflation and high monetary inflation, we instruct our time machine to find the best possible place to sell. This turns out to be April 27, 1981, when the Dow closed at 1,024.
April 27, 1981 was the single highest close for the Dow index between January 22, 1973 and October 19th, 1982. So we buy in on the exact day with the lowest stock prices in an almost 12 year period, and we sell everything out on the exact day with the highest prices over an almost a ten year period. Double perfection!
So then, how did we do? As shown in the following graph, which begins on our purchase date and ends on our sale date - our time machine allowed us to get the best possible results in a thoroughly bad market. If our returns had exactly tracked the Dow between when we bought and sold, our perfect timing would have taken us from 631 to 1024, for a 62% price gain in the midst of one of the worst markets in memory.
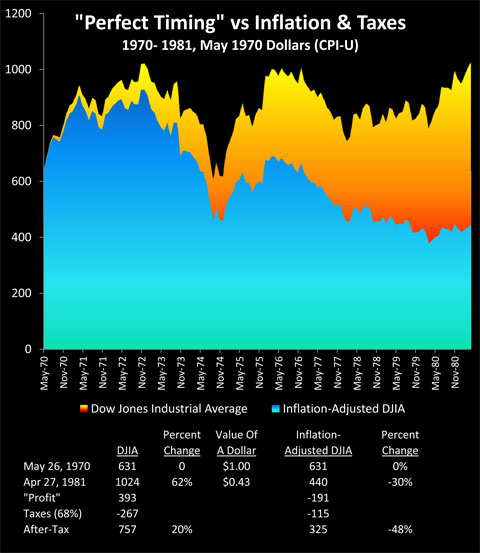
A whopping profit indeed! Before we adjust for inflation, that is, so let's do that. A dollar on our sale date in April of 1981 was only worth 43 cents compared to what it was worth on our purchase date in 1970. When we adjust for what our assets will buy for us - we have Dow 440, not Dow 1024. So even the perfect timing delivered by our time machine leads to a 30% asset deflation loss in real terms, not a 62% gain.
The Internal Revenue Service did not "see" these losses, however, but on the contrary, was quite impressed by our remarkable investment prowess. Moreover, taxes were higher back then (when we confine ourselves to federal income tax rates, we truly are at a low level now compared to much of the modern era). Assuming we were in the highest income tax bracket, and traded often enough to pay ordinary income tax rates, then given that the average top income tax rate over that period was 68%, this means that we would have paid out 267 in taxes on our 393 gain.
These taxes on effectively non-existent income are known to economists as "inflation taxes", and during times of high inflation, they can be devastating.
Subtracting out real taxes on imaginary income leaves us with Dow 757 in after-tax terms, and Dow 325 in after-inflation and after-tax terms. Thus, even with our quite unrealistic assumption of absolutely perfect market timing - which allowed us to radically outperform almost every other investor in the nation - we still lost almost half (48%) of the purchasing power of our net worth.
Lessons Learned & Implications For Today
The most important takeaway from our time machine scenario is not about 1970 or 1981, but about what investors face today. The world has changed immensely, and there are numerous reasons to fear that long term asset deflation could become reality again. And with the fight for survival of both governments and banking systems, that are each effectively dependent on rampant monetary creation and deficits without end - the chances for major inflation have never been higher in the modern era.
History does show what can happen next for an entire nation with a deeply troubled economy. For more than decade, the markets and investor wealth can be dominated by the deadly combination of:
1) a crippling destruction of the purchasing power of investment assets;
2) a masking of this asset deflation by the destruction of the purchasing power of money; and
3) this masking then generating illusionary "profits", upon which taxes have to be paid, which then compounds the damage.
Moreover, history shows us quite clearly that when all three of these major wealth destroyers are working together in the real world - conventional investing methods cannot withstand the destruction of investor wealth that occurs across the nation and over the long term. Even when we used the extraordinary assumption of perfection in timing - there was still a crippling asset price loss in real terms. Of course, real world investors who didn't have the benefit of assumed perfect timing almost all lost even more money.
There was very little one could do about it then - nor is there today - so long as conventional investment practices are followed. That placid and theoretical world of ever-compounding retirement investment accounts simply doesn't have a chance when it runs into the real-world triple wealth destroyers that aren't factored into the usual financial modeling assumptions.
The second half of this article takes a current-day look at how the combination of asset deflation, price inflation and inflation taxes could produce both Dow 36,000 and devastating market-wide investor losses. A fundamentally different approach to preserving wealth is suggested, which is using three reversals of the redistribution of wealth in order to turn three wealth destroyers into three wealth creators.
Contact Information:
Daniel R. Amerman, CFA
Website: http://danielamerman.com/
E-mail: mail@the-great-retirement-experiment.com
This article contains the ideas and opinions of the author. It is a conceptual exploration of financial and general economic principles. As with any financial discussion of the future, there cannot be any absolute certainty. What this article does not contain is specific investment, legal, tax or any other form of professional advice. If specific advice is needed, it should be sought from an appropriate professional. Any liability, responsibility or warranty for the results of the application of principles contained in the article, website, readings, videos, DVDs, books and related materials, either directly or indirectly, are expressly disclaimed by the author.