


Stealth Taxes Consume Stock Gains & Retirement Plans, Part 2
by Daniel R. Amerman, CFA
What if bottom line investment results for a nation as a whole were very different than the great majority of investors understood? What if most long term investment plans were based on what could be quite easily shown to be "bad information"?
These questions may seem a little difficult to accept, because clearly, with the continuous stream of news, commentary and analysis about investment markets that are available 24/7 in newspapers, magazines, blogs and cable business news – such a discrepancy couldn't exist.
Or could it?
In this researched-based tutorial, we're going to take the conventional wisdom about stock market performance and apply two very simple – and irrefutable – truth tests to what real historical results have been. These "truth" tests consist of adjusting for inflation, and adjusting for taxes.
The premise behind these two simple truth tests is that what matters when it comes to investment performance over the long term is what your investments will buy for you after you've paid your taxes. Which means that adjusting for inflation and taxes is not optional – but mandatory.
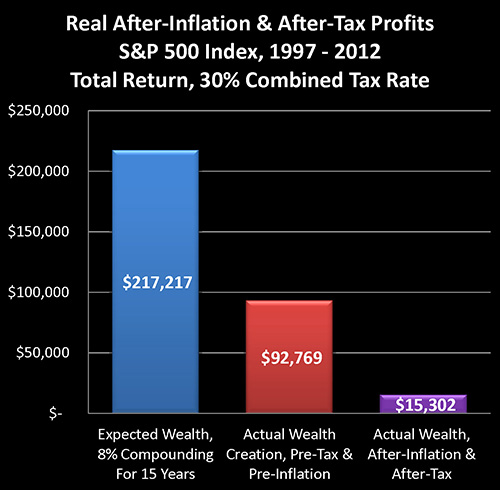
As is illustrated in the graph above, once we take these two simple steps, and apply them to 15 years of real-world performance of the Standard & Poor's 500 Stock Index on a total return basis, we will find that for stock investors across the United States – there has been a 93% failure to perform. In other words, if we take common market assumptions from the late 1990s and we compare actual performance, 93% of expected investment results for the nation as a whole disappear like vapor.
Which then leads to the next logical question. If some investors clearly understand the issues, whereas most investors do not – does that open up opportunities for this minority of investors?
Adjusting Price Returns For Inflation And Taxes
This analysis is Part Two of the Stealth Stock Taxes Consume Market Gains & Retirement Plans series. It can be read on its own, or it can just as easily be read as the beginning of the series as it can the end of the series.
What we will do is fully integrate two essential factors – inflation and taxes – which MUST be taken into account if we are to get to the true investment bottom line of the purchasing power of our investments after the payment of taxes.
In Part One of this series, we took a look at price returns only on the S&P 500 from the end of 1997 through the end of 2012, and based on an assumed starting portfolio of $100,000, developed the graph and chart below.
http://danielamerman.com/articles/2013/StealthC.html
As shown, what appeared to be an almost 50% increase in the value of stock portfolios for investors across the country, turned out to be a mere 2.7% increase once we adjust for the change in purchasing power of the US dollar.
When we add the consideration of taxes – which are assessed on nominal pre-inflation earnings, not inflation-adjusted changes in purchasing power – then it is a relatively simple matter to show that the average investor in a combined 30% federal and state tax bracket, who had purchased a stock portfolio at the end of 1997 and sold at the end of 2012, would indeed, despite the surface appearance of a 50% profit, have instead lost 7% of their starting net worth – with no real profits whatsoever – once we adjust for inflation and taxes.
The appearance of a 50% profit is based on the newspaper headline approach to looking at market returns, which is the way most people look at the markets. They expect most of their money to come from changes in price levels, which are not generally adjusted for inflation.
Simply adjust for inflation and paying taxes, however, and all profits are taken, as well as a sizeable chunk of starting net worth. This is true whether taxes are paid on an ongoing basis, or as long-term capital gains, or as ordinary income when drawing down a tax-deferred retirement account.
Adjusting Total Returns For Inflation
Now while looking at price movements is a good first step, and reflects the price focus of many investors, when we move to a professional perspective we can't just stop there.
That is, the true source of most returns for stock investors over the long term has historically not been price movements, but the receipt of dividends, the reinvestment of those dividends, the reinvestment of the dividends from the reinvestments, and so forth. This is the real core of the financial mathematics behind most long term investment models, and it generates a compounding of wealth over time which is both far more profitable and substantially more stable than price movements only.
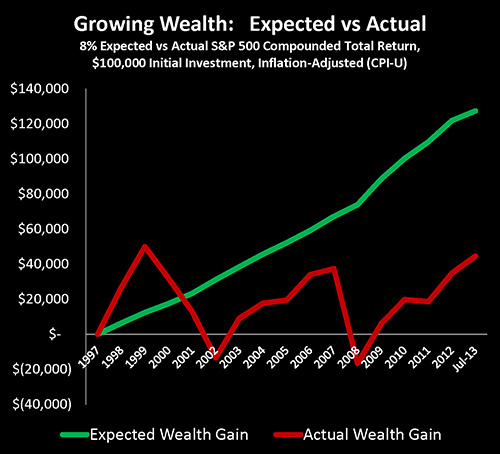
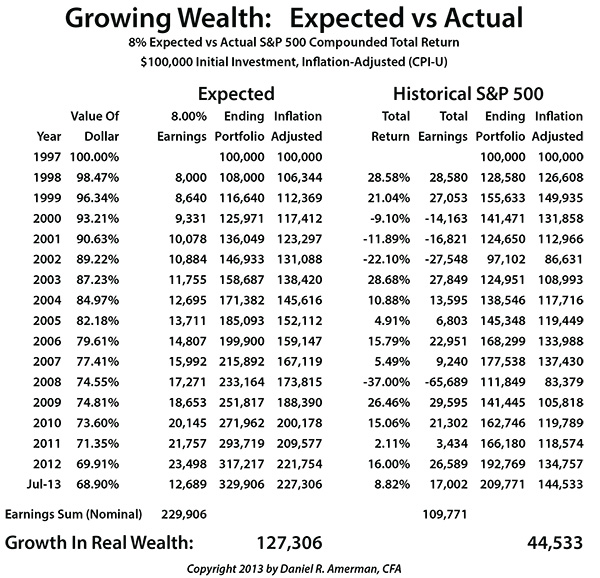
In my recent article, Creating Wealth With Stocks: Theory Versus Our New Reality, we took a look at the S&P 500 on a total return basis – including price changes, dividends and dividend reinvestments – over a 15.5 year period (which is slightly different from this article). We started with an assumed initial investment of $100,000 at the end of 1997, and looked at how much it would be worth by July of 2013.
http://danielamerman.com/articles/2013/StockWealthD.html
As demonstrated in that article, in pre-tax terms and for the nation as a whole, when we look at total return on the S&P 500 for that period between the end of 1997 and the middle of 2013, there has been about a 65% failure to perform on an inflation-adjusted basis. And as further explored in detail, if we take a common assumption of an 8% compounding rate from the late 1990s, and we examine results for the next 15 years, we find that even after fully adjusting for assumed dividends and dividend compounding – the stock market in the real world produced only about one third of the compounded wealth that most investors expected it to.
So to understand why so many pension funds have been in such trouble, and why so many investors are deferring retirement, the explanation can be found in the fact that two thirds of the assumed wealth that was built into so many financial planning models has simply failed to materialize. And this has been a particular problem for tens of millions of Boomer investors who were counting on that wealth growing in their accounts in these critical 15 years near the peak or end of their working careers, when most of their investment gains were supposed to occur.
Total Returns & Real Tax Rates
Now let's use the same methodology we did with our price-only analysis, and apply it towards understanding the dramatic impact of inflation taxes on total return.
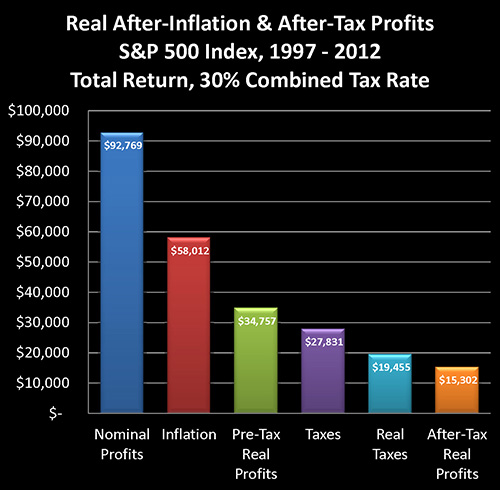
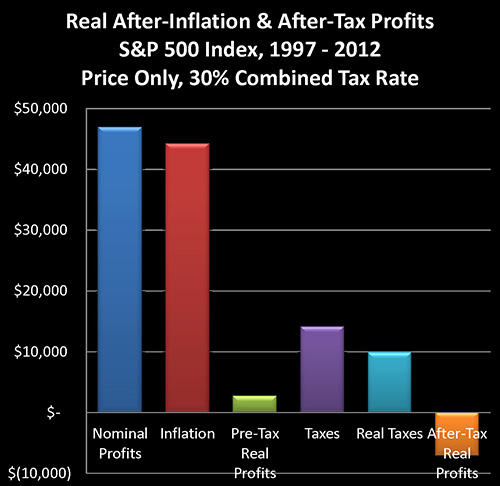
Assuming we started with an initial investment of $100,000, then our portfolio value at the end of 2012 would have been $192,769. Subtracting the initial investment, this leaves us with $92,769 in profits, as shown in the dark blue bar on the graph and line (2) on the chart.
When we next take the declining purchasing power of the dollar into account, it turns out that $58,012 of our "profit", is really just keeping up with inflation (the red bar and line 3). (To find this number, we start with our ending portfolio balance of $192,769, and adjust for inflation by multiplying by 69.91%. The end result is $134,757, which is the real value of our portfolio in inflation-adjusted dollars, and the difference between the $192,769 and $134,757 is $58,012.)
After adjusting for inflation we find that our real profits (pretax) are in fact only $34,757, as shown in the green bar and line 4. (We can derive this number by either subtracting the inflation number in line 3 from the nominal profits number in line 2, or by simply taking our ending $134,757 inflation-adjusted portfolio value, and subtracting our initial $100,000 investment.)
In comparison to our previous price-only analysis, the inclusion of 15 years of dividends and the reinvestment of those dividends substantially changes the proportions between the red inflation bar and the green real earnings bar. While inflation no longer completely overpowers real earnings, it is still a larger component of nominal profits than real return. And as we will see, there have been major implications for real returns on a nationwide basis.
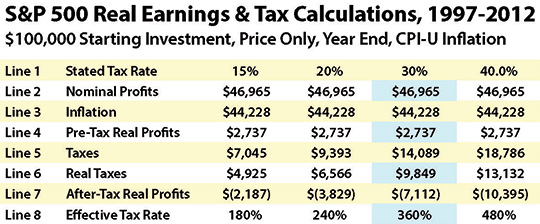
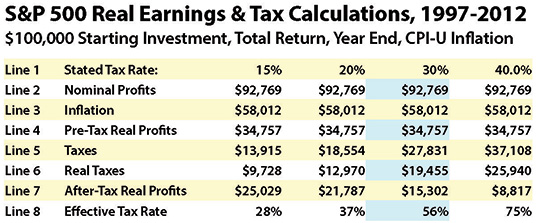
The four right-hand columns in the chart are for varying tax rate assumptions, on a combined state and federal basis. We will be using the assumption of a 30% tax rate for this walk-through.
Again, the Internal Revenue Service does not recognize inflation as a deduction. Therefore, it treats the entire $92,769 shown in line 2 as being taxable income. When we apply a 30% tax rate (assumed combined Federal and State marginal rates) to this, we come up with the $27,831 in taxes due, as shown in line 5, as well as the purple bar of the graph. So then, taxes are equal to 80% of real profits.
However, because we are looking at real profits in inflation-adjusted terms (the value of the dollar at the end of 1997), we need to look at taxes in terms of 1997 dollars as well in order to keep an "apples to apples" comparison. Multiplying the 2012 taxes by our inflation deflator of 69.9% gives us real taxes of $19,455, as shown in line 6 and the aqua-colored bar.
When we subtract these inflation-adjusted taxes (line 6) from our inflation-adjusted income (line 4), we find that the real after-inflation and after-tax bottom line is a gain of $15,302, as shown in line 7 and the orange bar of the graph. When we compare the small orange bar on the right end to the tall dark blue bar on the left end, which is the profits shown in our account statements and tax returns – we find that there has been an extraordinary diminishment.
A key part of that diminishment has been real tax rates, as seen in line 8.
When we divide real taxes as shown in line 6, into real income as shown in line 4, we get the real tax rate on real income. Thus for our 30% tax rate example, we divide $19,455 in inflation-adjusted taxes by $34,757 in inflation-adjusted income, and find a real tax rate of 56% as shown in line 8 of the chart, which is also illustrated in the graph below.
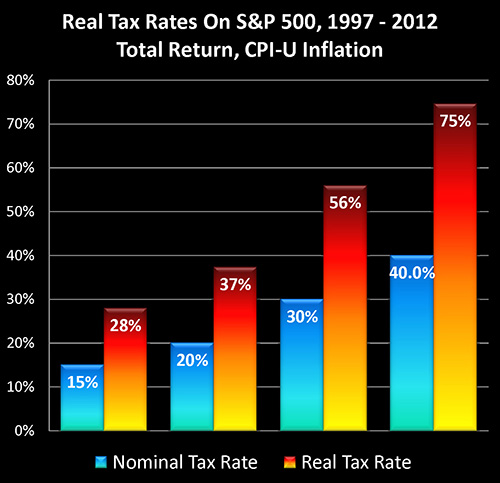
As further shown in the chart and graph, for the 15 years analyzed and looking at actual total returns on the Standard & Poor's 500 index, a 15% stated tax rate translated into a real tax rate of 28%, while a 20% stated tax rate translated into a 37% real tax rate, and a 40% marginal (federal and state) stated tax rate became a 75% real tax rate.
Reality Always Trumps Illusions - Whether Understood Or Not
Reality is what reality is. And whether or not an individual person – or the belief system of an entire society – understands the true nature of that reality can be more or less irrelevant.
Let's step back and look at real world investment results for tens of millions of investors over a 15 year period, with the assumption that they achieved stock performance results that were equal to total returns on the Standard & Poor's 500 index. For each one of these many millions of individuals, if they were to compare their brokerage account statements from the end of 1997 through 2012, then the price for each share they had owned over that period would be on average up by almost 50%.
From the average person's perspective, even after all the stock market gyrations, the ending bottom line is that they have clearly made quite a large profit by investing in stocks. There is really no room for disagreement, because the evidence is right there in black and white on those brokerage account statements.
They received dividends as well, which if inside a retirement account, were likely reinvested. Now this part would be a little less plain, given they were making investments each year, but if we were to take just what they had at the end of 1997, and compound it forward using the actual total return realized on the S&P 500, then they would have around $1.92 for every dollar they started with – meaning they almost doubled their money.
Again, that is strong real world evidence for the average investor that they did pretty well.
So they take that $92,769 in income, and they pay 30%, or $34,757, in combined federal and state taxes on their earnings. (We're concentrating on earnings, and will ignore the taxes due on the their original investments if held inside a tax-deferred retirement account.)
So this average investor did reasonably well with making money on rising share prices over those 15 years – albeit not quite as good as they would've liked. Their wealth really did compound as shown in their brokerage statements, with one dollar becoming almost two dollars – again a bit slower than hoped for but still substantially positive. And when it comes to their tax returns, they paid 30% on income earned and not a penny more. So they obviously got to keep 70% of what they made.
Yet, somehow the amount of money they had expected to be available to support them in retirement wasn't nearly what they thought it was going to be.
Now let's take a quick look at this common perspective using real world numbers and the irrefutable mathematics of calculating after-inflation and after-tax returns.
Someone who started with $100,000 would have ended with $192,769 at the end of 2012 – if they had reinvested all dividends received, paid no fees, paid no interim taxes, and if their performance had exactly tracked real world total returns on the Standard & Poor's 500.
Thirty percent taxes on $92,769 in income is $27,831, which leaves them with $164,938 (before taxes on the $100,000 starting investment in a retirement account). When we adjust for the purchasing power of a dollar having dropped to 69.9 cents (per the CPI-U as calculated by the US Bureau of Labor statistics), the purchasing power of their after-tax and after-inflation savings is down to $115,302.
That is a pretty simple and indisputable 1-2-3: 1) look at historical total returns; 2) pay taxes on profits; and 3) adjust after-tax dollars for inflation using government statistics. That means that we're left with a mere $15,302 in after-tax and after-inflation income after having invested in stocks for a 15 year period with a $100,000 portfolio.
(I've been using a longer method to get to that same bottom line number, because my goal is to help people, not merely depress them. Ending bottom lines can look almost random if we don't understand what created them. Our goal should be to make concrete changes to minimize this problem, or even do a reversal, so that this challenge is flipped into an opportunity. But to have a chance at this, we need to start by thoroughly understanding each of the factors that create the problem, and the relationships between those factors. There is no substitute for understanding.)
Now if over that 15 year period we had received what many people would have expected, which would have been an 8% compounded return on our stock portfolio, then we would be ahead by $217,217.
If we want to truly understand why so many relatively well-off investors in good paying careers – who have been building stock portfolios on a disciplined basis for decades now – are not actually retiring as planned, but are instead deferring retirement, all we have to do is combine those three levels of illusion. For when we do so, and we compare the expectation that many millions of people had for where 15 years of stock investing was supposed to take them, to their actual real world after-inflation and after-tax results, the bottom line is that on average their investments only created 7% of the wealth which they had been expecting and counting upon for retirement.
Unless, that is, the investor was investing outside a tax-deferred retirement account. Payment of taxes on an ongoing basis rather than being deferred reduces the annual return, which reduces the compounding rate. This is particularly the case if there is frequent trading which leads to higher short-term tax rates.
Given the small total returns on a real basis over a 15 year period, the inclusion of even modest financial fees is also sufficient to wipe out all profits and create a real loss.
There is also the matter of actual purchasing power, which is a rather different thing than official inflation rates. If like most people, when you look at what has actually happened to your cost of health insurance, food, college tuition, gasoline and utilities over the last 15 years, and you find that you have experienced a decline in purchasing power for your personal lifestyle that seems substantially greater than the small 2.42% official annual rate of inflation, then your real-world results are going to be worse, and possibly far worse.
Is This An Anomaly?
Let's return to the original questions with which we started this research-based tutorial. Could it be true that most investors in the country do not understand what actual investment performance has been? Could it in fact be radically different than what they think?
As we have just explored, the answer to this seemingly fantastical question is – yes. At least for the Standard & Poor's 500 stock index between the end of 1997 and the beginning of 2012.
This then logically raises another question. Is this some rare and isolated incident that's confined just to these particular years, or could there be something more pervasive involved here?
To find the answer, let's consider real (inflation-adjusted) price changes for the two largest sources of net worth for most Americans – houses and stocks – over major portions of the 40 year period from 1972 to 2012.
The following graphs are from my previous article, How Financial Reality Is Hidden By Commonly Used Theory & Jargon, linked below.
http://danielamerman.com/articles/2013/JargonD.html
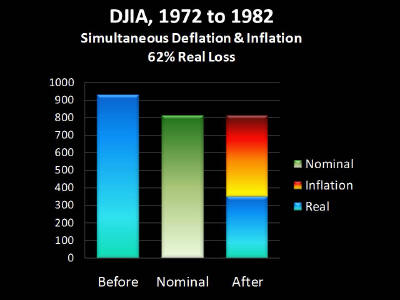
When we look at stock returns between 1972 and 1982 (using the Dow Jones in this case rather than the S&P 500) we see that massive losses in the value of stocks were almost entirely hidden by a massive destruction in the value of the dollar.
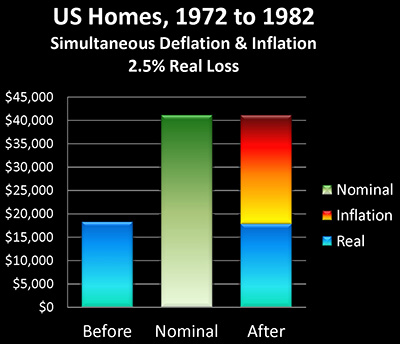
When we look at the average value of a single family home between 1970 to 1982, a time period in which most homeowners thought they experienced the largest increases in the value of their homes in their lifetime (in percentage terms), we can see that once we adjust for the declining purchasing power of the US dollar – all of these gains were an illusion. When adjusting for inflation, the average home lost value in purchasing power terms, even as the nominal price went from about $18,000 to about $41,000.
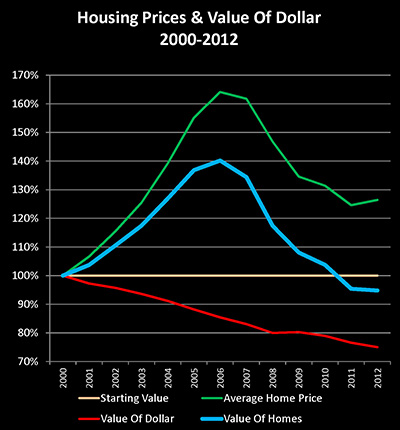
When we look at the housing market between the end of 2000 and the end of 2012 – we see more of the same. What looks on the surface to be a major increase in real estate values around the country turns out to be a decline in real estate values that has been hidden by the decline in the purchasing value of the US dollar.
And as explored herein, when we look at the S&P 500 between the end of 1997 and the end of 2012, we don't see a rare anomaly. What we see is the same relationship that has dominated the two largest asset markets in the United States for 22 years out of 40 years.
This is no anomaly. This is reality.
Perceptions & Reality
I found the research involved in preparing this series of tutorials to be fascinating but not surprising.
This analysis is the latest step in a 20 year process of working to educate and prepare investors. It is not a work of pessimism, and it's not about gloom, doom or the purportedly inevitable destruction of the financial world. While the Great Recession and the Financial Crisis of 2008 are included in the period analyzed, the implications are independent of those events and are much more lasting.
I'm a Chartered Financial Analyst originally from the institutional side of the professional finance world, and I'm also a math nerd who goes where the equations take me. For a variety of economic and financial reasons, as I have written about extensively elsewhere, I have long believed that it was mathematically necessary that real world bottom line results for tens of millions of Boomer investors cashing out their paper wealth portfolios into real goods and services in retirement were likely to be substantially lower than commonly expected.
I have also long written about the compelling reasons to believe that much of the impossible political promises associated with retirement of the Baby Boom would be paid through inflation as a political necessity, in a manner the average voter would never fully understand.
And in combining those two factors of lower real returns in a long-term inflationary environment, the math became inescapable: the most likely eventual outcome for many millions of average retirement investors following the conventional financial wisdom would be a substantive failure to perform in real terms that would be made far worse by high inflation taxes.
Which would necessarily slash retirement standards of living for millions of people, when compared to their expectations.
The years have gone by, and what was once well outside the mainstream projections about the future has now become a 15 year historical study of actual stock market performance for a nation.
A real world example of this subtle yet extraordinarily powerful process occurring in practice is what we just explored, and it is changing millions of daily lifestyles and retirement plans. Whether the people who are experiencing the effects ever understand the root causes could be deemed almost irrelevant – because the after-tax purchasing power of their retirement savings is what it is.
This reality determines their lifestyle. This reality changes the behavior of millions of people, including how many years they work beyond retirement age, and how many hours a week they work during those years. Bills have to be paid, and when government statistics show significant changes in the behavior of people reaching traditional retirement age, they are tracking a nation adapting to reality.
Where knowledge becomes relevant is when somebody wants to do something about it. Inflation, deflation and inflation taxes are all redistributions of wealth. As such, all can be reversed. There exist quite different investment strategies than those typically used by individual investors, which can allow people to do quite well in an environment of pervasive asset deflation and monetary inflation.
Now, inflation taxes are a particular problem, and they apply to precious metals-based strategies just as much as they do to stock-based strategies, as explained in my tutorial on hidden gold taxes.
http://danielamerman.com/articles/GoldTaxes1.htm
That said, however, when we fully understand the relationship between inflation and taxes, it is possible to not only reduce inflation taxes but to in fact reverse them. Where inflation taxes create wealth for us, instead of destroying wealth.
But to reach that place, we have to start with piercing the illusions. It is only through education that we can do that. And it is once we have that education, when we can see reality as it is with clarity, that we can start to take effective self defense measures.