


Gold / Housing Ratio Falls To Historic Low
By Daniel R. Amerman, CFA
In gold terms, an average single family home in the United States can now be purchased for only 18% of its pre-bubble price in 2001. The term "pre-bubble" merits emphasis: the average house can be purchased at an 82% discount (in ounces of gold) not from the peak real estate values of 2006, but the much lower home prices of 2001, before the real estate bubble began.
These numbers are based upon the Gold / Housing ratio, which is a measure of relative value between gold and real estate. When we take the $171,900 current median national price for an existing single family home (per the National Association of Realtors) and divide by the $1,785 price per ounce of gold as of November 15, 2011, we come up with a Gold / Housing ratio of 96, meaning it takes 96 ounces of gold to purchase an average single family home.
The graph below shows the Gold / Housing ratio for the entire modern era in the United States, from when gold investment was legalized on December 31, 1974 through current prices. This graph of relative value between the two investment classes shows how many ounces of gold it took each year to purchase an average single family home (adjusted for constant 2011 home size).
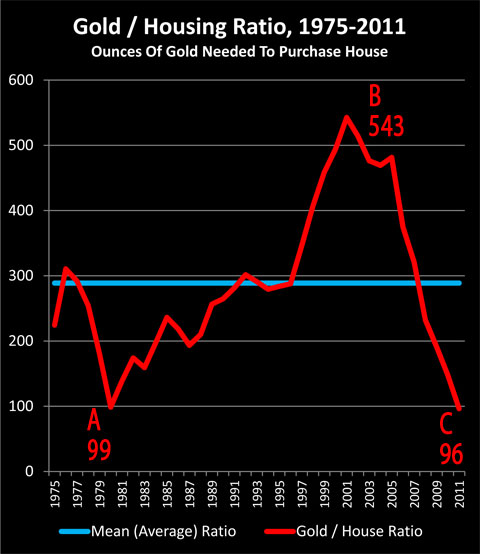
(Sources: For 1975-2010 the graph above uses annual average London price for gold as reported by Kitco, and the 2011 Q2 single family median home price (National Association of Realtors), modified by the annual average Freddie Mac House Price Index, which attempts to account for changes in average home size. 2011 numbers are November 15, gold, and Q2 house price (most recent available ) with the corresponding June house price index.)
In other words: let's net the dollars out, and go for direct comparisons.
People often buy gold and real estate as alternative investments, either because they are concerned about inflation, or they are seeking fundamental diversification from financial assets such as stocks and bonds.
However, while real estate and gold are each tangible assets and powerful inflation hedges - they don't tend to move together in real terms. When we adjust for inflation, both investments separately oscillate up and down around long term averages, and if you can buy gold "cheap" while real estate is relatively "expensive", then on an asset price basis over the long term, gold is likely to strongly outperform real estate as an investment and inflation hedge.
Conversely, when real estate is "cheap" and gold is "expensive" relative to their long-term averages - and each other - then it is real estate that is likely to powerfully outperform gold as an investment and inflation hedge over the long term, all else being equal.
But what exactly is "cheap" and what is "expensive"? Answering that question is where the Gold / Housing ratio graph above comes in.
The long-term average is represented by the blue line on the graph. Over the 37 years that gold has been a legal investment in the modern United States, it has taken an average of 289 ounces of gold to purchase an average single family home, meaning the current price of 96 ounces is only one third (33%) of the long term average.
As shown at "Point A", on an average annual basis, there was a previous modern ratio low of 99 ounces of gold to buy a house when gold reached its financial crisis peak valuation in 1980. Real estate was remarkably cheap relative to gold - and real estate investment would outperform gold by a huge margin over the 21 years to come.
"Point B" occurred in 2001, with the Gold / Housing ratio reaching a high of 543 ounces of gold being needed to buy a single family home. Gold was remarkably cheap relative to real estate - and gold asset prices would outperform real estate asset prices by a huge margin over the 10 years to come.
The current price of gold (as of November 15, 2011) is reflected in "Point C", which shows a Gold / Housing ratio of 96 ounces of gold being needed to buy the average single family home. This is only 18% of the 543 ounces required in 2001. Real estate is once again remarkably cheap, when compared to gold.
("Point C" is different from any of the other points in that it reflects currently available data for the price of gold, housing index and median single family housing price. It is therefore not an annual average ratio, and when in 2012 all the data eventually becomes available for 2011 the annual ratio will likely be lower, because gold spent most of the year at lower price levels. This means the annual average passing below 100 will likely not occur until 2012 - assuming current price levels remain, which is a big assumption in the current volatile times. Calculating a ratio that includes current market gold prices late in the year requires this necessary compromise, or else it becomes a lagging ratio with an annual update, with the full impact of the current price levels possibly not being available until early 2013.)
1980 & Gold As Investment
This next graph shows the average annual price of gold in inflation-adjusted (CPI-U) terms between when investing in gold bullion was legalized in the United States on December 31, 1974, and October 31st, 2011. The blue line is the average price of gold over that period, which is $730 in 2011 dollars. The yellow line is the average annual price of gold during each year (except for 2011, where it is the value as of November 15).
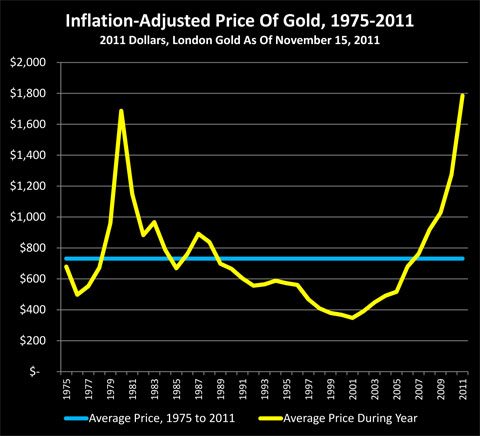
It is worthwhile to consider the situation in 1980. Inflation was soaring. Unemployment was high. An economic "malaise" gripped the nation, and pessimism about the future of the United States was rampant. The stock market was moving between flat and down. The real estate market was in terrible shape.
The one glittering exception was gold, which was soaring upwards in a spectacular bull market and reaching unprecedented levels - and which many people believed would only be a beginning point, as the dollar continued to fall and the economy continued to worsen. There was a new gospel of gold investing as an inflation hedge that would bring great wealth.
However, from that point forward - gold did not perform or meet expectations. In nominal dollar terms, the average price of gold fell from $613 in 1980 to $271 in 2001, a loss of 56%.
What is worse is that although the theory was that gold would be the perfect inflation hedge, in practice over the long term, gold failed spectacularly as an inflation hedge, at least from the perspective of gold purchased in the three peak years of 1979-1981. The inflation didn't stop after 1980 - the official rate of inflation was 10.5% in 1981, the 3rd highest rate of the modern era in the US - but gold investors still lost 32% in that first year after the peak, in inflation-adjusted terms. Gold gave up all of its gains relative to its long term modern average of $730 per ounce by 1985, five years after its peak.
Between 1980 and 2001, the time of the next Gold / Housing inflection point, the dollar would lose half of its value to inflation. Gold did not keep up, however, collapsing from $1,687 down to $347 per ounce (2011 dollars) over 21 years as it lost 80% of its value in inflation-adjusted terms.
(It should be noted that the $730 per ounce modern era average price is based on a relatively short 37 year period of time, which included a purely paper US dollar and two major crises, and is itself unusually high by long term standards. As an example of a longer term, multi-century measurement, gold averaged $458 an ounce (in 2009 dollars) between 1791 and 2009, although inflation measures grow increasingly unreliable the farther back in time one goes.)
1980 & Real Estate As Investment
The graph below shows the average price of a single family home in inflation-adjusted (CPI-U) terms from 1975 through the 2nd quarter of 2011, with a mean (average) price of $179,820 in 2011 dollars. As noted in the Freddie Mac index discussion at the end of the section, this is based upon an average size existing house for 2011, which is considerably larger than the average existing house in 1975, but this adjustment is necessary if we are to accurately compare "like to like" in tracking real estate values.
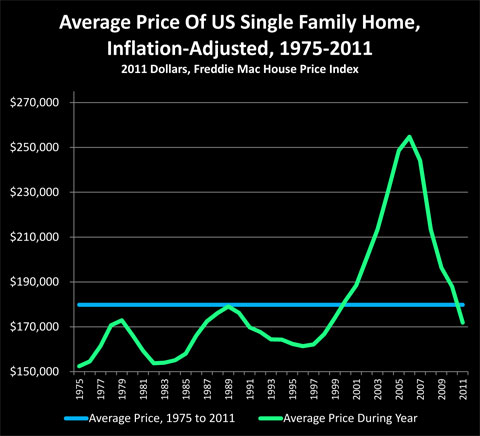
In the mind of the general public in 1980, real estate was a total "dog" of an investment and had been so for years. Some people were turning down promotions if they involved a move, because the raise associated with the promotion often wasn't high enough to offset the radically higher mortgage payments. Many people who would have ordinarily bought homes were renting instead, fearful of how much worse conditions might be when they tried to sell. The combination of recession, high unemployment and inflation-induced high interest rates had created a moribund real estate market, with low sales and greatly reduced new home construction.
These highly negative market conditions created a pricing situation in which real estate was only being valued at 34% of its long-term average value relative to gold, meaning real estate was extremely "cheap" in comparison - and ready to move the other way.
Indeed, from this base of near universal disdain came a remarkably healthy and sustained long-term environment for building wealth via buying investment real estate. Using single family homes as a proxy (investment real estate overlaps, but is not the same thing), in nominal or normal dollar terms, the average price for a single family home in the United States rose every year for the next 21 years from $60,408 to $147,102 (no inflation adjustment). This 144% increase occurred between points A & B in our Gold / Housing ratio graph, and therefore did not include any benefit from the housing bubble.
Inflation was the largest component of this rise, and unlike gold, housing performed as a powerful inflation hedge for the next two decades. Even after adjusting for inflation, during the same period that gold fell 80%, housing rose from $166,342 to $188,467, an increase of 13%. (The decline shown from 1980-1982 in the graph does not exist if we use nominal dollars, which is the norm, it only appears when we adjust for inflation.)
If we take the long term perspective of real estate investments generating steady performance, where cash flows increase every year as rental payments coming in steadily rise relative to mortgage payments going out, even as equity increases every year as overall property prices steadily rise while the mortgage slowly falls - then the years between the turning points of 1980 and 2001 were a wonderful time to be a long term real estate investor. Sure, there were dips and rises and crises as happens with almost any investment category over the long term, but the years between 1980 and 2001 were a great time to accumulate wealth as a long-term real estate investor.
Going back to the relationships underlying the Gold / Housing ratio, as each inflation hedge separately moved up and down around their long term averages, and real estate went from being relatively very cheap compared to gold, to being very expensive, then we would expect real estate to radically outperform gold over that time. Indeed, that is exactly what happened, and the 21 years (1980 - 2001) following the last time the ratio was at 99, real estate asset prices outperformed gold by 448%.
(The house price is calculated using the median national price of a single family home for the 2nd quarter of 2011 of $171,900, as reported by the National Association of Realtors. This price is then adjusted backwards using both an inflation index and a housing price index. The inflation index utilized is the Consumer Price Index (CPI-U), as reported by the Bureau of Labor Statistics. The housing index used is the Freddie Mac House Price Index, rather than the more commonly used S&P / Case-Schiller Index. Like the S&P / Case-Schiller index, the Freddie Mac index uses a "pairs" methodology to account for changes in average house size and amenities over the years; however, the Freddie Mac index uses more widely distributed geographic data.)
Gold & Real Estate In 2001
By 2001, the relationship between gold and real estate had entirely reversed, as the Gold / Housing ratio reached a historic high of 543 ounces of gold to buy an average home.
Gold was a total dog of an investment. Real estate was hot. The overwhelming market sentiment, and what most financially savvy people believed, was that real estate was a far superior investment to gold.
It was precisely the overwhelming consensus of opinion among intelligent, knowledgeable investors, and some of the most respected financial experts in the nation, which created the situation where real estate was very "expensive" relative to gold.
In contrast, if we take the long term perspective of relative value, with real estate far above its historic average value relative to gold, meaning it took 543 ounces to buy a house in 2001, one would expect gold to then powerfully outperform housing - and that is exactly what happened over the following ten years, from 2001 to 2011.
Over the next ten years, gold would rise from $271 an ounce to $1,785 an ounce, even while real estate rose from about $147,102 to about $171,900 for a single family home. Adjusting for inflation, gold rose from $347 an ounce to $1,785, while housing fell from $188,467 to $171,900.
This serves as another confirmation of the central premise of the Gold / Housing ratio, which is that if you can buy an inflation hedge "cheap", then over the long term you are likely to widely outperform an inflation hedge bought "expensive", given that both gold and real estate move up and down around long-term average values.
There are also a couple of other fascinating features of the 2001 peak. The bottom price for gold in inflation-adjusted terms in the modern era occurred in 2001, when the Gold / Housing ratio peaked. The peak price for gold in inflation-adjusted terms in the modern era occurred in 1980, when the Gold / Housing ratio bottomed.
There is an exact correspondence when we look at the peak and bottom values for gold in inflation-adjusted dollar terms, and the peak and bottom values when we view gold in real estate terms.
It is also worthwhile to note that the Gold/Housing ratio did not call the peak in the real estate bubble, far from it. Instead, this ratio of relative values said that real estate was starting to get historically expensive compared to alternative investments right at the very time that the bubble was just starting to make an appearance. So the value of the ratio was not speculative timing within a bubble - but rather was a signal to long-term investors to sit out the bubble altogether.
Market Sentiment & Generational Buying Opportunities
If you had polled market participants and professional commentators in early 1980: the great majority would have said that only a complete fool would move out of gold and into real estate.
Just as, in 2001, likely the overwhelming sentiment of the market would have been that only a lunatic would get out of a powerful and rising real estate market to buy that ludicrous dog of an investment of precious metals.
From an old school contrarian's perspective, having the great majority of the market agree that buying a particular asset category is a completely boneheaded move, is in fact by itself: a big, bold and flashing "BUY" signal.
By definition - this has to be true. It is the general consensus that "only an idiot would do it" that creates the gross distortion of the relationships among long-term asset values, and which in turn creates the once-in-a-generation buying opportunity.
Indeed, following this strategy of moving directly against the overwhelming investor consensus in 1980 and 2001 would have meant dodging both market collapses, and instead owning the best investment for the 10-20 years ahead, acquired under the cheapest relative terms available over the previous 10-20 years. Which is a pretty good way of building wealth safely over the long term.
But when we're talking about potentially major commitments and our own hard-earned personal wealth being at risk - we want more than that. We want some outside assurances.
This is particularly true, because - AS IS ALWAYS THE CASE - there are some really good reasons for why most investors feel the way they do. There is the issue of the "shadow inventory" of homes which banks are not foreclosing upon, and what will happen to real estate prices when these homes do come on the market. There is the question of what would happen to real estate valuations if interest rates spike upwards even as unemployment rises, and what that could do to real estate prices.
It is in helping to get a handle on whether a genuine buying opportunity exists that the Gold / Housing ratio becomes useful.
The last time this situation existed, with very similar market sentiments and psychological conditions, we know that gold would later plunge for 20 years while real estate entered an extraordinarily valuable bull market.
When we compare the current situation to the last time the Gold / Housing ratio trends reversed, we can actually buy a single-family home in gold terms for only 18% of what it was available for in 2001, before the real estate bubble even began.
That 18% is an amazing, breathtaking number. As further covered in the Solutions Companion (for subscribers), we are indeed at a extraordinary point when it comes to relative valuations in the two largest contrarian asset markets.
There is little comfort in this long-term relationship when it comes to relative price movements in the next year; real estate has huge problems, and gold investment performance could still easily crush real estate in the short term.
The value comes when we define ourselves as long-term investors, and say we are not all that interested in speculating, in flipping, or risking our retirement capital on the premise that we will be able to successfully move in and out of investment categories on a frequent basis to adroitly outperform the averages.
The value of viewing things from a long-term perspective comes when we say we would rather not spend our retirement years hunched over a computer watching markets, or facing sleepless nights as we wrestle with a long series of individual short term decisions that will cumulatively determine whether our retirement lifestyle is one of prosperity or impoverishment.
When we move our focus beyond just 2012 and 2013, and say that 2017 is much more important, and that 2022 and beyond is what really matters, and we lift our vision up above the constant short term turmoil - that is when the opportunity becomes remarkable. When we look at the average relationship between gold and housing since gold was legalized in the United States on December 31, 1974, in gold terms we can now buy housing for about 33% of the long-term average.
That 33% is a remarkably cheap relative valuation. All we have to do is say that over the long term, two tangible investments end up trending back towards their average values in inflation-adjusted terms - just like they have done before, decade after decade over the centuries - and we have set up an extraordinary return advantage in relative terms.
A Powerful Case For Gold
There is another way of viewing contrarian investing, and that is not so much to buy low and sell high while moving against the common market sentiment, but rather finding fundamentally different alternatives to conventional investment strategies in the forms of stocks, bonds and paper currencies.
The other face of gold – and the most attractive face at this time – is as a crisis investment in the event of monetary and financial system collapse.
I've written extensively on the subject for a number of years now, and won't repeat it here, but with massive government deficits without end, there is a strong chance that the gold run could still just be getting started.
Soaring entitlements and a long term unemployment crisis combine to create still more pressures on a dollar, and these problems are exacerbated by the short term fix of trying to smooth things over by creating trillions of dollars out of the nothingness, while refusing to tackle the underlying issues.
And we certainly can't forget the still strong potential for a euro collapse at some point, as well as the fundamentally different global economic environment from 1980, most particularly with the powerful rise of Asia.
Reconciling The Opportunities
In my opinion, the best way to reconcile these two sides of contrarian investing - to bring together the need to buy low and sell high, while also meeting the need for liquid safety - is to say "both".
Gold and other precious metals have powerful advantages. There are some things they do that are better than any other investment alternative in the event of a currency or financial collapse. Having a significant holding of precious metals in a currency meltdown environment is simply irreplaceable.
Gold is not absolutely bound by 1980, and if the situation in 2012-2014 is far worse than the situation in the early 1980s, then we could see gold traveling an entirely different short term path, and it may still just be getting started compared to where it will go.
However, when we remove our gaze from the short-term, and we assume a return to history as we've seen over previous decades and centuries, then what the Gold / Housing ratio shows us is that gold is valued at an extremely high level, and real estate is remarkably cheap in comparison. To choose gold long-term while avoiding real estate long-term is to fight not only the averages but history itself - which by definition, has never worked.
So our solution is to not choose between the two assets but to purchase both kinds of contrarian assets with different objectives.
We choose precious metals to the extent that we are concerned about currency and financial system meltdown (although real estate has some powerful advantages as a precious metals complement in this situation as well).
If there isn't a currency meltdown - for someone attempting to build long-term value, then buying real estate at current prices is likely to be a far better source of long-term returns than gold, and likely to act as a much better inflation hedge.
The relative amount of assets devoted to each of these contrarian investments then depends on the individual investor's personal assessment of the likelihood of actual financial meltdown.
 What you have just read is an "eye-opener" about one aspect of the often hidden redistributions of wealth that go on all around us, every day.
 An "eye-opener" tutorial of a quite different kind is linked here, and it shows how governments use inflation and the tax code to take wealth from unknowing precious metals investors, so that the higher inflation goes, and the higher precious metals prices climb - the more of the investor's net worth ends up with the government.
 Another "eye-opener" tutorial is linked here, and it shows how governments can use the 1-2 combination of their control over both interest rates and inflation to take wealth from unsuspecting private savers in order to pay down massive public debts.
 A personal retirement "eye-opener" linked here shows how the government's actions to reduce interest payments on the national debt can reduce retirement investment wealth accumulation by 95% over thirty years, and how the government is reducing standards of living for those already retired by almost 50%.

If you find these "eye-openers" to be interesting and useful, there is an entire free book of them available here, including many that are only in the book. The advantage to the book is that the tutorials can build on each other, so that in combination we can find ways of defending ourselves, and even learn how to position ourselves to benefit from the hidden redistributions of wealth.