
Three Converging Factors May Slash Economic Growth By 71%
Everything from the ability to pay for Social Security, to projected federal deficits, to retirement planning and stock market valuations is based upon assumptions that the United States and other nations will emerge from crisis and return to "normal" long-term growth rates.
What happens if we don't return to those growth rates?
When we step far back from the crisis in Europe, the US fiscal cliff, the Federal Reserve's "twists" and "easings", and other day to day headlines, and we instead go down deep to the very bedrock factors that help determine economic growth - then we can see that some major changes have taken place. Indeed, when we combine three of these deep and fundamental factors, there are strong historical reasons to believe that the United States growth rate could drop from a long-term historical rate of 3.5%, to an annual rate of 1.3% - and a per capita rate of 0.2% - in the coming decades.
If so, then over a period of a little more than 20 years this would compound to a 71% reduction in economic growth. This lack of future growth would result in a 40% smaller overall economy, compared to what it would be with normal growth. Because current government deficit projections, stock market valuations, and retirement planning models are all based upon "normal growth", the results would be catastrophic. There would be a much smaller economy available to support retirement and government promises, almost no growth in the stock market, and a long-term collapse in the value of retirement portfolios and pension plans.
This may sound extreme. Yet, the three factors reducing long-term growth rates are not wild "gloom and doom" projections, but rather are quite fundamental factors that form the bedrock of the economic and financial present and future, albeit little noticed in the exciting daily hubris of the financial news.
Debt Overhangs
The first issue is that the United States government is heavily in debt, with outstanding federal debt in excess of 100% of the size of the national economy. This could lead to many different outcomes, which may or may not include default, and may or may not include hyperinflation or a currency collapse.
What we do know is that many nations have been in this situation in the past, and regardless of the particulars for how it was resolved - there is almost always a powerful, long-term drag on economic growth. Heavy government debts generally create a somewhat toxic environment for economic growth, and the resulting reduction in growth rates isn't speculation, but is in fact global economic history for many nations over the centuries.
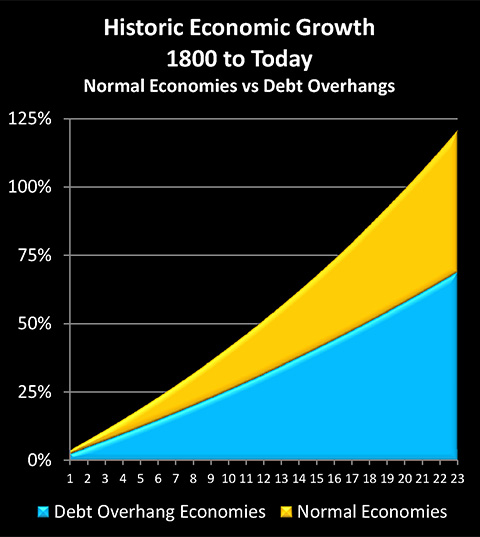
An excellent historical analysis of this issue can be found in the working paper, "Debt Overhangs: Past and Present", which was published by the National Bureau of Economic Research in April, 2012. Authored by Carmen Reinhart, Vincent Reinhart and Kenneth Rogoff, it examines 26 different "debt overhangs" that have occurred around the world since 1800, with "debt overhang" being defined as public debt exceeding 90% of GDP for at least five years. Among the many nations studied were the United States, the United Kingdom, Japan, Canada and Australia.
The analysis determined that while growth averaged 3.5% per year when public debt was less than 90% of GDP, it went down to only 2.3% per year when public debt was more than 90% of GDP. This is a reduction of 1.2%, or a little more than a third of annual economic growth.
A reduction of a little more than 1% per year may not sound like much, but it is critical to keep in mind that economic growth rates are a form of exponential compounding that drive everything from average household incomes to budget deficits to stock market valuations. Over 20 years, an economy growing at 3.5% per year will almost double in size. However, an economy growing at 2.3% per year will increase in size by a little more than 50%. So, almost half of the economic growth is lost, and the total economy is almost a quarter lower in size than it would have been without the massive government debt outstanding (ending GDP equals 158% of starting GDP, instead of 199%).
What Reinhart, Reinhart and Rogoff found was that the average duration of a debt overhang was 23 years, and that the end result was a 24% reduction in the size of national economies, compared to what they would have been if they had grown at their average growth rates when not crippled by large government debts.
That is a startling number.
If household income were to rise and fall with the overall economy (it has been growing at a lower rate in the US), then if the United States had had today's debt overhang during the period from 1985 to 2008:
- Median household income would be about $38,000 a year, instead of $50,000 per year.
- Government spending would be much less, or taxes much higher, or deficits much higher - or some combination of the three.
- Social Security would be running a huge annual deficit, and it would have started years before.
- The day to day standard of living for the entire nation would be appreciably lower, and would be seen in everything from cars driven, to the size of average homes and apartments, to food, to electronics and restaurant sales.
- Half of the growth in corporate profits would not have occurred - and the stock market would be far lower.
The empirical evidence from more than two centuries of world history is that if a debt overhang had existed in the United States starting in 1985 - there is about a 90% chance that it would dominate our current day to day standard of living, government spending, and investment performance (the nations in debt overhangs avoided the reduction in growth rate in only 3 of the 26 episodes analyzed).
For the majority of the people in the middle, life would be at least a little different, and that would be seen in everything from the meals they eat, to the size of their TV and how old their car was.
Those beneath the poverty line would be more numerous, and the safety net would likely be less, because it couldn't be paid for.
For the wealthy and upper middle class - their paper wealth would be considerably less, likely less than half as much, because profits would have been slashed for decades, and lower growth rates would be assumed for what profits there were.
Of course, this didn't happen; there was no debt overhang in 1985. But, it has happened today: outstanding federal debt is more than the 100% of the size of the United States economy, meaning the US is currently well into the debt overhang range.
And history shows that out of the 26 times that nations have found themselves in this position over the last couple of centuries, there were 23 cases where the citizens of the nation became a little poorer every year as a result (compared to normal growth), for decades to come. From where we are today then, it is all too likely that as the annual nicks in economic growth add up, year after year, our standards of living will feel the ever-increasing cumulative damage, with ripple effects that change everything from the viability of Social Security and Medicare to the value of the stock market.
Unfortunately, there is more to future growth rates than "just" debt overhangs. To get a more complete picture, we need to take a look at something else, which is what happens when debt overhangs combine with rapidly aging populations.
An Aging Population
In a major speech in October of 2006, Federal Reserve Chairman Ben Bernanke identified what he believed would be the single most important influence on the economy in the decades to come. He asserted that as the Baby Boom aged, the declining number of workers as a percentage of the population would likely decrease the growth rates for per capita GDP, decrease the growth rate in living standards, and decrease the growth rate in consumption.
Now, one might say that Bernanke missed the mark entirely, as he failed to anticipate the building financial crisis of 2007 that would lead to the near collapse of 2008, with disastrous consequences that still dominate the global economy today - and that would be correct. Bernanke did completely fail to foresee the changes that would shatter the economy under his watch.
Bernanke's blunder does not, however, make the major demographic problem that he spoke of go away, or lessen it. Indeed the problem is that the two are happening side by side, and both are powerful long term trends that may last for decades. The Boomers are aging, while the national debt is sky-high and climbing - and both will be true for many years to come.
The precise impact of an aging Baby Boom is harder to assess than debt overhangs, as this is not something that one can study over the centuries. It is a phenomenon of the early 21st century, being the result of the intersection of fundamental advances in medicine, the post-World War II economic and social environment, and the arrival of highly effective and convenient birth control in the 1960s.
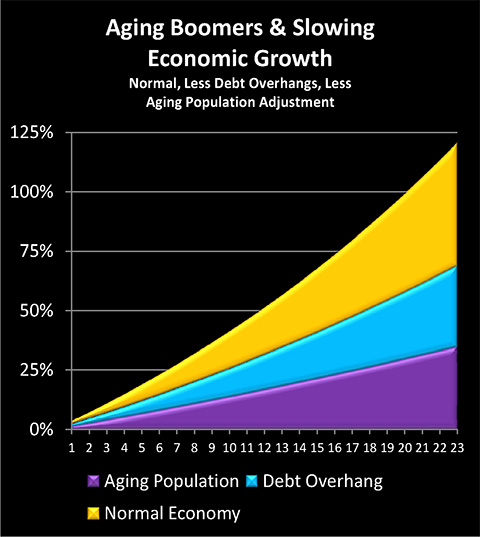
That said, economists have given the assessment a try, and during the same month that Bernanke gave his speech, the Economist magazine published an article titled “The Slow Road Ahead". A number of economists were consulted about the economic impact of this upcoming fundamental demographic change, and the consensus was that there might be a new "speed limit" for economic growth of around 2.5% per year among the aging nations of the West. In other words, an ever-increasing ratio of retirees to younger workers was likely to lead to about a 1% decline from the 3.5% long-term average in the developed world, with this slow down persisting for decades.
So, the debt overhang is likely to lead to a decades-long reduction in economic growth of about 1.2% per year - if this overhang works out to be average. Separately, if economists' estimates are correct, an aging nation with a steadily decreasing percentage of people in their prime working years is likely to experience reduced economic growth over the long-term, with a shortfall of about 1% per year. Combine the two factors, and economic growth falls by 2.2% per year, from 3.5% to 1.3% per year, which is a 63% reduction in the growth rate.
The next question is how long the two growth reducers are likely to work together. The average duration of a debt overhang episode is 23 years. In the United States, the peak of the Baby Boom retirement wave will arrive by the late 2020s and continue into the early 2030s, with the maximum number of Boomers still alive but age 65 and older, and the number of workers aged 64 and younger having fallen to only 2.0 per retirement age person. The two long-term problems cover similar (though not identical) periods, and 23 years is likely as good of a number as any for the calculation.
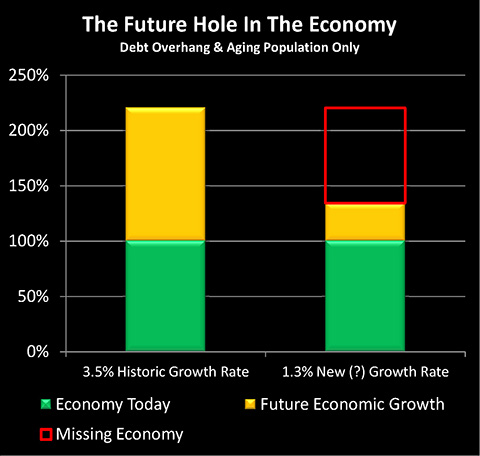
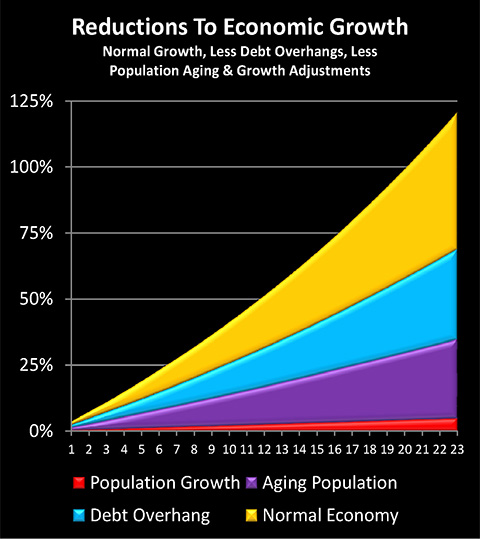
As shown in the graph below, when we take 3.5% growth and compound it for 23 years, then an economy should grow by 121%, meaning it ends up at 221% of it starting size. With a 1.3% growth rate, an economy grows by a mere 35% over 23 years, meaning it ends at only 135% of its starting size.
One way of looking at this is that the economy only enjoys 29% of the growth that it would in normal conditions, meaning 71% of historic average growth is lost to the 1-2 combination of debt overhang and aging population (35/121 = 29%).
A different perspective is that the ending economy after 23 years is only 61% of the size it would be with normal growth, meaning the average person sees a reduction of almost 40% in their income and standard of living, compared to normal economies (135/221 = 61%). To go back to our 1985 to 2008 example, if growth had been reduced by 2.2% per annum, then the median household income today would be about $30,000 per year instead of the current $50,000 per annum.
In other words, about 40% of the current US economy simply wouldn't exist.
Fortunately, this situation of a combined debt overhang and soaring retiree population didn't exist in 1985. Unfortunately, it does exist today, and this is a much worse time to have a national debt that exceeds the size of the national economy. For it isn't just that an aging population is likely to have a lower growth rate, but it costs more to maintain.
The issue is that we have a cost structure for Boomer retirement that is theoretically somewhat fixed with Social Security, Medicare and pension promises. Less money available in the overall economy means that these promises will consume an even larger share of the economy, and there is still less money available for consumption – or for buying investments from retired Baby Boomers.
Falling growth and rising costs is a toxic combination, but there is a third element to consider as well, and it also comes down to basic demographics. When we include this factor, growth may come to a halt altogether, and indeed, may already have done so.
Adjusting For Population Growth
According to the Census Bureau, the population of the United States was 179 million in 1960, and had risen to 309 million by 2010. This means that the US population has grown at an average annual rate of 1.1% per year over the last 50 years. Therefore, if we:
1) Start with the long-term average growth rate of 3.5% over the last couple of centuries, across multiple developed nations;
2) Subtract 1.2% for the average long-term loss in economic growth historically associated with having a national debt exceeding 90% of the national economy;
3) Subtract 1% per year for the effects of a rapidly aging population where there is a steady fall in the percentage of the population that consists of adults in their normal working years; and
4) Subtract 1.1% per year to move growth from total growth to growth per person; then
5) On a per capita basis, the convergence of these three deeply fundamental, long-term factors would seem to indicate that per capita real economic growth for the next 20+ years should drop to about 0.2% per year, or just barely above zero.
What truly matters is not the size of the economy - but what the economy does for the citizens of a nation. If an economy is just barely growing fast enough to keep up with the growth in population, then the nation is not growing wealthier - it is barely staying even.
This third area of adjusting for population growth is a little different from the debt overhang and aging population adjustments. The models for Social Security and Medicare do include a shifting and growing population, albeit not the economic effects of an aging population.
When it comes to tens of millions of retirement investors and pension plan beneficiaries, then, everyone is being told that they can grow wealthy together. I've written about this at much greater length elsewhere, but in very short form - the average person can't be wealthier than the average person. When it comes to resources for a nation as a whole, real wealth is always about the actual economy, rather than compounded paper wealth.
And if, on average, there is no gain in real wealth per person over the coming decades - then stock market valuation (in inflation-adjusted terms), retirement account values and the solvency of pension plans all implode together. Because they are all based upon a (deeply mistaken) belief that substantially positive economic growth is not only the most likely path but the only path ahead.
Financial Geology & The Future
We've all been trained that the essence of financial knowledge is to follow what is happening in New York, London and Tokyo this very minute, with tens of thousands of financial commentators competing to offer their jargon-filled interpretations and complex graphs, in the effort to anticipate the future.
This analysis is quite different and could perhaps best be described as "Financial Geology", for it is not about the myriad crises and headlines of today, but rather the economic bedrock underlying everything else. And the bedrock over the next couple of decades is looking very different from the economic bedrock of 1950-2000 that so many investors and investment analysts seem to believe is the natural and perpetually fixed financial order of things.
The graph above is the applicable Financial Geology for future deficits and for the solvency of Social Security and Medicare. When we blindly project forward the past, then we get the bar on the left - which still leaves a $62 trillion shortfall over the coming decades, using independent projections from sources such USA Today.
If we allow for an aging population and two centuries of experience with debt overhangs, then we get the bar on the right - and the gaping hole in the future. Nothing works. The situation gets much worse than projected - and it happens must faster than what is projected. This is because the projections are based on the simplistic extrapolations of historic growth rates, and we have bedrock reasons to believe that growth rates will be much lower.
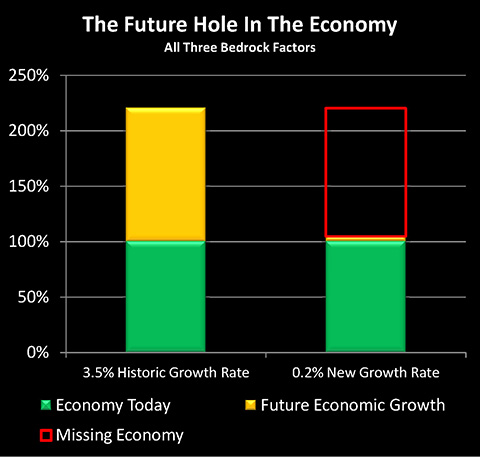
When we look at Financial Geology of wealth for individuals, then the number of people splitting the wealth in the future becomes highly applicable. As shown above, when we adjust for per capita growth rates as well as the other two factors - then there may be no real growth on a per person basis.
Most of the value of the stock market today is based upon the assumption that we know the future, and it is one of unending, exponentially compounded growth. However, our limitation is that the average person can't be wealthier than the average person, and this means that if growth in wealth per person goes flat - the hole shown above consumes most of the value of the market. Not in a short term bear market as part of a longer term cycle, but a total redefinition of stock market returns on a generational time scale, that may last until the bedrock fundamentals change again.
The New Baseline Scenario
Of course, it would be folly to say that we know the future with certainty.
There are many possible paths to higher future growth rates, many revolving around potential technological breakthroughs. As examples, nanotechnology, robotics, and making fuel from algae all have the potential to radically increase the wealth and economic growth rate of the entire planet.
Or, they might not.
There are also at least as many routes to a much bleaker future than merely near flat growth. Global economic depression, hyperinflation, and the many variants of war in modern times such as nuclear warfare, biological warfare and cyber-warfare all have the potential to catastrophically collapse wealth and economic growth.
Or, they might not.
The point is that while the future is inherently unknowable, we still need a baseline scenario from which to work in order to make the financial decisions that must be made for our families. The baseline financial planning scenario used by almost all of us today is effectively an indefinite projection of selected elements from the past into the future.
Now, when we know that fundamental, bedrock factors are changing historical growth rates, then logically, simply projecting past economic growth rates from recent decades forward becomes not the center but an outlier. That is, in order for the future to deliver the results upon which government and conventional financial planning projections are built, we must have a major acceleration of economic growth from... somewhere... on a sustained basis, in order to overcome the three bedrock reductions in per capita economic growth discussed herein.
It could happen. After all, 3 nations in two centuries (out of 26 with debt overhangs) did just that, they were statistical outliers that did succeed at keeping their growth rates at normal levels.
But are you willing to bet your entire financial future on this emergence of powerful economic growth factors from some unknown source that will offset - or more than offset - the known factors which indicate a decline in growth rates? Because if we are following the conventional financial wisdom for long-term and retirement planning, that is precisely what we are doing.
On the other hand, if we accept that the economic bedrock has changed, and that the new baseline scenario is one of much slower or even flat growth, then continuing to follow conventional investment strategies which entirely depend upon high growth rates, means that we are more or less intentionally throwing the value of our savings away. Because we are investing for a high growth future through buying investments that will collapse in value absent such growth - even when we know better today.
Following that logic to the next level, it then becomes an urgent personal priority for each one of us to find alternative investment strategies which are not based upon historical growth rates. We need not attempt to outguess a volatile market week by week or month by month, but to instead find and enter into fundamental, long-term strategies that are based on a new baseline scenario of low growth, high government debts, and an aging population where the ratio of investment sellers to investment buyers is steadily rising.
 What you have just read is an "eye-opener" about one aspect of the often hidden redistributions of wealth that go on all around us, every day.
 A personal retirement "eye-opener" linked here shows how the government's actions to reduce interest payments on the national debt can reduce retirement investment wealth accumulation by 95% over thirty years, and how the government is reducing standards of living for those already retired by almost 50%.
 An "eye-opener" tutorial of a quite different kind is linked here, and it shows how governments use inflation and the tax code to take wealth from unknowing precious metals investors, so that the higher inflation goes, and the higher precious metals prices climb - the more of the investor's net worth ends up with the government.
 Another "eye-opener" tutorial is linked here, and it shows how governments can use the 1-2 combination of their control over both interest rates and inflation to take wealth from unsuspecting private savers in order to pay down massive public debts.

If you find these "eye-openers" to be interesting and useful, there is an entire free book of them available here, including many that are only in the book. The advantage to the book is that the tutorials can build on each other, so that in combination we can find ways of defending ourselves, and even learn how to position ourselves to benefit from the hidden redistributions of wealth.