


Arbitraging Fed Policies With Rental Housing Cash Flows
By Daniel R. Amerman, CFA
Overview
By forcing interest rates to record low levels, the Federal Reserve has effectively vaporized most interest income along with most of the ability to benefit from compound interest, with devastating results for many retirees, retirement investors and pension funds.
However, in the process of creating artificially low interest rates for an entire economy, the Fed has also opened up unusually profitable opportunities for individual investors with certain types of investments. Record-low interest rate levels are the most powerful of six different factors that are currently working together to increase owner cash flows from the purchase (or refinancing) of investment real estate in the United States.
In combination, these six factors have created the best fundamentals for cash flow-driven real estate investments in the modern era, delivering not only historically high cash flow in an otherwise yield-starved world - but also substantially higher safety margins than normal.
In some important ways, long term cash flow investing is almost the diametric opposite of short term price appreciation investing. As the last decade's real estate bubble was creating a short lived golden era for speculators, it also nearly ruined the market for the cash flow investors. Real estate prices rose so high in some major metropolitan areas that there was simply no way to take out a substantial mortgage to buy a property and then rent it out at a positive cash flow.
The cash flow investors are currently getting their "revenge", however, for in the aftermath of the housing bubble - we can now find the best fundamentals for cash flow-oriented investment in our lifetimes. This article will place these key fundamentals in a 20 year context, and then look at how artificially low interest rates - along with five other factors - are working together right now in the market to boost cash flow opportunities.
Understanding Cash Flow Investing
The most important feature of real estate cash flow investing is that it exists on the margin: you get what cash is left over after the expenses have been paid.
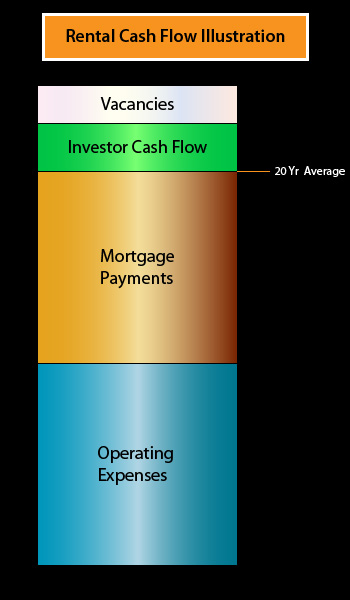
The column above represents the gross rental cash flow from a generic property.
First, we subtract for assumed vacancy rates, since we never collect the rent when a unit is empty.
Next, we pay the operating expense bills. This includes basic maintenance, some utilities, property taxes, insurance, leasing expenses, a professional property manager in the example proportion above, other expenses, and a reserve for capital replacement (i.e. setting aside for that new roof that will be needed within the next several years).
We also have to pay principal and interest on the mortgage - with interest being by far the largest component of our mortgage payment in the early years.
What's left afterwards is ours. We earn our profits on the margin, after these substantial expenses have been paid.
There has of course been enormous variation over the years in how large our cash flow is expected to be, and how it compares to our initial equity investment. Real estate is always not only local, but property-specific. However, the proportion shown is the minimum for what a lender is going to want to see for their coverage ratios, so either the initial cash flow coverage is in at least the range shown, or there is no financing and thus no deal (with many types of financing).
A 20 Year History Of Financing Costs
The cost of mortgage payments is often the number one factor that determines cash flow returns and feasibility. This is because the mortgage cost is such an important part of cash flow, and also because interest rates and property prices tend to bounce up and down much more dramatically than do the other components.
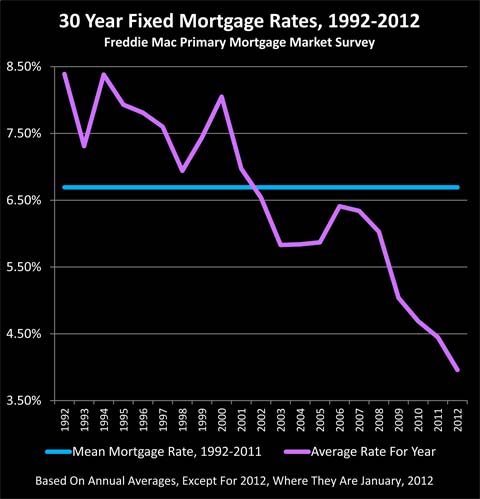
The above is a history of mortgage rates over the last 20 years. Perhaps the most noteworthy feature is the plunge in interest rate levels in recent years - meaning interest costs as a percentage of cash flows have never been lower. The level to which the Federal Reserve has forced interest rates in general - and mortgage rates in particular - is without precedent in modern times.
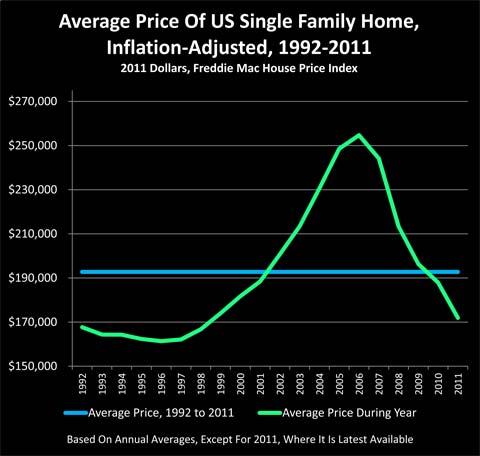
The above graph shows average single family home prices in the US over the last 20 years, as reported by Freddie Mac, and is adjusted for inflation (CPI-U). The two most striking features are the surge in prices that was the real estate bubble - and the plunge in prices since that time.
From the perspective of price speculators, short term fluctuations in real estate prices are everything. Prices still matter for long term cash flow investors, but inflation over time will usually bail them out anyway, so picking just the right purchase and sale dates are not nearly as important. What does determine returns and safety margins is revenues versus expenses, and that means the size of the mortgage payment can be paramount.
When we combine interest rates and inflation-adjusted housing prices we get the next graph, which is inflation-adjusted mortgage payments. This is what matters most for a cash flow investor, and when we combine the plunge in property prices with the plunge in interest rates, we see something rather remarkable.
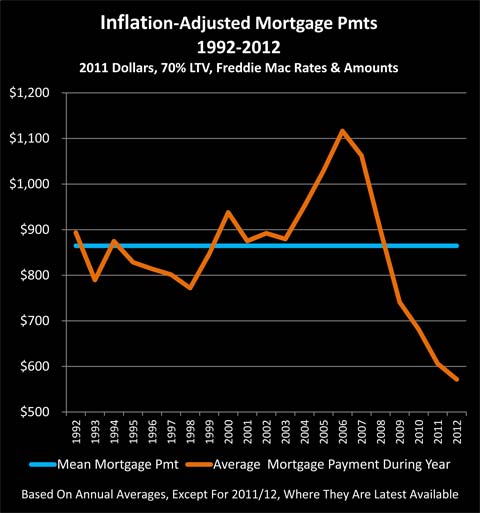
The real estate peak is still there, but it is no longer the most prominent feature on the graph. Instead, it is the extraordinary, historically unprecedented plunge in inflation-adjusted mortgage payments. Indeed, when we combine prices and fixed interest rates - it has never been cheaper to finance a property in the modern era.
(Please note that the preceding graph is about proportions and relative levels, rather than literal average mortgage payments on rental properties. Accessing accurate rental price data on a national basis is problematic as the available few sources are heavily focused on apartments in major metropolitan areas, or have other methodology issues.
Herein, single family homes are used as a proxy in order to get a truly national picture for relative changes in mortgage payments. However, the mortgage payments on an individual rental unit can often be less than half as much as a "normal single family home in the suburbs", sometimes much less. There is enormous variation by state and metro area, location within the area, unit size and amenities. Investment is assumed in a 1-4 unit structure (or larger property conforming to Freddie or Fannie multifamily standards) allowing access to 30 year fixed rate mortgages.)
Since cash flow real estate investing is always on the margin, let's take a look at what happened at the peak - and compare to the very different conditions today.
Real Estate Bubble & Cash Flow Investing
The following graph takes a look at investment conditions at the peak of the real estate bubble in 2006. Property prices were skyrocketing around the nation, and in a number of metropolitan areas prices had reached the economically irrational point where the average worker couldn't even come close to affording the average home, not without a short term teaser rate and/or a whopping down payment that came from the sale of their previous home.
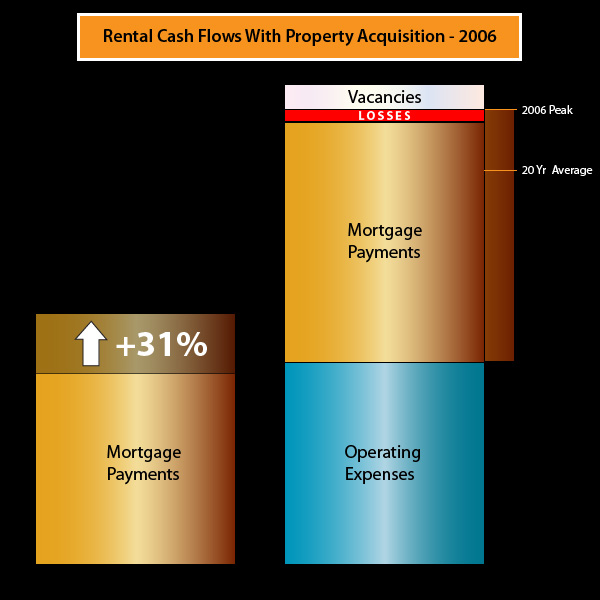
Even though interest rates were quite low on a historical basis (which is part of what created the bubble), the rapid spike in housing prices created a spike in mortgage payments for those acquiring rental properties. However, even while housing prices swiftly grew ever more economically irrational - rents by and large remained rational, as there were no subprime teaser rate financings for renters. Instead they had to come up with the cash every month, which meant they needed the real income.
When it came to mortgage expenses, as shown on the left side of the illustration, those investors using fixed rate financings saw their costs rise by a national average of 31% per unit.
But the rents didn't even come close to keeping up. So as we can see on the right side of the illustration, the increase in mortgage payments consumed 100% of investor cash flow and more, turning cash flows negative.
The irrational surge in property prices entirely consumed the margins, forcing cash flow investors from the markets, even while real estate "investment" in the mind of the public became synonymous with price appreciation speculation. This destruction of the rational basis for real estate investment (in some markets) was one of the many "canaries in a coal mine" that were singing away at full volume by 2006.
Cash Flow Investing In The Current Market
The one-two combination of falling interest rates and falling property prices has slashed the cost of mortgage payments today, with a total inflation-adjusted reduction of 49% over a five year period. As we can see in the left side of the illustration below, this not only reduced financing costs below the 20 year average, but kept on going down to a record low.
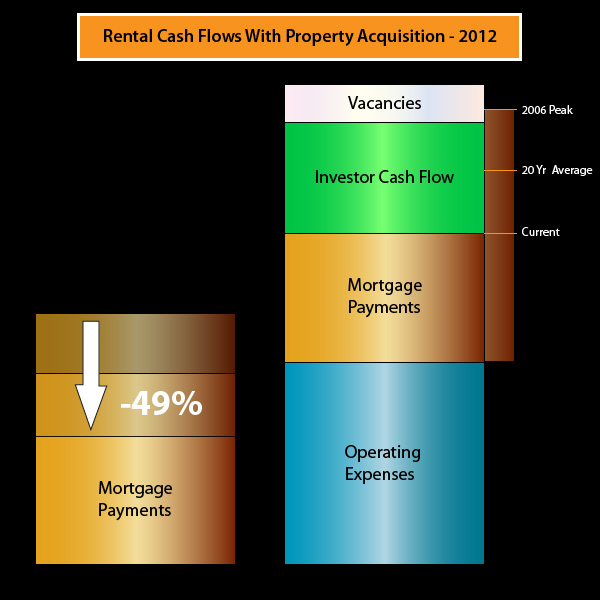
However, rents have not gone down, indeed they are rising around the nation.
Since cash flow real estate investment is done at the margin, this means that the benefits of the plunge in financing costs are going straight into the pockets of cash flow investors. The amount of cash left over after expenses has more than doubled. And the sheer size of that fat green bar of available owner cash flow is unprecedented.
In these yield-starved times, that should be of keen interest to many investors, but what is of even greater interest is that the increase in yield is accompanied by an increase in safety - which is the direct opposite of how return and risk work with most investments.
Many people think in simple asset price terms, and with most investments that are based on price - the higher that prices soar, the more the asset is moving away from its long term average value, and the greater the eventual crash, whether we are talking about real estate, tech stocks or tulip bulbs. The better that things look, and the more enthusiastic the investors - the more likely there will eventually be an unfortunate ending.
When long-term, fixed rate mortgages are used, the cost of financing can be locked in at purchase or in a refinancing. This locks in the spread with rental income, so long as rents do not drastically deteriorate. Rents and operating expenses each rise with inflation, while the mortgage payments do not, and that fat green bar at the margin gets a little larger each year.
Locking In Safety Margins
As an illustration, let's say that with a given amount of debt (loan to value), and an average property purchased with an average mortgage (over the last 20 years), that with expected rents and vacancies, we expected at closing to have $1.20 in cash flow for every $1.00 in expenses, so we expected a 20% coverage margin, or safety margin.
In 2006 - it was 95 cents in cash coming in for every dollar going out in expenses, so we may have sat out investing in some metro areas for a while.
Now, because of the Federal Reserve's massive and unprecedented actions in forcing interest rates far below free market levels, inflation-adjusted mortgage payments have plunged and thereby dramatically dropped our entire cost structure - but rents have not plunged - so we expect to have $1.45 in cash flow for every $1.00 in expenses. We have a 45% coverage margin.
We lock what is very unusual about the expense structure today - an interest rate distortion that would not exist except within the extraordinary ongoing financial crisis - and we lock it in when we close on the property and mortgage. The 45% safety margin is there from that day forward.
Between national, area and property-specific fluctuations in vacancies, rents and operating expenses, history is full of real estate investments burning through anticipated 20% safety margins and going cash flow negative. As with any investment offering potentially lucrative returns, there are always risks. However, the combination of negative events hitting at the same time to burn through a 45% safety margin on a sustained basis is statistically far less likely than the probability of the combination of negative events needed to burn through a 20% safety margin. So the increase in safety margin is actually likely a good bit greater than the simple comparison of 45%/20% might look at first glance.
In the theoretical world of academic finance, one is most emphatically not supposed to be able to do this. The free market is supposed to prevent this, an investor should not be able to double returns while doubling safety margins. We should most particularly not be able to do this in a yield-starved environment.
But this opportunity does exist specifically because there is no free market in interest rates. This is one of the ways to arbitrage a government that is cheating its own savers and retirees out of the interest rates they would get in a free market. Which means it is also the essence of self-defense against irresponsible government actions.
Supply, Demand, Rents & Vacancies
The unprecedented low cost of mortgage payments in inflation-adjusted terms is not the only rental market factor moving to increase the amount of money available on the margin to investors. There are four other key factors that affect the margin - and all four are currently moving in the favor of cash flow real estate investors.
1) Increasing Demand. According to the Census Bureau, the maximum rate of home ownership in the US peaked between 2004 and 2007, reaching at least 69% in one quarter each year. By the 4th quarter of 2011, this number had fallen to 66%.
Now, if we turn the numbers around, the percentage of the population needing a place to rent went from 31% to 34% between the housing bubble and today. This means there has been an increase of 10% in demand (and more than that when we include population growth).
There is a basic shift that has been occurring as home ownership decreases while rentals increase. This shift strongly favors real estate cash flow investors.
2) Decreased New Construction. The number of new construction rental units becoming available each year remains at near-record lows, along with single family housing starts and construction sector employment. This could be changing soon in some metro areas, as new multifamily housing construction began to surge in the second half of 2011. However, this is a surge from a very low floor, as overall bleak conditions in the housing sector have prevented what would otherwise be a flood of new units responding to increased demand, low interest costs, falling vacancies and rising rents.
3) Decreasing Vacancy Rates. Also according to the Census Bureau, the rental vacancy rate for the nation as a whole, including single family homes that are available for rental, fell from a peak of 11.1% in 2009, to 9.4% by the 4th quarter of 2011, a decrease of 1.7%.
When we look just to apartment vacancies in major metropolitan areas, then the vacancy rate fell to 5.2% by the fourth quarter of 2011, according to property research firm Reis, Inc. This was down from a peak of 8% at the end of 2009. Vacancy rates are down to 2.4% in New York City, and 3.6% in San Francisco, according to "The Economist" magazine.
This decrease in vacancy rates is exactly what we would expect given that there is an increasing demand for units, and construction is still lagging compared to historical averages, and the benefits go straight to the margin - resulting in increased owner cash flows.
4) Rising Rental Income. According to Reis, apartment rents rose by 2.3% during 2011. Expectations in 2012 are for increases that are potentially well above the official rate of inflation in some major metropolitan areas such as Seattle and Washington, DC.
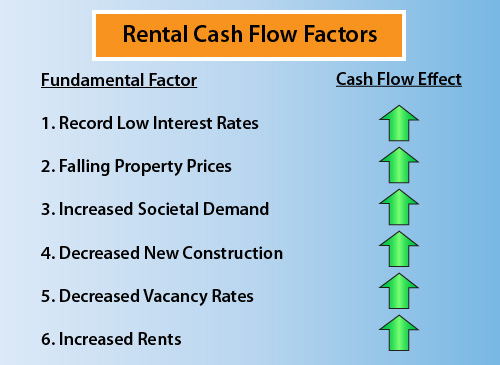
Putting it all together and as shown above, we are currently in the extraordinary place where six factors are working together to increase the margin that is owner cash flows.
An Unparalleled Opportunity
I structured my first closed multifamily financing in 1983 within a few months of finishing graduate school. Over the two decades that followed, working first as a financial analyst, then an investment banker and later as an independent quantitative analyst, I structured closed financings for many thousands of rental units around the nation, for clients ranging from private investors to Trammell Crow and state housing finance agencies. I also wrote a couple of books about mortgage securitizations and derivatives in the 1990s, that were published by McGraw-Hill (and subsidiary).
And in all that time, and all those deals, and all those endless computer printouts of cash flows and debt service coverage ratios - I never saw anything like the current situation.
Many people are so focused on prices and the headlines that they are failing to see the bigger picture.
Yes, the market is terrible, but prices aren't actually that low when we take a long term perspective. In inflation-adjusted terms, prices (for comparable properties) were lower through most of the 1980s and 1990s.
Prices had to be lower back then because interest rates were much higher, and the only way one could get the cash flows to work was to pay less per unit in inflation-adjusted terms.
The truly remarkable development is the back door that the Federal Reserve has unintentionally opened for individual investors, while trying to cope with the aftermath of the long series of mistakes committed by the Federal Reserve itself, Wall Street, the mortgage banking industry, and the federal government.
The Federal Reserve has directly and openly manipulated interest rates in general - and the mortgage market in particular - resorting to the direct creation of money out of the nothingness on a massive scale when necessary, specifically to make sure that mortgage interest rates are well below free market levels.
While this policy of deliberate and massive market manipulation steals from many millions of people - it gives with both hands to others.
For retirees, retirement investors and the pension funds who were depending on the payment of market interest rates - this is a policy of theft. Deliberate government choices and interventions are keeping yields below the real rate of inflation, as I have written extensively about in my series on Financial Repression (linked here). The price is being paid every day by millions of people when it comes to their standard of living or their ability to ever retire.
The main beneficiaries of this largesse from the Federal Reserve is the Federal government (deficits would be far higher with market interest rates), Wall Street, private equity firms, and other privileged insiders.
However, a more or less accidental side effect of this massive manipulation is the giving with both hands to real estate cash flow investors.
Seeing Both Halves
Indeed, the Federal government interventions over the last 10 years have had 180-degree-different results for short term price appreciation investors versus cash flow investors. Federal government market distortions in multiple areas helped feed the rise in real estate prices that created short term sizzling yields for price investors, even as the cash flow market was put in the deep freeze.
On the flip side, the market which since 2006 has been ruinous for many real estate price investors, has had the 180 degree opposite effect for cash flow investors, creating what looks to be the best environment for real estate cash flow investment in our lifetimes.
Those who lump short term price speculation together with long term cash flows into one "Real Estate Investment" category (and much of the general public does), will never see this opportunity, because they can't see the two distinct halves. However, those who can look beyond short term price fluctuations and see the bigger picture will see something entirely different: an accidental by-product of massive government manipulations which offers potentially lucrative cash flows in a yield-starved world.
Now don't get me wrong - long term cash flow investors want to see eventual price appreciation every bit as much as short term speculators. That's the "kick" that delivers what many investments don't - not only potentially better cash flow in the interim which rises with inflation, but a potentially massive gain on the back end.
And the good news when we look at the inflation-adjusted housing prices graph is that real estate is available at the lowest prices since 1998. Which means the chances for maximum price appreciation are the greatest in 14 years as well, when the market eventually normalizes in some future year.
In closing, I'm going to repeat two extraordinary graphics, of a situation - and an opportunity - that we have never seen before.
And may never see again.
 What you have just read is an "eye-opener" about one aspect of the often hidden redistributions of wealth that go on all around us, every day.
 A personal retirement "eye-opener" linked here shows how the government's actions to reduce interest payments on the national debt can reduce retirement investment wealth accumulation by 95% over thirty years, and how the government is reducing standards of living for those already retired by almost 50%.
 An "eye-opener" tutorial of a quite different kind is linked here, and it shows how governments use inflation and the tax code to take wealth from unknowing precious metals investors, so that the higher inflation goes, and the higher precious metals prices climb - the more of the investor's net worth ends up with the government.
 Another "eye-opener" tutorial is linked here, and it shows how governments can use the 1-2 combination of their control over both interest rates and inflation to take wealth from unsuspecting private savers in order to pay down massive public debts.

If you find these "eye-openers" to be interesting and useful, there is an entire free book of them available here, including many that are only in the book. The advantage to the book is that the tutorials can build on each other, so that in combination we can find ways of defending ourselves, and even learn how to position ourselves to benefit from the hidden redistributions of wealth.