


The Calculation Of Constant Workforce Participation Unemployment
By Daniel R. Amerman, CFA
(This a technical supplement, the more general main article which this supports can be found here.)
To properly interpret government employment statistics as reported by the Bureau of Labor Statistics, one has to understand that an individual who wants a full-time job but doesn't have one, can be placed into one of four different categories.
- Official "headline" U-3 unemployment. These people are unemployed for headline U-3 purposes, are defined as being in the labor force, and are counted both in the U-3 statistics and the U-6 statistics.
- Involuntary part time workers. These people are defined as in the labor force, and are counted as employed in the U-3 measure, but are counted as unemployed in the U-6 measure.
- Discouraged and other "marginally attached" workers who want jobs but do not have jobs. They are defined as not being in the labor force for U-3 purposes, so are not counted in any way for headline U-3 unemployment, but they are tracked on a monthly basis for U-6 unemployment.
- People without jobs who do want jobs but have been completely removed from the labor force. They are defined as not in the labor force in any form, so they don't appear in U-3 and they also don't appear in U-6.
Indeed, this fourth category doesn't appear at all in any employment measures, so the only way to find these people is to track and reconcile the government numbers, looking for the disappearances (or the failure to appear in the first place based on historical norms for age groups), and determining which part of the workforce participation change is inside of U-6, and which part is not.
In theory, the fourth category isn't supposed to exist - but this is also where the truly odd things have been happening and are continuing to happen.
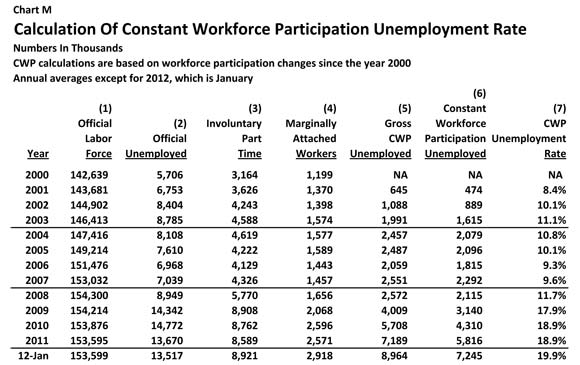
The chart above deconstructs and reassembles the government database to make very clear what has happened with each of the four ways of counting jobless people since the year 2000. The first three columns are the Official Labor Force, Official Unemployed and Involuntary Part Time workers. Column (4) is Marginally Attached Workers, and it can be found by subtracting Involuntary Part Time Workers from total U-6 unemployment.
Column (5) starts with the total civilian population aged 16 and over that isn't institutionalized, and looks at how much higher the labor force would have been if workforce participation rates had remained constant at 2000 levels. This is compared to the current official labor force, and the difference is the running total of Gross Constant Workforce Participation (CWP) unemployment.
However, some of these people can already be found in the Marginally Attached Workers column. Subtracting the cumulative total of changes to Marginally Attached Workers (since 2000) gives us a running total of those removed from the workforce (assuming constant participation) who are not accounted for in any way within the U-6 statistic.
This net cumulative total becomes Column (6), Constant Workforce Participation unemployment - and as can be seen, it is where most of the labor force reduction has been "parked". It has grown significantly, and contains 7.2 million out of the incremental 9 million person reduction in the labor force since 2000.
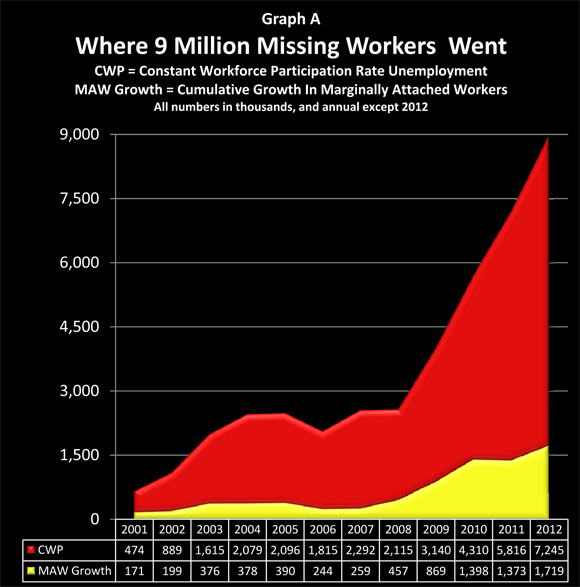
As can be seen graphically above, the CWP [Column (6)] has been diverging from the growth in marginally attached workers [cumulative growth in Column (4)] with particular speed since 2009. The graph is an area graph, which adds both components together, producing column (5). The rate of change from 2009 through early 2012 has been extraordinary.
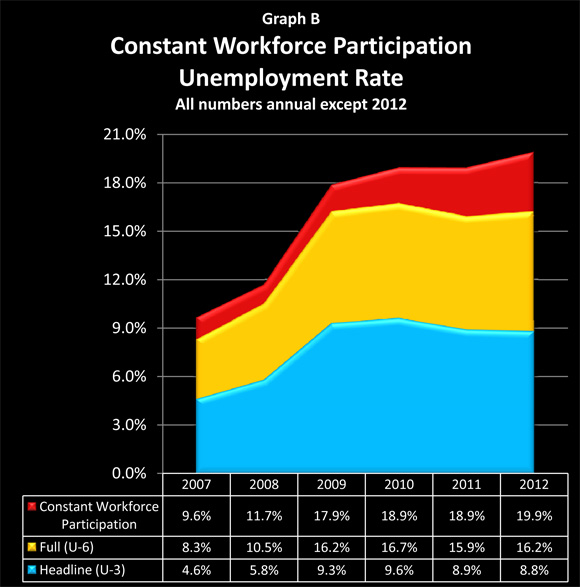
When the CWP is added to the existing Bureau of Labor Statistics equations, we get the Constant Workforce Participation unemployment rate shown in Column (7).
The Unemployment Equations
The equations for the calculation of the three unemployment rates are as follows.
U-3 Unemployment Rate = (LF - E)/LF = OU/LF
(LF is Labor Force, E is people who are categorized as Employed in the U-3 definition, and OU = Officially Unemployed.)
U-6 Unemployment Rate = (OU + IPT + MA)/(LF + MA)
(IPT is Involuntary Part-Time workers, and MA is Marginally Attached workers. Because the Marginally Attached workers are defined as not being in the labor force, they need to be added back to both the top and bottom of the equation.)
CWP Unemployment Rate =
(OU + IPT + MA + CWP) / (LF + MA + CWP)
(CWP is Constant Workforce Participation workers, and since they are also outside of the official definition of the labor force, these jobless people also need to be added back in on both top and bottom when they are "returned" to the labor force for unemployment calculation purposes.)
CWP Calculation For January, 2012

As shown above in Chart G (from the main article), the non-institutionalized 16+ civilian population as of January 2012 was 242,269,000. As also shown in Chart D, the change in the labor force participation ratio was a 3.7% decline from 2000 to 2012, and when multiplied by the population, this produces the 8,964,000 in Column (5) of Chart K. Adjusting Column (5) for the cumulative increase in Marginally Attached Workers since the year 2000 of 1,719,000, produces the 7,245,000 net Constant Workforce Participation number at the base of Column (6) in Chart K. When we plug the numbers from each column of Chart K into the CWP Unemployment Rate formula above, we get the 19.9% CWP Unemployment Rate for January, 2012.
Adjustments To CWP
A key question for interpreting CWP is the impact of the aging of the Boomers, and how much of the increase in CWP is "legitimate" and how much is "highly questionable". This is an issue now, and will become a bigger issue in each coming year.
As explored in detail in the main article, it isn't just that CWP has been changing, but that CWP has been changing in a bizarre fashion that is not consistent with the "natural result of an aging population" meme. As developed in the main article, 74% of gross CWP changes since 2007 have occurred among those aged 16-54, rather than 55 and above.
Also as introduced in the main article, there are also reasons to believe that CWP for those aged 55 and above may be higher that what is shown in the government statistics.
This is an issue I hope to explore in more detail in the future, and at some point CWP will need to be modified as the aging Boomers become an ever more dominant factor. For now, however, the major conclusions still all stand even if the 26% change in CWP that is found among those aged 55 and up were removed.
Given that government statistics strain belief when it comes to the assertion that only person in a thousand between 55 and 64 is changing their retirement behavior as a result of the ongoing global financial crisis, the best approach for now is likely to keep CWP unadjusted (and thereby avoid adding another level of complexity). "True" CWP is just as likely to be higher than lower, when all age-related factors are included.
A substantial amount of time went into the analysis contained in the main article, and the February data has now been released as well. The CWP measure provides a quite different tool for understanding what happened beneath the surface in the February workforce and U-6 numbers. These developments will be covered in a later analysis.
For those who would like to keep track of Constant Workforce Participation, and an alternative perspective on other financial and economic issues, a free article subscription is available below.
 What you have just read is an "eye-opener" about one aspect of the often hidden redistributions of wealth that go on all around us, every day.
 A personal retirement "eye-opener" linked here shows how the government's actions to reduce interest payments on the national debt can reduce retirement investment wealth accumulation by 95% over thirty years, and how the government is reducing standards of living for those already retired by almost 50%.
 An "eye-opener" tutorial of a quite different kind is linked here, and it shows how governments use inflation and the tax code to take wealth from unknowing precious metals investors, so that the higher inflation goes, and the higher precious metals prices climb - the more of the investor's net worth ends up with the government.
 Another "eye-opener" tutorial is linked here, and it shows how governments can use the 1-2 combination of their control over both interest rates and inflation to take wealth from unsuspecting private savers in order to pay down massive public debts.

If you find these "eye-openers" to be interesting and useful, there is an entire free book of them available here, including many that are only in the book. The advantage to the book is that the tutorials can build on each other, so that in combination we can find ways of defending ourselves, and even learn how to position ourselves to benefit from the hidden redistributions of wealth.