


Growing Wealth With Stocks: Expectations vs The New Reality
by Daniel R Amerman, CFA
The number one reason why stocks are a core component of most long-term financial planning strategies is their purported ability to reliably compound wealth over time.
How has this theory been working out in practice?
The world has been going down a vastly different economic and financial path than what many people in the 1980s and 1990s assumed it would. And within this new reality, there is a key question to be asked: how has real-world performance compared with typical projections of what average investors could expect when it comes to the growth in value of their investment portfolios over the long term?
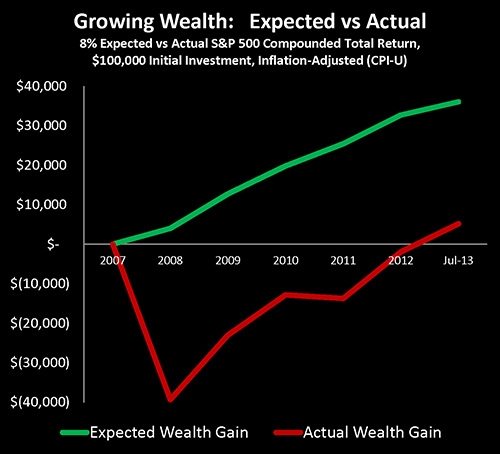
As shown in the following graph and as we'll explore herein, when it comes to growing wealth with long-term stock investments, actual results over the last 15 years - during which time there was a transformation of the fundamentals of the US economy and financial system - have not even come close to measuring up to theory.
Yes, newspaper headlines have been full of US stock indexes finally reaching new highs again, which has been very welcome news for stock investors. However, while short term price movements in stocks are crucial for speculators and short-term investors, price swings over a few years aren't what matters for long-term investors.
What does matter is that tens of millions of hard-working people have in good faith been making contributions to their retirement accounts for years and even decades, based on a theory that stocks will reliably and substantively compound wealth over time. But when we test this theory within our new reality - which this analysis does in three brief and understandable ways - it becomes apparent that theory has not been working in practice with our new economy and financial system.
First, we will compare nominal versus real (inflation-adjusted) stock index results over a 15 year period, using the S&P 500. We will find an interesting similarity to the 1970s, with a series of what appear to be roughly similar nominal highs, but which turn out to be false highs when adjusted for inflation.
Second, we will concentrate on the effects of the Financial Crisis of 2008, as we look at wealth compounding (including dividends but exclusive of fees) from the end of 2007 through July 1, 2013, on both a nominal and inflation-adjusted basis. We will see that on an inflation-adjusted basis, using real market data and official inflation rates, that there has been an 86% failure to perform. Which is a rather sobering contrast to the current market excitement about all new highs.
Given that the time period since the end of 2007 is relatively short, however, and because a number of fundamental changes to the US economy and financial system actually began in the mid to late 1990s, we will then explore the difference between expected wealth compounding and actual wealth compounding over the past 15 years. Here we find that even over this much longer period since the end of 1997, with multiple cycles - there has been a 65% failure to perform when it comes to using stocks to compound wealth on an inflation-adjusted basis.
In other words, almost two thirds of the new wealth that stock investment was on paper supposed to create for society on a quite reliable basis (according to leading financial theories) over the last 15 years has simply failed to materialize in practice, with powerful implications for the retirement plans of many millions of people, as well as for the financial health of pension plans and their sponsors around the nation.
In better preparing for the future, there is no substitute for a better understanding of the past and the present.
Index Performance & Adjusting For Inflation
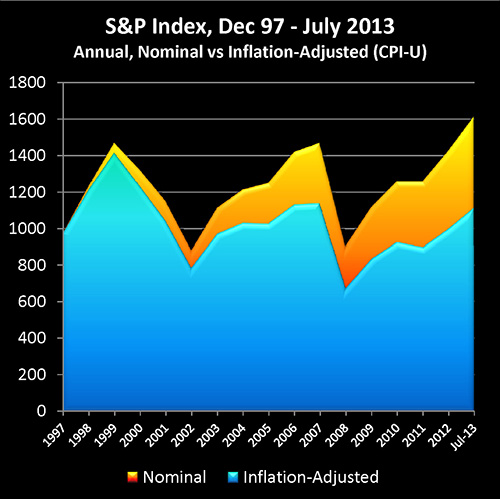
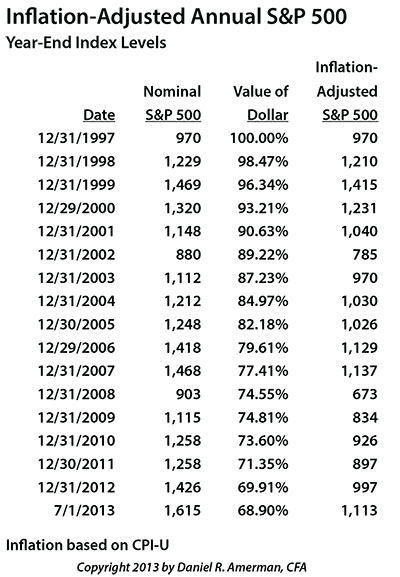
The graph below shows a very simple comparison between using nominal (non-inflation adjusted) figures for the S&P index, versus adjusting the index for inflation. Prices are as of the end of each year, with the exception of the July 1, 2013 data point.
(Annual figures are used to ensure compatibility with the annual total return-based analyses that follow; the six month ending data point was used to fully capture the rising stock market of the first half of 2013.)
As is sometimes the case, the triumphant new stock market highs that are announced in the headlines (shown in blue), in reality translate to the steady destruction of the dollar once we adjust for inflation (shown in orange).
Without adjusting for inflation and using annual year-end figures, the S&P 500 moved from 1,469 at the end of 1999, to 1,468 at the end of 2007, to a high of 1,615 by July 1, 2013.
But when we adjust for inflation (based on the CPI-U as calculated by the US Bureau of Labor Statistics, with 12/1997 equaling 100%), the S&P 500 ended the year 1999 at 1,415, moving down to a value of 1,137 by the end of 2007, and moving down a bit further to 1,113 as of July 1st, 2013.
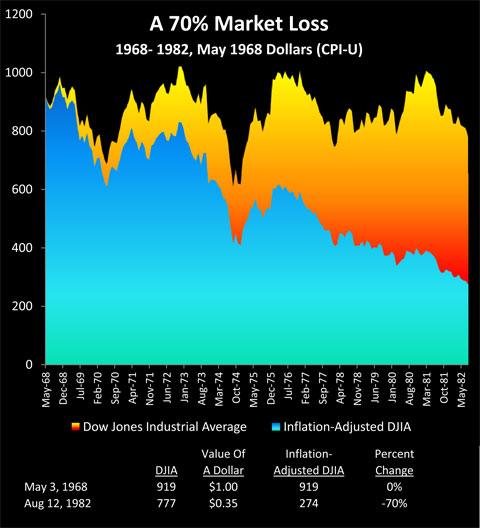
The highs of the last 15 years and the public treatment of them are rather reminiscent of the series of stock market highs of the 1970s and early 1980s, as the market kept breaking through 1,000 on the Dow Jones Industrial Average, attempting to decisively break into new territory, only to fall back again. Until we adjust for inflation (as shown above), and find that the rolling series of "highs" was concealing a major break to the downside that eliminated 70% of stock market wealth in purchasing power terms.
The false highs during the recession and unemployment-plagued 1970s have a good deal of potential applicability to today's markets. The full text of my analysis on that can be found at the link here.
Of course, one difference is that the official inflation rate was much higher during the 1970s and early 1980s than it currently is. It should be noted, however, that inflation was calculated in a different manner at that time, and using a 1970s inflation measurement methodology would result in lower inflation-adjusted prices for the more recent S&P 500 "peaks", albeit not to the full extent of the 1970s.
Compounding Of Wealth Since 2007
Our next analysis is both unusual and essential, as we look at stock market performance (using the S&P 500 as a proxy) and compare it to expectations within a financial planning type model. When somebody invests in stocks for decades in the expectation that they will have a very high probability of enjoying a comfortable retirement, their source of assumed security is not so much the movements in the prices of stocks, but much more importantly the total returns from stock investing and a long-term compounding of wealth.
For total return on an annual basis, we need to include dividends as well as annual price movements in the index. In general terms, this should strongly increase performance over time, as well as help smooth out any fluctuations caused by changing prices.
Many different assumptions have been used for what is a reasonable long-term expectation for stock performance, and a common assumption for decades has been the expectation of about an 8% rate of return. This was indeed a bit conservative for some, given that long-term academic models showed about a 10% long-term rate of return through most of the 20th century.
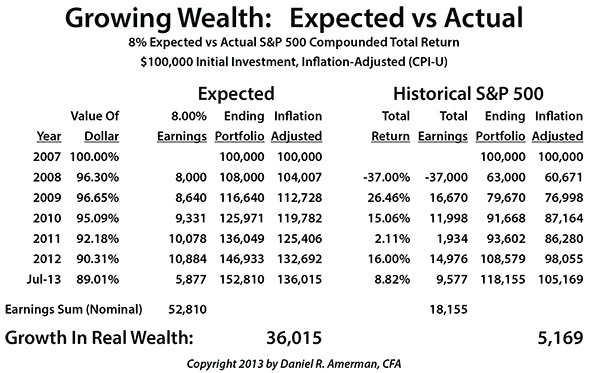
As shown in the table, we start with an assumption of $100,000 invested as of the last day of 2007. The earnings column shows 8% annual earnings on our ending portfolio balance. So the expectation is that we start with $100,000, we earn a total return (on average, over time) of 8% or $8,000, and that gives us an portfolio balance of $108,000, as we end the year 2008. We then earn our 8% return on our $108,000 balance in the next year (2009), which leads to earnings of $8,640, and an ending balance of $116,640, as the compounding of our wealth slowly starts to kick into gear.
There is the separate important question of how much money we have, versus what our money will buy for us, and that depends on the purchasing power of the dollar. So in the model we adjust each year's portfolio balance for the purchasing power of a dollar in that year, based upon the CPI-U measure of inflation from the US Bureau of Labor Statistics. (It is this use of uneven actual inflation statistics that creates a somewhat kinked green expected wealth line in the graph, which would be smooth with even inflation.)
Between the end of 2007 and July 1, 2013, if an investor had earned the expected 8% total return on their stock investments with annual compounding, their ending portfolio balance would have been $152,810. So their wealth would have grown by $52,810.
Once we adjust for inflation, per official government inflation statistics, then the ending balance is $136,015, meaning about $36,000 in real new wealth would have been created.
Now when we look at actual returns, the Standard & Poor's 500 index lost 38.47% of its value in 2008. This was partially offset by dividends earned, leading to a total return for the year of -37%. As shown, this means an investor who started with $100,000 would've ended with $63,000 in their portfolio, which when adjusted for inflation would be worth $60,671.
As the S&P 500 recovered, climbing over the next 4.5 years until all nominal price losses had been offset, the portfolio would have reached a balance of $118,155 by July 1, 2013. This total return fully incorporates all price movements as well as interim dividend payments and the reinvestment thereof.
This then is an $18,155 increase in nominal wealth. When we adjust for inflation (again per the US government), over 5.5 years our portfolio grew from $100,000 to $105,169, which is an increase in real wealth (in terms of purchasing power) of $5,169. So when we compare theory to fact, the stock market underperformed by 86% when it came to creating wealth ($5,169/$36,015 = 14%).
There has been this meme in the media that now that the S&P 500 and Dow Jones Industrial Average are reaching all new nominal highs, having recovered the losses from the severe bear market of 2008, that everything is good again. Investors are purportedly whole again, and stocks have regained their status as a reliable long-term investment.
The return of stock indexes to their former nominal highs and beyond has been very encouraging for the many millions of people who have substantial weightings of stocks in their investment portfolios. However, getting back to "even" (before accounting for inflation) was never the idea behind why the average person was so strongly encouraged to invest in stocks in the first place.
Stocks are supposed to reliably create substantial wealth. That is why people purchase stocks – for the purported ability to grow wealth over the long term on a reliable basis.
And as a reality check, however, only 14% of expectations were met when it came to the creation of new wealth for investors.
While useful for gaining a better understanding about stock wealth creation performance since the start of the Financial Crisis of 2008, 5.5 years is too short of a period to genuinely gauge reliability when it comes to long-term performance. So our next analysis takes a look at a much longer 15 year return, as we compare expectations to historical reality.
Compounding Of Wealth Over The Longer Term
To better gauge actual stock performance versus common financial planning assumptions, we need time - and lots of it. Time is what smooths out short-term price movements in stocks. What is sometimes not understood by the average investor is that when we get inside the mathematical engine that drives the computer models, it is the receipt and reinvestment of dividend payments, year after year, that smooths out the risks (in theory) and produces most of the compounding and wealth. And that takes time.
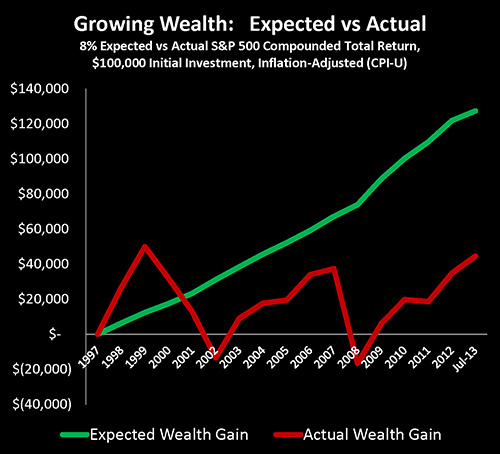
In this next graph, we again start with the assumption of a $100,000 beginning portfolio, but we assume that investment starts at the end of 1997 instead of 2007. So we have a full 15 years of investment results, plus an additional 6 months to capture the surge in stock market values that occurred in the first half of 2013.
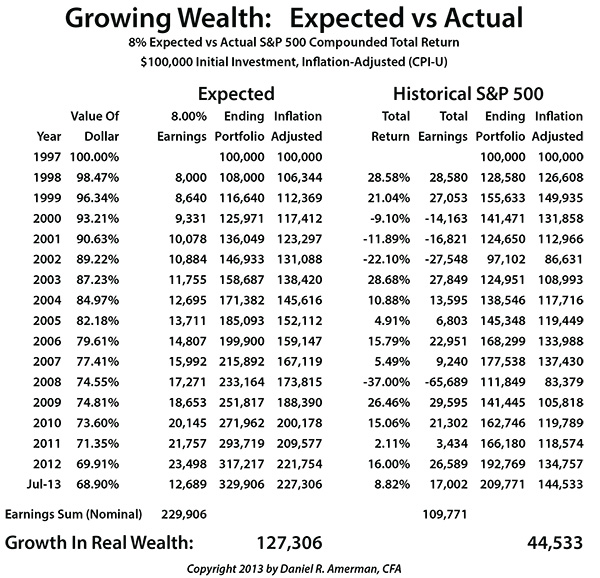
Using the same methodology described for our 5.5 year analysis, and the common expectation of an 8% total return through equity investment over the long term, our $100,000 portfolio at the end of 1997 should have grown to an ending balance of almost $330,000 by the summer of 2013. That is quite a beautiful result over 15 years, and of course what drives it is the mathematical compounding of returns as indicated in the earnings column.
The way the conventional financial models work is that earnings are realized, they are reinvested, earnings are then realized on the reinvestments, and then earnings are realized on the reinvestment of the reinvestments, until (as the theory goes) we have an extraordinary and reliable increase in wealth. This jump in annual earnings from $8,000 in 1998 to almost $24,000 per year in 2012 is what lies "under the hood" of financial planning and long-term investment models.
Our expected increase in wealth is just shy of $230,000, and when we adjust for the official rate of inflation, we should be ahead by $127,306 when it comes to purchasing power (as shown in the green line).
How did theory compare to reality?
The answer is in the red line, which shows the real growth in compounded total return for the S&P 500, adjusted for inflation. The line moves up and down with bull and bear markets, but the most important numbers are to be found in the total earnings column. Over the 15.5 year period, total returns with dividends are positive for 11.5 years, or roughly 75% of the time, and negative for 4 years, or about 25% of the time.
By the time all is said and done, we've a little more than doubled our money in nominal terms, with a portfolio growing from $100,000 to just under $210,000. Which on the face of it, might seem to be just fine for a long-term investment period that includes the growth and collapse of the tech stock bubble, the growth and collapse of the real estate bubble, and the Financial Crisis of 2008 followed by the "Great Recession".
Until, that is, we adjust for inflation.
Whereas an 8% compounded return would have generated an increase in real wealth of $127,306 in inflation-adjusted terms, in using actual market data, our real wealth would have only grown by $44,533 . So in practice, our real return was only 35% of our expected return. In reality, then, when we compare actual results with common assumptions within financial planning models for equity returns, there has been a 65% failure to perform.
To better understand the extraordinary significance of this huge shortfall in the generation of real wealth, we need to put this investment into more personal terms.
The core principles underlying conventional financial planning and long-term investment are time and compounding. We make investments on a disciplined basis for many years. And the sooner we start - the more our investments work for us.
For assumption's sake, let's say we've invested for the past 20 years or so, and we hope to retire in about another ten years or so when we are somewhere in our mid 60s. That means we were somewhere in our 40s in the late 1990s -- a typical Boomer in other words.
Whether it was described to us in those particular terms are not, a "financial miracle" was scheduled to occur for us over these last 15 years. The savings we had been putting away for many years were scheduled to reach the point where the earnings on the reinvestments of the earnings on the reinvestments were to create new wealth in our retirement accounts at a much faster rate than the annual contributions we were making. In the peak couple of decades before retirement, we were supposed to see a compounding of real wealth in our retirement accounts that would take decades of savings, and reliably grow them into a surprisingly substantial portfolio that would comfortably take us through retirement, right on schedule.
For tens of millions of people – "the miracle" never materialized. The compounding of wealth worked out to be roughly only about a third of what we had been told we could reasonably and reliably expect over a long enough holding period. Almost two thirds of the supposedly massive wealth creation that every retirement investor and pension fund in the nation had been told they could rely upon for the future - never came into being.
And most importantly, as we all know – we don't get to rewind those crucial 15 years and try them over again. They happened. We don't get a "do-over", and many of the peak earning (and saving) years in our careers may already only be seen in the rear view mirror. The theory has failed a generation, and absent a fantastic surge in equity prices (another bubble, in other words) we likely won't have time to fully recover from it.
I provide these uncommon analyses not to depress people, but to offer a reality check for what matters the most, which is how to make good decisions from this point forward. Unless we have a clear understanding of the past and present - making good, informed decisions for the future becomes near impossible.
Millions of people are currently in scramble mode when it comes to retirement planning. They are in this mode for the precise reasons explored herein, which is an epic failure to perform when it comes to stocks compounding wealth.
That said, every time we pick up a newspaper, or go to a financial website, we see that stocks are again hitting a new high. Our portfolio may not be at the level we had been hoping for 5 years ago, or 15 years ago, but our account statements may be looking very good indeed compared to where they were in 2008 or 2011.
There may be a strong temptation to say "that train is moving again, and if I'm going to have a shot at getting my retirement plan back on track, I need to get back into stocks in a major way." And there is a possibility that the current "train" could have a good ways to go when it comes to rising stock markets.
However, there is a vast gap between taking a chance that stock market index levels will continue to rise rapidly - and believing a theory that investing in stocks will virtually assure a major compounding of wealth in inflation-adjusted terms over the years ahead. This gap is particularly true when we consider just how much our economy and financial system have transformed over the last fifteen years.
Five Fundamental Changes
Five fundamental changes have transformed the US economy and the US financial system since the late 1990s.
The first change dates back to the mid to late 1990s, as a theory called globalization increasingly gained primacy. Trade barriers were reduced and more goods were purchased from overseas, replacing goods that had previously been made in the United States. The trade deficit exploded within a few years, even as China began perhaps the most phenomenal economic expansion in modern times.
There was a drop in the price of many basic goods – along with a corresponding drop in manufacturing employment -- as entire industries began to move overseas. Much of the retail industry continued to consolidate into national chains of "big box" stores that could buy on a bulk basis from offshore manufacturers, squeezing out many of the remaining local retailers and their middle class owners.
It may be no coincidence that it was during the time period shortly after globalization began to accelerate, that employment growth effectively stopped in the United States. As covered in my article "Making 9 Million Jobless "Vanish": How The Government Manipulates Unemployment Statistics" (linked here), since the year 2000, the number of Americans age 16 and above has risen by 30 million people. Based on workforce participation rates from the 1970s to 2000, about 2/3 of them should have joined the workforce, which means that in a "normal" economy, about 20 million more jobs would need to have been created in order to maintain stable employment levels.
Instead, however, we now actually have fewer full-time jobs than we did in 2000, which means we have over a 20 million job shortfall. Now, government statisticians can play all the definitional games they want in order to report a headline unemployment rate of under 8%, but on a fundamental basis, there is no getting around that 30 million more people of employment age - combined with no new full time jobs on a net basis - means that a massive change has in fact occurred at the very foundation underlying both society and the economy.
During this same time period, the financial regulations that had been in place since the 1930s, such as Glass-Steagall - regulations that were intended to put restraints on financial institutions - were in large part stripped away. Major banks were now more free than they had been since the 1920s to take massive financial risks in the pursuit of corporate profits and individual bonuses. This was also the same time (by no coincidence, I would argue) that we saw the explosive growth in the derivatives markets.
It was in this time interval as well that we saw the US financial system become increasingly dominated by bubbles growing and then popping. We had the tech stocks bubble that grew massively and then popped. This was replaced by a real estate bubble that soared upward, popped and nearly took the nation's economy down with it, with the damage being compounded by the risky games being played with derivatives on the part of major banks in the search for short-term profits and bonuses.
The fifth fundamental change was the expanding role of the United States government and the Federal Reserve, in the form of damage control. Deficits exploded, as an ever larger share of the national economy grew dependent upon government spending. To contain the financial damage, the Federal Reserve began creating trillions of dollars out of the nothingness, while manipulating interest rates downward to near zero levels.
So when we look at these five major changes in combination, we can see that a powerful, near complete transformation of the US economy and financial system has occurred over the last 15 years.
Now if we accept this new reality of a fundamentally transformed economy and financial system, a question to ask is, how good a predictor have stock market results from the second half of the 20th Century turned out to be? Can we indeed just take the past, project it forward, and assume that historical stock returns will endlessly and reliably reproduce themselves over the long term?
As found in the three different tests herein, real-world financial results of the past 15 years do not support this claim. To the contrary, there has been relatively little compounding of wealth when compared to historical levels. Instead, there is in fact a market that is moving more or less sideways, with a vastly reduced compounding of wealth rather than reliably growing over time.
This lack of performance is particularly crucial when we consider the downward drag of fees and taxes, which are not included in the analyses. There is also the issue of the methodology of how inflation rates are calculated, which like the calculation of unemployment rates, have been a moving target over the last several decades. If we include financial fees and taxes, and we move the real inflation rate up just a percentage point or two to come closer to how inflation was calculated in the 1970s and 1980s - then it is a short journey to get to the point that there has been no real wealth compounding at all, but rather there have been negative returns over the last 15 years in after-tax and after-inflation terms.
The Compounding Of Wealth
As has been well understood for centuries, when it comes to the short term - stock investments can be lucratively profitable, and they can also hold major risks. We all take our chances.
In recent decades, however, a quite different theory of stocks has become prevalent, as has a quite different rationale for average investors buying stocks. The theory is that with a sufficiently long investment horizon, there will effectively be a "free lunch" with stock investments (more technically known as an "equity premium"), where the risk drops out and the superior returns remain, when compared to other asset classes.
One of numerous problems with this theory is we are in a very different world than we used to be. This is true of society, this is true of culture, and this is true of technology. We live in a globalized world where US employment effectively stopped growing 20 million jobs ago, where financial risks to the system are far higher, and where the economy depends on deficit-financed massive government spending, even as the markets are driven more by the degree of Federal Reserve interventions than they are by free market fundamentals.
This is an upside down world when compared to the world of the previous century. And when we take a close look at stock investment performance in real terms since this last round of major changes transformed our economic and financial system – the strongly positive results simply haven't been there like the theory said they would be.
Classic financial planning is based on a mixture of primarily equity investments, fixed income investments and a few alternative investments thrown in as well. We're supposed to get a fair market return on our bonds and other interest-bearing investments that will compound wealth for us over time with lesser price risk. We're supposed to get higher returns with our stock investments, albeit accepting somewhat greater year-to-year price risk. So we follow the classic formula of the Investment Life Cycle: we start stock-heavy, and we slowly shift to bonds over time until we build enough wealth where our bond interest payments will comfortably and reliably support us in retirement.
That's how it's supposed to work.
Instead, we are in an environment where due to direct and massive government interventions which are being used to override market forces, interest rates are some of the lowest they've been in history. So the long time theory that fixed income investments will compound wealth and reliably generate sufficiently significant interest payments to comfortably support our retirement is not working out for many tens of millions of people.
At the same time, instead of reliably compounding wealth, stocks are strongly underperforming on an inflation-adjusted basis when it comes to prices, even as dividend levels are some of the lowest in history. That lack of real price appreciation and low dividend levels in combination also means that stock wealth is not substantively compounding as expected.
So, neither of the two pillars of reliably growing substantive new wealth using classic long-term financial planning strategies - neither stocks nor interest payments - has been working in practice in our new reality. And the real world results are changing daily lifestyles for current retirees, and moving back the planned retirement age for large numbers of people.
There is a truism about military history, which is that generals (and nations) have at times been surprised by losses in the initial battles of a new war, because their strategies are based on successful ones from previous wars. The world changes. So what on paper should have produced brilliant victories had the previous war been fought again - instead become devastating and unexpected losses in the new reality of a new war being fought under very different conditions.
This is an apt analogy for long-term investing today. All around us, tens of millions of people are following investment strategies for compounding wealth that are based upon the economy and financial system of previous decades. On paper, these strategies can appear to work great - if only the past would continue to repeat itself.
Except that the world, the economy and the financial system have changed. In practice, then, we have a huge failure to perform when it comes to the compounding of stock wealth in real terms, as well as the ability to use interest payments to support a retirement lifestyle.
We can accept a new reality, strive to understand that reality, and seek out quite different strategies for a very different time in the world. Or we can continue to invest in yesterday's world, based on a theory that hasn't been working out too well for quite a while now. The choice is each of ours.
 What you have just read is an "eye-opener" about one aspect of the often hidden redistributions of wealth that go on all around us, every day.
 A personal retirement "eye-opener" linked here shows how the government's actions to reduce interest payments on the national debt can reduce retirement investment wealth accumulation by 95% over thirty years, and how the government is reducing standards of living for those already retired by almost 50%.
 An "eye-opener" tutorial of a quite different kind is linked here, and it shows how governments use inflation and the tax code to take wealth from unknowing precious metals investors, so that the higher inflation goes, and the higher precious metals prices climb - the more of the investor's net worth ends up with the government.
 Another "eye-opener" tutorial is linked here, and it shows how governments can use the 1-2 combination of their control over both interest rates and inflation to take wealth from unsuspecting private savers in order to pay down massive public debts.

If you find these "eye-openers" to be interesting and useful, there is an entire free book of them available here, including many that are only in the book. The advantage to the book is that the tutorials can build on each other, so that in combination we can find ways of defending ourselves, and even learn how to position ourselves to benefit from the hidden redistributions of wealth.