An Evidence-Based Look At Inflation, Recessions And Pivots
By Daniel R. Amerman, CFA
TweetAs we enter 2023, there are widespread hopes that inflation will be vanquished, and that interest rates will fall rapidly as the Federal Reserve "pivots". If the Fed goes down this path, there are expectations that the markets will soar upwards this year as they recover from 2022.
There are also many prominent people, such as Elon Musk, arguing that the Federal Reserve has pushed interest rates upwards too fast and too hard. This perspective is shared by many housing investors. They believe that the Fed is creating problems rather than fixing them, through being overly aggressive.
What makes this debate interesting is that it is mostly among people who have never personally experienced high rates of inflation in their professional careers, and they are strongly arguing about what makes sense to them - in a situation that is new for them.
In this two-part analysis, instead of theorizing about what could happen in a novel situation, we're going to analyze what actually happened the last time the United States was struggling with sustained high inflation. The period from 1968 to 1983 included sixteen years of the Federal Reserve, under the leadership of four different Fed Chairs, experimentally trying different methods for slaying the inflation dragon. We have the evidence - there were four recessions, there were three pivots, and we can track their actual relationships with inflation and interest rates in practice.
We have the data, even if almost no seems to be talking about it. What this data shows is a relationship between inflation, interest rates, recessions and pivots that is almost entirely different from what is being discussed in the financial media, or financial social media. Based on that data - there is a very good chance that 2023 will work out in a quite different way than the markets are expecting.
This analysis is part of a series of related analyses, which support a book that is in the process of being written. Some key chapters from the book and an overview of the series are linked here.
How It Started
 Our last secular cycle of high inflation was a very unpleasant time for markets and investors, with the Dow Jones Industrial Average losing 70% of its inflation-adjusted value between 1968 and 1982, as explored in the analysis linked here. Sequence of returns risks (link here) meant stock-heavy investors who retired during that time faced what were sometimes catastrophic reductions in the standard of living they experienced in retirement, relative to what they thought was almost assured for them.
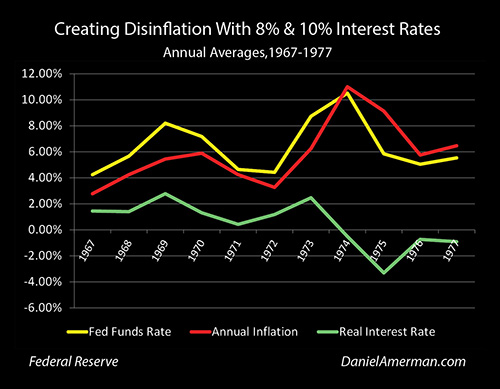
Inflation rates were quite low through most of the 1960s, but they began to rise sharply by the end. As can be seen in the red inflation line above, annual average rates of inflation climbed from 2.8% in 1967, to 4.2% in 1968, to 5.4% in 1969, and up to 5.9% for the year 1970. Many people believe that the deficit spending that funded the Vietnam War is what created the inflation - which certainly has some parallels when it comes to running deficits to help fund the current Ukrainian War.
Then as now, the Federal Reserve responded to high rates of inflation by increasing interest rates - that's their tool, it's what they have, without raising rates they don't have other *proven* tools for fighting inflation. Under the leadership of Fed Chair Bill Martin, the average Fed Funds rate went from 4.2%, to 5.7%, up to an annual average of 8.2% by 1969 (the actual peak was 9.2% in August of 1969).
Let's compare to today. The most recent 12 month inflation rate is 7.1%, and the most recent effective Fed Funds rate (after the December rate increase) is 4.3%. So, the Fed was fighting a rate of inflation that was significantly less than today, with interest rates that are about twice as high as today. The real (inflation-adjusted) interest rate peaked at about +2.8% (8.2% interest minus 5.4% inflation), which was the reverse of the negative 2.8% real rate (4.3% interest minus 7.1% inflation) that we see today.
High interest rates were just as painful then as they are now, and these were so painful that they triggered a recession that lasted from December of 1969 to November of 1970.
The combination of sharply higher interest rates and a recession then created disinflation - the same thing we are seeing a moderate degree of right now. This isn't deflation, although it is not uncommon for some prices such as commodities or energy to experience deflation - actual price decreases - during a recession. Disinflation is just a reduction in the rate of inflation, with average prices rising at a slower rate, instead of falling average prices. When inflation fell from 5.9%, down to 4.2%, before bottoming out at 3.3% in 1972, that was disinflation.
These are the classic elements in the cycle, and they still very much apply today.
1. Inflation gets too high.
2. The Fed sharply raises interest rates to fight the inflation.
3. The higher interest rates create a recession (usually).
4. The higher rates and recession in combination create not deflation, but disinflation.
A lot of people hate this process, and for good reason, it is a painful process for a nation and markets to go through. But, in the real world, it is what works. The alternative is unending inflation, which is much harder on a nation.
The Next Stagflationary Cycle
The first inflationary cycle was painful, but it didn't end the problem. Arthur Burns replaced Bill Martin as Fed Chair in February of 1970, and he began rapidly reducing interest rates to minimize the pain. Burns *pivoted* fast and hard to fight the recession. Interest rates were pushed down from 9% to 3.7% in one year - meaning they went negative in real terms, going to 1% below the then 12 month rate of 4.7%. This is the fifth step in the classic cycle.
5. The Fed pivots to fight the recession it created, and slams interest rates down (thereby creating enormous bond market profits, as covered in my article from 2019 linked here.)
This quick and sharp pivot was what the markets wanted, this is what the politicians wanted - but it didn't end the inflation. Indeed, it's worth scrolling back up to the "A 70% Market Loss" graphic, looking at 1970, and then seeing what happened afterwards, if you want to see an example of an accommodating Fed giving the markets what they want.
The rolling 12 month rate of inflation was back up over 5% by April of 1973, and had risen to 7.4% by September of 1973. This seems forgotten today, but it was crucial - the Fed had not "finished off" the previous inflation, as it *pivoted* hard to fight the recession of 1969-1970 with low interest rates - and the inflation came right back worse than ever. The wage/price spiral was cranking away, the new inflation rate of 7.4% was over 1% higher than the peak of the previous inflationary cycle.
Then there was another war (note the recurring theme, war -> inflation), the brief Yom Kippur Israeli / Arab war of 1973, and the Arab oil producers imposed an oil embargo on the United States that lasted from October of 1973 to March of 1974. Oil prices quadrupled, sending oil from $3 a barrel up to $12 a barrel (and if those sound antiquated, that's what long-term inflation does).
There was already a pre-existing surge in inflation to over 7% - and then there was a war, that led to artificial energy shortfalls, and created a further major increase in the rate of inflation. Again, there are some strong similarities with today.
The next recession started one month later, in November of 1973, it was a bad one, and it would officially last until March of 1975.
Burns had been trying to fight the 7.4% inflation with the usual central banking tools of increasing interest rates, and he had raised rates to 10.8% (a +3.4% real rate in contrast to today), but when confronted with a recession, he immediately *pivoted* and dropped rates to a little under 9%, creating another round of quick bond market profits. He also created a new round of negative real interest rates, and inflation responded by quickly increasing to over 10%.
Early in 1974, Burns found himself stuck between a rock and hard place, with a severe recession AND the first 10%+ rate of inflation that the U.S. had seen since 1948. (We may see this again in 2023.) The Fed decided it had to fight the inflation first. So the Fed Funds rate went back up to 12.9% - very briefly. Burns then tried to finesse the inflation/recession tradeoffs, and reversed himself yet again. He *pivoted* and quickly dropped interest rates to the 5% to 6% range, creating steeply negative real interest rates.
The recession eventually ended - but inflation was still at 11.2% at that time. This may sound like a lot of detail for the events of almost half a century ago - but we do have a history, even if many current market participants and commentators don't seem to know it. What history shows is that a long, severe recession, along with the complete end of the energy crunch that helped to create the inflation, were not enough to end the high and persistent rate of inflation. The idea that recessions necessarily cure inflation via demand destruction is simply a myth.
We also again had all five steps in the cycle again, albeit in a somewhat messy form: 1) higher inflation; 2) increasing rates; 3) recession; 4) disinflation; and 5) the pivot to fight the recession.
There was then a period of disinflation - but inflation remained high and persistent. Burns had solved his dilemma by choosing to fight recession over fighting inflation, and while that was good for jobs in 1975, the entire nation continued to pay the price in terms of higher inflation for years thereafter. On an annual average basis, inflation bottomed out at 5.8% in 1976 - which is almost the same as the inflationary peak of 5.9% in 1970, that the rolling inflationary crises started with. The new normal was that the previous multi-decade peak was now the new low.
And then, inflation started to rise again, because of the wage/price spiral that had never been dealt with. Inflation rose back up a 12 month average of 6.4% in March of 1978.
A new hero arose at that time - or so many might consider him today - and William Miller was appointed as the Federal Reserve chairman. Miller did not believe in raising interest rates to fight inflation at the cost of triggering recessions, it didn't make sense to him. Inflation immediately began to rise again, and Miller made sure the resulting increases in interest rates were small, and at a very slow pace, so as not to cause a recession. Inflation then started accelerating again, and went to over 7% by May, over 8% by September, up to 9% by December, and over 10% by March of 1979. The lack of control over inflation was also leading to major international consequences, with the dollar plunging relative to European currencies.
The short and long-forgotten reign of William Miller ended by August of 1979, with inflation having risen from 6.4% to 11.8%. The result of the Miller experiment, where he put into practice what many are advocating for today, was to almost double the rate of inflation in less than 18 months. That said, he did not trigger a recession.
It is only through understanding Burns and Miller, that we can understand what Volcker would do next, how different it was, and why he did it.
Failed Experiments
Paul Volcker was brought in to replace William Miller, and his appointment has to be seen in the context of what had been tried and failed. Arthur Burns was brought in to try to "finesse" inflation, to try to do the least economic damage that could be done, while still following the basic central banking model of using higher rates to combat inflation. He was also a believer in early and hard pivots, smashing interest rates down and flooding the markets with easy money to escape recession. William Miller didn't even believe in those basics, he did not like the idea of sharply raising rates at all, or causing recessions with monetary policy.
Burns and Miller were both very politically popular experiments. They believed what people wanted to believe. Over a period of almost ten years the nation experimented with a "dovish" monetary policy, and what it got was persistently higher rates of inflation.
This is the missing knowledge that much of the markets lack today. For people who started their careers in the 1990s to 2010s in particular - they've never experienced high and persistent inflation. This creates the belief that inflation is an anomaly, that will naturally disappear when the root causes are removed.
In 1979 - this is not what anyone believed. Inflation was a persistent force, the root causes were long gone, it was self-reinforcing through the wage/price spiral, and ten years in it was still rising. I spent the late 1970s and early 1980s studying economics and finance in college and graduate school - and my professors didn't know whether inflation could be brought under control again, and neither did anyone else.
Our shared experience at the time was that the Federal Reserve under the direction of the best economists in the nation had been fighting inflation with all the tools at its disposal - and inflation had been beating the Fed for TWELVE YEARS, 1968 to 1979 (inclusive). The recessions created disinflations, but they did not break the secular inflationary cycle, and neither did pushing interest rates above 9% in 1969, 1973, 1974, 1978 and 1979. There was indeed a "malaise" gripping the nation, and we didn't know if we would ever see sustained inflation rates below 5% again.
Enter Volcker
Paul Volcker would - eventually - end the long inflation. That said, he had to travel a path to get there. That path could almost be called forgotten economic lore at this point, yet it has tremendous information value for 2023 and beyond.
Federal Reserve Chairman Paul Volcker came in with a mission - to do whatever it took to bring down the rate of inflation. Volcker was far more aggressive than Martin, Burns or Miller had ever been.
Under Volcker's leadership, the Federal Reserve raised rates to almost 14% for the fall and winter, and up to an extraordinary 17%+ by March of 1980. These punishing rate increases put the United States into a new recession, by January of 1980.
Volcker then followed the conventional economic wisdom of the time (and of today), and tried to finesse the inflation with a pivot. Raise interest rates way up - far above anyone before - trigger a recession, and then quickly slam interest rates down to get out of the recession, with inflation defeated.
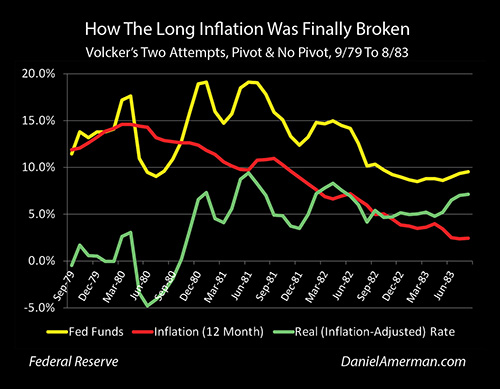
This strategy can be seen in the monthly graph above, which tracks Volcker's first four years as Chairman of the Federal Reserve. The Fed Funds rate was pushed up to an extraordinary 17%+, this briefly created a +3% real (inflation-adjusted) interest rate along with a recession, and then Volcker did a sharp pivot. He dropped rates by 8.5% in 3 months. This powerful pivot briefly created steeply negative real interest rates as can be seen in the green line above. The yellow line of interest rates went way below the red line of inflation rates, and as intended, the U.S. did exit recession by August of 1980.
There was, however, a problem, as can be seen if we follow the red line of inflation. The 12 month inflation rate in August was 12.9%. Volcker had raised interest rates over 17%, he had caused a recession, and then by the time he got the economy out of recession - inflation was higher than his term started. His first very theoretically correct attempt to cure inflation failed, 17% interest rates and a recession were not enough by themselves to stop well-established inflation.
To put it in personal terms, I was in 3rd grade when Fed Chair Bill Martin raised rates from 3.9% to 6.1% in an unsuccessful attempt to contain rising inflation. Through elementary school, middle school, high school and college, Martin, Burns, Miller and Volcker tried variations of every *reasonable* strategy they could think of for fighting inflation, triggering three recessions in the process. None of them worked, and by the time I was a college senior, thirteen years into the process, even Volcker had just completely failed. Inflation was not only still there, but it was worse than ever.
There's what people want to be true. There's also the actual historical record. For those who have theories, and ideas that make sense to them about why interest rates are currently way too high, it would be interesting to see them attempt to explain 1968-1980.
Crushing Inflation
As we will explore in Part 2 of this analysis, Paul Volcker did finally crush inflation and how he did so is through taking measures so extreme that they are far beyond anything that is being discussed today. These policies would later become a textbook rule for beating inflation - that is being completely ignored today.
Some people are comparing current Fed Chair Powell to Volcker because of the pace of interest rate increases in 2022, However, what we will find when we do the comparison to what happened from 1967 to 1983, is that Powell is instead a weaker version of William Miller. Take the weakest inflation-fighting policies of that entire era, make them still weaker, and we get what the modern Federal Reserve did in 2022. This is in sharp contrast to the current narrative - but it is historically accurate.
When we accept history, look at the current situation, and look at anticipated Fed policies in 2023 - then we get a very different set of expectations than what is currently priced into the markets. There are profound implications when it comes to the current potential mispricings that we are seeing for stocks, bonds, precious metals and real estate.
End of Part 1


