Chapter Three: The Secret History Of A 70% Market Loss
By Daniel R. Amerman, CFA
TweetFor some readers, our round number examples in "Inflation Pickpocket" and "Hidden Stock Taxes" may have seemed a little far-fetched. A 50% reduction in the value of the dollar may have seemed quite high.
It may also seem improbable that something like what was illustrated could happen without everybody knowing about it. Surely, if all the gains in a market were effectively an illusion - it would be widely reported in the media on a frequent basis?
If millions of people were actually being heavily taxed on phantom gains, that were really just an illusion - wouldn't they all know about it? Wouldn't this be a basic part of financial education and financial planning?
Interestingly enough, we do have a number of historical examples that no one seems to talk about. A particularly good example is a 70% inflation-adjusted market loss, that dominated 14 years of stock investing, with dire implications for common perceptions about the reliability of long-term stock investing - but yet, is unknown to the average investor today.
As we will also explore, when we look at both the stock markets and the national debt in comparison to the economy - what was could be again, and potentially for many years to come.
This chapter is part of a book that is in the process of being written. Some key chapters and an overview of the book are linked here.
How Inflation Hid A 70% Market Loss: 1968-1982
Consider the following graph.
 As shown in the yellow/orange, the Dow Jones Industrial Average reached 919 in May of 1968, and by August of 1982, had fallen to a level of 777, for a loss of 15%.
Some investors recall this as the "Lost Decade" for the stock market when the market stayed flat to somewhat down - moving sideways but never persistently up, and what is seen in yellow is consistent with that market perception. It also looks obvious that this overall flat market with a great deal of volatility would have generated some really good opportunities for astute market timers.
However, the reality is that a 15% loss in a long-term sideways market isn't what happened at all, not when we look at what a dollar would buy. That is, in 1982 the US dollar was only worth 35 cents compared to what it would have bought in 1968 because the dollar had lost 65% of its value to inflation.
As shown in blue in the graph, when we adjust the August 1982 Dow index of 777 to account for a dollar being worth 35 cents, then the real value of the Dow drops to 274. So when we consider the purchasing power of the dollar, then our stock portfolio wasn't flat, not even remotely close. Instead, it had dropped by a staggering 70% in fourteen years, from 919 to 274.

Now while this 70% decline in the value of what our assets would buy for us was entirely real, to this day many of us don't realize just how bad it was. That is because inflation in prices was hiding deflation in investment values. The 65% plunge in the value of the dollar "hid" the 70% plunge in the value of stocks, with most of the surface value of the Dow index by 1982 consisting of dollars that were worth far less than what they had been before.
Three False Peaks & Inflation Hiding Deflation
Even though long-term asset deflation of 70% (in real terms) was the result of persistent high unemployment coupled with inflation, many investors and newspaper readers of a certain age may not remember the 1970s that way at all. Instead, they may recall three powerful bull markets when the Dow repeatedly flirted with the "magical" 1,000 mark. Each surge filled innumerable financial columns with the hopes that the good times and a long-term bull market had returned again, with those hopes being quickly dashed as the market repeatedly proved unable to sustain itself above the 1,000 level.
Perceptions don't change reality, however, which is that there never were three bull markets, but rather only an inflationary illusion fooling the public. Indeed when we look closely, instead of seeing three peaks, we will see three historical object lessons in how destroying the value of money can hide the destruction of the value of assets - and repeatedly fool the headline writers along with much of the investing public.

The cold reality of the Dow adjusted for inflation is shown in blue. There aren't three interim peaks, but merely a market moving steadily and powerfully down.
The "bull market" that peaked in January of 1973 when the Dow hit 1,047 - was in reality a fall to Dow 848 (asset deflation in inflation-adjusted terms), which was masked by the dollar only being worth 81 cents when compared to May of 1968 (price inflation). Inflation had created an almost 200 point illusion in the Dow.
The "bull market" that peaked in September of 1976 at 1,014, really represented the Dow falling by over 300 points - translating to asset deflation of 34% - which was hidden from savers by the illusory profit created as a result of the dollar dropping in value by 40% (price inflation).
The cruelest illusion of all was the "bull market" of April of 1981, when the Dow finally reached 1,024. Because the real value of the market had fallen to 399, and a 57% destruction of the purchasing power of investor assets was being entirely hidden by the 61% destruction of the value of investor dollars.

Fully understanding this relationship of simultaneous price inflation and asset deflation is absolutely essential for financial survival, because there is a reasonable chance that we may all be seeing the greatest "bull market" in stocks that we have ever seen in the 2020s and 2030s - but it won't necessarily work the way investors today think it will.
Three Wealth Destroyers vs "Perfect Timing"
In my opinion, the greatest threat to long-term and retirement investors is the wealth-destroying triple combination of price inflation, asset deflation, and inflation taxes.
One of the most common investor approaches to a truly difficult market is to attempt to "outrun" the problems. Just make better decisions than the rest of the public, and make so much money that the problems can be overcome and wealth kept intact.
How well does that work in practice and just how good do you or your financial advisor have to be?
To answer that question, we will go back in history and assume that through the use of a time machine (or peerless skill, or uncanny luck) we did a perfect job of long-term market timing during an environment of asset deflation and price inflation.
Aided by this time machine, we put every dollar we had into the market on May 26, 1970, when the Dow closed at 631. What makes this day remarkable is that 631 is the lowest level the Dow index closed at between November 20, 1962, and September 12, 1974. It was the single cheapest day to buy stocks over an almost 12 year time period, and at the time, the lowest that stock prices had been at in more than 7 years. Perfection.
Subject to the conditions that 1) as long-term investors we need to be in the market for ten or more years, and 2) we want to stay within the 1968 - 1982 period of sustained asset deflation and high price inflation, we instruct our time machine to find the best possible place to sell. This turns out to be April 27, 1981, when the Dow closed at 1,024.
April 27, 1981, was the single highest close for the Dow index between January 22, 1973, and October 19th, 1982. So we buy in on the exact day with the lowest stock prices in an almost 12 year period, and we sell everything out on the exact day with the highest prices over an almost a ten year period. Double perfection!
So then, how did we do? If our returns had exactly tracked the Dow between when we bought and sold, our perfect timing would have taken us from 631 to 1024, for a 62% price gain in the midst of one of the worst markets in memory.
A whopping profit indeed! Before we adjust for inflation, that is, so let's do that. A dollar on our sale date in April of 1981 was only worth 43 cents compared to what it was worth on our purchase date in 1970. When we adjust for what our assets will buy for us - we have Dow 440, not Dow 1024. So even the absolutely perfect timing delivered by our time machine leads to a 30% asset deflation loss in real terms, not a 62% gain.

As explored in the previous chapter, however, the Internal Revenue Service did not "see" these losses. On the contrary, it was quite impressed by our remarkable investment prowess. Moreover, taxes were higher back then - when we confine ourselves to federal income tax rates we are still at a relatively low level now compared to much of the modern era. Assuming we were in the highest income tax bracket, and traded often enough to pay ordinary income tax rates, then given that the average top income tax rate over that period was 68%, this means that we would have paid out 267 in taxes on our 393 gain.
These taxes on effectively non-existent income are known to economists as "inflation taxes", and they can be devastating.
Subtracting out real taxes on imaginary income leaves us with Dow 757 in after-tax terms, and Dow 325 in after-inflation and after-tax terms. Thus, even with our quite unrealistic assumption of absolutely perfect market timing - which allowed us to radically outperform almost every other investor in the nation - we still lost almost half (48%) of the purchasing power of our net worth.
The Double Secular Dilemma
We have a particular issue when it comes to the current levels of the stock markets and of the national debt. From a big picture, long-term perspective, each can be viewed relative to the size of the national economy.
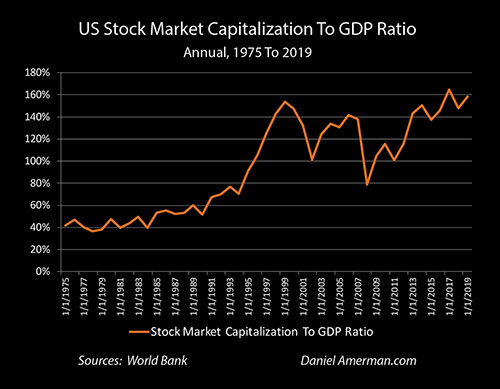
The stock market could be called a valuation of the national private economy, or at least those portions of the economy that represent the revenues and earnings of publicly traded companies. It used to be that the aggregate value of all stocks was usually equal to about 40% to 50% of the size of the national economy. This began to rise sharply over the course of the 1990s with the tech stock bubble, which peaked right before the bubble burst. Stock valuations then went down sharply - but they never did return to historic norms.
Stock market valuations relative to the economy reached an all-time record of 164% by 2017. And while the World Bank data shown is not frequently updated, if we use the S&P 500 as a proxy for all stocks, then stock capitalization in rough terms would have been around 185% for 2022, another new record that would be just above the top line of the graph above.
The range of stock valuations relative to the size of the economy in recent years is an outlier, they are far above what is historically normal. In this situation, there is a reasonable financial case to be made for exploring the implications of a regression to the mean, a return to more historically average valuations for stock market capitalization relative to the economy.
Just a return to the 2002 to 2013 era - which was still far above valuations prior to the 1990s - would mean a major reduction in inflation-adjusted stock market values. And if we did see a return to the valuation of previous decades before 1995, then that would indeed be in the roughly 70% loss range. These are not predictions or forecasts, but merely a discussion of current valuations versus previous valuations, with a return to previous averages (regression to the mean) usually being considered a prudent and responsible form of financial analysis.
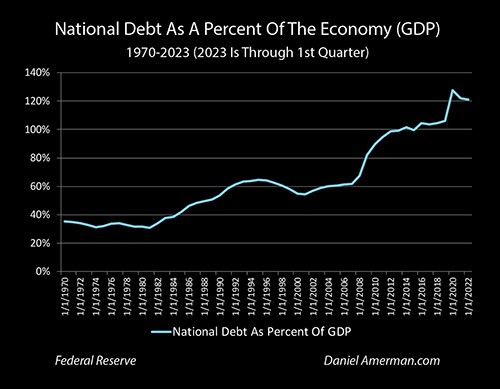
At the same time, we have another outlier in progress in recent years, and that is the size of the national debt relative to the economy. It is earnings from the economy that support stock market valuations, and it is taxes on the economy that support payments on the national debt. On a deeply fundamental basis, the three measures are closely related, with the economy being the underlying reality that is the foundation for both stock market valuations and government spending.
The three are related on another level as well, in that government spending has become of unprecedented importance to the economy in the 2020s. Without government deficit spending, it is likely that the economy would go straight into a prolonged recession or worse. There are simply not enough tax revenues available to pay for the combination of interest on the debt, transfer payments, government employees and defense - it isn't even close, and this is why the federal government itself projects large deficit spending into the indefinite future.
When we merge the economy, stock market capitalizations and the national debt together, the outlier in stock market values is based upon the outlier in the national debt becoming ever more of an outlier due to deficit spending each year, as without that deficit spending the economy would shrink and the stock market would likely be devastated.
Next step. As is being developed in this book, and is very well understood within economics, excessively large national debts are controlled via inflation. A nation that has borrowed in its own currency would never need to default because it can always create the currency to make the payments - and when too much of that happens, then we get inflation (some would call that default via inflation). That inflation is a feature and not a bug, because that reduces the real size of the debt, and redistributes wealth from the population to the government as we explored with Peter in Chapter One.
In combination then, we have an outlier in stock valuations relative to the economy, where the economy itself is dependent on continuing rapid increases in the national debt. On a secular basis, there is a very good chance of at least somewhat of a return to average, which would mean materially lower stock market valuations in real terms. At the same time, the current and increasing level of the national debt means that inflation is likely to be higher on a secular basis.
Put the two together, and we have what was explored in this chapter. Decreases in inflation-adjusted stock values over the long term, that may or may not be covered over by increases in inflation over the long term. The losses in real terms would be far greater than what would be shown in the headlines. Many rallies and gains would not exist in real terms, it would be inflation covering over real asset price declines. The taxes that would be paid on these nominal gains would, however, be entirely real, and would further increase the losses for the public, even while increasing the tax revenues for the government.
A situation where inflation is reducing the real value of the national debt even while inflation taxes are greatly increasing tax revenues - with the general public being unaware that either is happening - is an ideal situation for a heavily indebted government. Now, the government would prefer that this situation exist in combination with a healthy and thriving economy, but part of the key to inflation taxes is that they create tax revenues even when things are not going well - which is when they are needed the most by the government.
When we have secular stock market losses, then we have year after year of people declaring losses on their stock returns - and capital gains taxes dry up, thereby sharply boosting deficits. Unless - we have inflation creating artificial profits, that then become taxable. For many decades this game has been played on a different level than the general public has been aware of, and being able to more consistently collect taxes is too important for governments to be left to chance.
As we covered in our "perfect timing" example, it is extraordinarily difficult to come out ahead in such an environment. Index investing is based upon the idea that the markets will always thrive over time - but all index investing between 1968 and 1982 would have done is ensured a 70% inflation-adjusted loss in price terms. It is very difficult to beat the markets via timing strategies, but even with a perfectly executed strategy, the best case of all the 10+ year holding periods in that time, there was still a major loss.
To have a chance, first and foremost we need to be able to actually see what is happening. When we do see what is happening - then as will be developed in a later chapter, we can see that this is not just a situation from the distant past, but that major taxes on mostly imaginary income have occurred repeatedly, including very recently indeed.


