
Reading Three
Stock Surprise
by Daniel R. Amerman, CFA
In our previous "eye-opener", we looked at how the three wealth flows of (1) precious metals; (2) a high rate of inflation; and (3) taxes work together in combination to create a very powerful hidden current of wealth that redistributes wealth between precious metals investors and the government in a wholesale manner, albeit in a way which few investors are aware of.

In this next reading we will explore how the three wealth flows of:
 (1) historical stock price performance,
 (2) taxes, and
 (3) low historical inflation
have converged to create a raging torrent. Instead of our rounded examples from the first two readings, we look at actual historical securities prices, actual historical inflation rates, and discover some extraordinary results.
For those savers who paid current taxes on investment earnings, their wealth was redistributed in a quite unexpected way. That is, not only did they make almost nothing in real terms when it came to increases in share prices – but part of the starting value of their savings was actually taken by the government.
For those who are saving through traditional tax-deferred retirement accounts but who have not yet retired, the negative impact from the 15 years studied hasn't been experienced yet, but this historical issue will unavoidably come to life as soon as account withdrawals and tax payments begin - and could lead to reduced standards of living in retirement for many years to come.
(If a friend or colleague sent you a link to this reading, it is the third chapter in a book where each chapter builds on the previous chapters. For the best understanding, it is recommended that you sign up for your own free copy, and read the chapters in sequence.)
Quick Review
In the previous reading, we found that even a so-called "perfect" inflation hedge can turn out to be an unexpected means of steering wealth from unknowing investors to the government, via the mechanism known to economists as "inflation taxes".
We looked at a round number scenario of gold being worth $1,000 an ounce, and with the purchasing power of the dollar then dropping to fifty cents. If gold were to maintain its value, the only way to do so would be to increase in price from $1,000 an ounce to $2,000 an ounce, which generates $1,000 an ounce in taxable income. As shown below, with a 50% tax rate, once taxes are paid and we adjust for inflation, 25% of the investor's real starting net worth now belongs to the government.
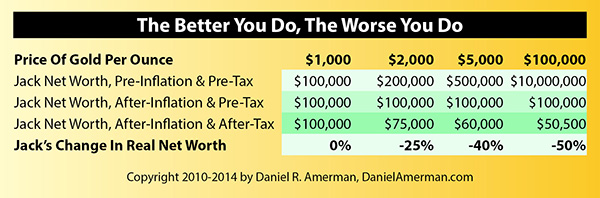
And the higher the rate of inflation – and the more spectacularly that gold appears to be performing as an investment – then the more of the investor's net worth that ends up unexpectedly belonging to the government. So that with gold at $5,000 an ounce, 40% of the investor's starting investment went to the government, and $100,000 an ounce gold led to 50% of the investor's real investment being taken by the government.
Inflation Taxes Take Much More Wealth From Stock Investors Than Gold Investors
The relatively simple nature of gold acting a perfect inflation hedge, with round numbers, provided a good introduction to inflation taxes.
But for governments, while precious metals are a nice income supplement – they aren't where the money is. The real money is in the massive amount of wealth invested in the stock markets.
As a concrete example, consider the graph and table below for the Standard & Poor's 500 between the end of 1997 and the end of 2012.
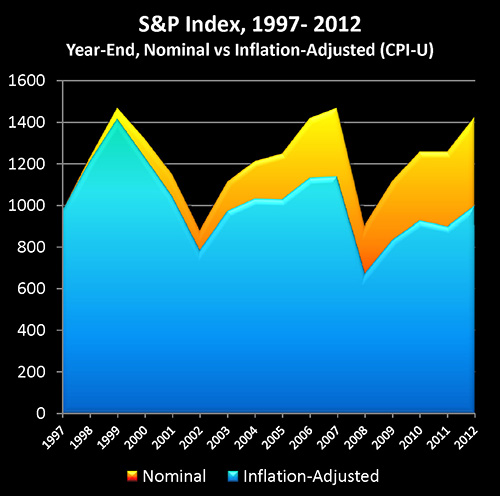
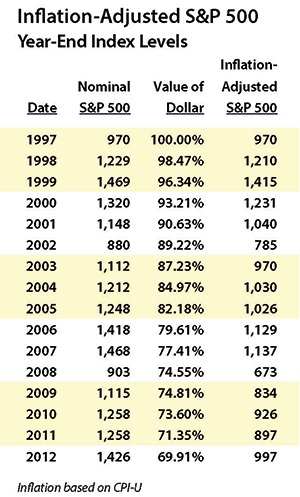
The Standard & Poor's 500 at the end of 1997 had a value of 970, and by the end of 2012 had reached a value of 1426, which was in nominal terms a quite impressive gain of 47%. However, once we adjust for changes in the purchasing power of the dollar, using official US government inflation statistics (the CPI-U as calculated by the Bureau of Labor Statistics), a dollar by the end of 2012 would only purchase what 69.9 cents would have purchased 15 years before. So when we take our ending index value of 1426, and we adjust for the change in purchasing power, our ending purchasing power is only 997, or a gain of 27.
In other words, what happened in the real world with stock prices over a 15 year period, worked out to be very similar to what we saw with precious metals in our previous reading.
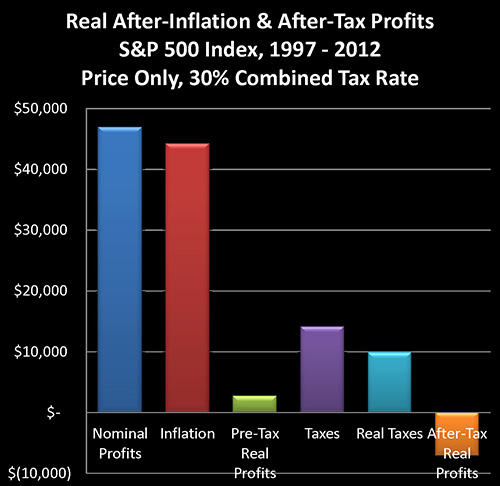
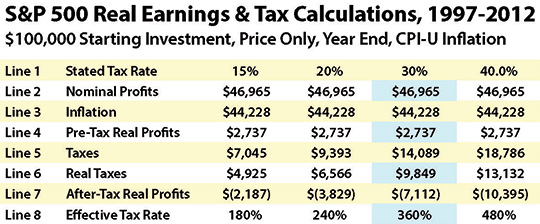
Once again, we started off with an initial investment of $100,000. If the stocks in our portfolio had performed exactly like the stocks comprising the S&P 500, then on a price-only basis our ending portfolio value would have been $146,965. That translates to $46,965 in profits, as shown in the dark blue bar on the above graph and line (2) on the table.
It looks like we did just fine, almost a 50% gain. Sure, a 100% gain would have been better – but 50% is really nothing to complain about.
However, as with gold, the problem is that if most of our gains are merely keeping up with inflation, then we're not actually getting ahead, but rather are just generating taxable income that may be pulling down our net worth.
So let's compare the first three bars in the above graph. The tall blue bar is total price gains. The red bar is the price gains that are really only the result of inflation – and it's almost equal to the blue bar.
What the little bitty green bar represents is what truly matters, which is the "real" profits, after adjusting for inflation having reduced the purchasing power of the dollar. Real profits over 15 years – for real world investors who tracked the S&P 500 – were only $2,737.
The visual comparison between real profits and keeping up with inflation drives home just how striking the difference is. The red bar of phantom (but fully taxable) "profits" towers over the adjacent little green sliver, even as $44,228 of merely keeping up with inflation is more than sixteen times the $2,737 of real profits.
And if the average investor was historically getting taxed (or in the case of tax-deferred retirement account investors - will later be taxed) on sixteen dollars in phantom gains for every one dollar of real gains – how is that likely to work out when it comes to after-tax net worth?
The answer can be found in the three bars on the right, as well as lines 5-8 of the table.
The sizable purple bar is taxes of $14,089 (assuming a combined federal & state tax rate of 30%). To keep an apples-to-apples comparison, we adjust taxes for inflation, and get the aqua bar of real taxes.
And on an after-inflation and after-tax basis – which is arguably all that really matters, what our money will actually buy for us after we have paid our taxes – instead of gaining almost $50,000, we instead lost a little over $7,000, as shown in the orange bar.
So then, we made $2,737 in real price gains, the government took almost $10,000 in real taxes that were almost entirely based on the government destroying 30% of the value of the dollar over 15 years, and we lost 7% of our starting net worth.
True, there were many ups and downs between 1997 and 2012, but nonetheless, the gain was still nearly 50%. And considering the government's assertion of a very low 2.4% annual average rate of inflation – our ending up losing 7% of our starting wealth is a most unexpected result.
Market Averages & Individual Realities
What has been demonstrated here is statistical and financial reality – but how does it reconcile with most individual perceptions of reality? Let's consider the tens of millions of investors who experienced average results while actually owning stocks during the 15 years analyzed, and see how they did – from their perspectives.
If you were to ask them, while they may be a bit disappointed that they didn't do better, most of these investors would likely tell you that they still made good money.
For each one of these many millions of individuals, if they were to compare their brokerage account statements from the end of 1997 through 2012, then the price for each share they had owned over that period would be on average up by almost 50%.
And if they'd had $100,000 invested and were at a 30% marginal combined tax rate, then they would have paid around $14,000 in taxes on their about $47,000 in taxable capital gains, leaving them with around $33,000 in after-tax income.
As for inflation, they likely feel that while any rate of inflation isn't fun, an officially reported 2.4% annual rate turned out to be nothing to worry about.
So, clearly – from their perspective – these tens of millions of investors did just fine. And they have the brokerage statements, tax returns, government statistics and the assurances of trusted financial authorities to validate that perspective.
Yet, somehow the amount of money they had expected to be available to support them in retirement wasn't nearly what they thought it was going to be.
On the other hand, the cold mathematical and financial reality is not that tough to establish. Simply take an ending after-tax portfolio of $132,876, adjust for the dollar being worth 69.9 cents, and the after-inflation, after-tax value is $7,112 less than the $100,000 which the investor started with.
Even if vastly different, financial reality does eventually reconcile with individual perceptions of reality. The currents of wealth are what they are, and whether a given current is hidden or not to a particular individual does not change the reality of that flow of wealth for that individual.
And it is the disappointing and somewhat mysterious loss of purchasing power – the reduction in actual goods and services that can be paid for – which serves as the mechanism for this reconciliation between widespread and deeply-rooted beliefs about how wealth is built, versus the underlying real flow of wealth. Indeed, this reconciliation through reduced standards of living is inevitable, regardless of whether the individual ever even becomes aware of the governing financial reality.
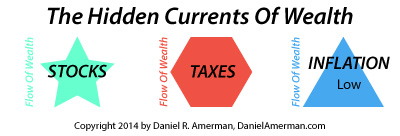
The Hidden Currents of Wealth
In the first reading, when we combined two negative wealth flows – those of inflation and liabilities – they cancelled out and became a positive.
The following excerpt is from that reading:
"With these two particular economic factors, they work like mathematics – multiply a negative by a negative and we get a positive."
The underline was used for emphasis, because there is more to understanding the hidden currents of wealth than relying on elementary school mathematics. Sometimes two negative wealth flows do cancel each other out and create a positive. Other times, two negative (or positive) wealth flows can combine to powerfully reinforce each other, creating a combined current that is far stronger than would seem to possible given the individual strengths of the wealth flows.
Unfortunately, the negatives of taxes and even very low rates of inflation are two such wealth flows, and they can when combined create a raging torrent of negative wealth flow.
From a common sense or intuitive point of view – it just doesn't seem right. Stock gains were healthy. Tax assumptions weren't that high. And the rates of inflation used were low, actually below historical norms.
Yet, so powerful is that combination of taxes, inflation, and taxes on inflation, that common sense is fooled, and the hidden current of wealth silently strips away many years of disciplined deferred gratification along with ever-growing account balances.
Now that all sounds a bit bleak, but fortunately, there are many hidden currents. And we need to be aware of some of those currents, so we can try to steer clear of the dangerous ones if at all possible. Other currents, we want to jump right in and enjoy the flow of wealth!
When we look at other times in history and other wealth flows, there have indeed been times when millions of people have quite accidentally had a torrent of wealth pointed straight at them. Without their even fully realizing the source of their good fortunes, wealth was given to these lucky people hand over fist, for year after year.
Wealth that paid for new cars and new furniture. Wealth that paid for college tuition for children. And wealth that still forms the financial foundation for some retirees today.
What you just read was an "eye-opener" that was intended to get you thinking. The next reading is an equally fundamental eye-opener which uses different wealth flows to uncover a powerful and positive hidden current of wealth, which has benefited many millions of people before, on an accidental basis.
Which leads to the question - if all these people received all this wealth by accident, what would happen if you accessed the same hidden current of wealth on purpose and in a very deliberate manner?
If A Friend Sent You This Link
 What you have just read is an "eye-opener" about one aspect of the often hidden currents of wealth which are continually flowing all around us.


If you found this "eye-opener" to be interesting and useful, there is an entire free book of them available here.
All readings in the book are the exclusive property of Daniel R. Amerman, CFA. Subscribers are allowed to print a single copy for their own usage. Any other copying of materials from these readings and reposting or reprinting elsewhere is strictly prohibited and constitutes a violation of international copyright law. If you would like to share these educational materials with others - please use a link to this website.