
Reading Four
Accidental Prosperity
by Daniel R. Amerman, CFA
In our previous "eye-opener", we looked at how the three wealth flows of (1) historical stock performance over a 15 year period; (2) taxes; and (3) a very low historical rate of inflation came together to create a very powerful hidden current of wealth that crippled stock price performance for a generation of investors, but with this occurring in a way that was invisible to most of the population, leaving millions of perplexed investors wondering what happened to their planned retirement standard of living.

In this next reading we will explore how the three wealth flows of:
 (1) real estate in the form of single family homes,
 (2) historical inflation, and
 (3) liabilities in the form of home mortgages
previously combined to unexpectedly and even accidentally produce one of the biggest financial windfalls of their lives for millions of middle class households. This enormous amount of wealth was not newly created, but rather it was taken – and we will track down the source of this hidden current of wealth.
(If a friend or colleague sent you a link to this reading, it is a chapter in a book where each chapter builds on the previous chapters. For the best understanding, it is recommended that you sign up for your own free copy, and read the chapters in sequence.)
A Common Misunderstanding
During the 1970s and early 80s, the United States went through its worst inflationary bout in modern history. There were many victims. There were also tens of millions of accidental victors, many of whom are still enjoying the fruits of their victory. These people knew that something good happened. But few understood what really happened.
When we look at the financial situation of people currently of retirement age, people who are now in their 60s, 70s, and 80s, many of them have something in common. They are, or they were, “house rich”. That is, they became homeowners many years ago, when houses were far more affordable.
As an example, in 1950 the average price of a house in the United States was only $7,354. By 1960 it was up to $11,900. By 1970, the average home was all the way up to the dizzying price of $17,000.
Some of the most fortunate among these people didn’t move for many years, indeed some are still in the same house they purchased in 1965 or 1970. You likely know someone like this – it could describe your parents, grandparents, aunts or uncles, parents of friends, or perhaps even yourself.
Instead of moving, these homeowners paid off their little $6,000, $10,000, or $15,000 mortgage some years ago, after decades of making $50 or $100 mortgage payments. They now own free and clear, with no mortgage, a house that may now be worth $100,000, $200,000, or perhaps even $300,000 or more. That house represents the largest asset that many retired people have.
That valuable house with no mortgage payment is indeed the basis for how many older people are able to enjoy a reasonable lifestyle with Social Security payments today, something that could be quite difficult if making rent payments, or current mortgage payments.
We can look at this reasonably common situation and say that there are many millions of people of a certain age who were fortunate enough to buy houses when prices were very cheap. That these people have done very well because they bought their houses before inflation had eroded the value of the dollar, and they have been well rewarded financially because of this, as the values of their homes soared.
We would, however, be only partially correct. And unfortunately, this misunderstanding about much of the real source of their wealth could be quite expensive, if the years ahead do bring dangers to the long-term value of the United States dollar.
What many aren't aware of is that there is a time-proven financial strategy with a solid historical track record of raising the real (inflation-adjusted) net worths of millions of people. A strategy that thrived the last time the dollar went through a period of major stress. An entire generation of people benefited from their home ownership during a time of protracted inflation, and many of these people are still reaping those financial rewards today. It was not, however, the houses themselves that were the major source of real wealth gained.
Mike's Experience
To better understand what historically happened, let us consider the example illustrated below of Mike, a fiscally conservative person, who didn't believe in mortgages or other types of borrowings. So when Mike purchased a completely average home in 1972, he paid cash. The price was $18,267, the national average value of a home in the US that year.
When Mike held on to his property for the next 10 years, over a period of significant inflation, his completely average house became worth a nationally average $41,084 by 1982. Therefore, it would appear that our fiscally prudent homeowner did very well indeed, as Mike’s house was worth 125% more than what he paid in 1972, meaning a profit of $22,817.
(The reason for the precise numbers like “$22,817” is that we are exactly following historical averages, the real experience of average homeowners from 1972 to 1982.)
However, that is before adjusting the home investment profit for inflation. The whole idea here is that we are looking at a time of inflation, and how we can preserve our dollars, or even make money in such an environment. So let's take a look at how Mike did with his home investment in inflation-adjusted terms.
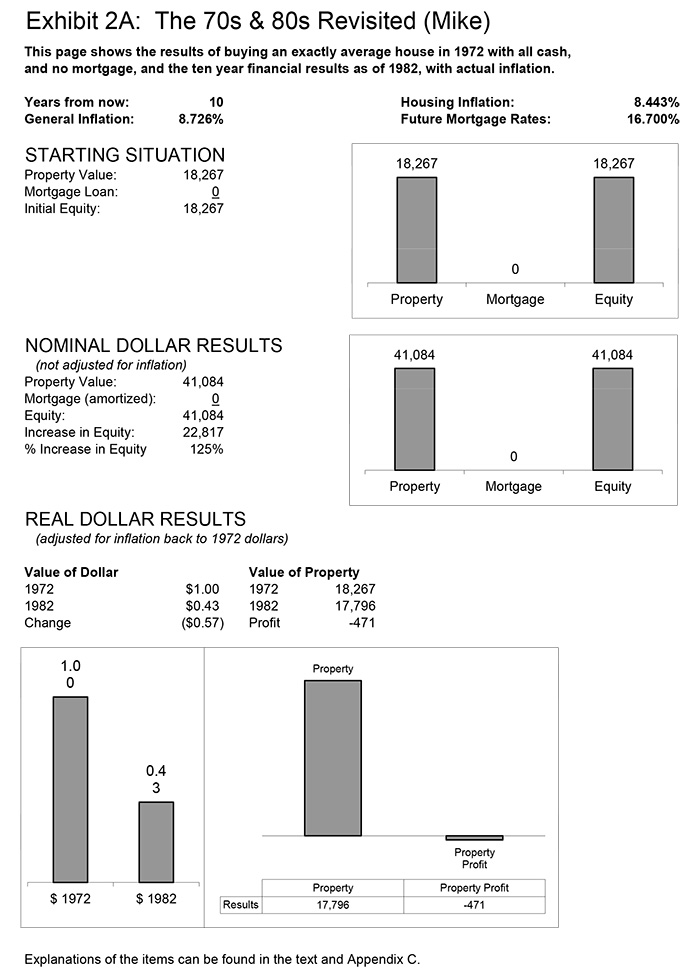
As shown in the above chart, by 1982 the value of a dollar had dropped to 43 cents compared to the value of a dollar in 1972. Therefore, that $41,084 house in 1982 dollars was only worth $17,796 in 1972 dollar terms. As we can see in this exhibit, since our fiscally cautious homeowner paid $18,267 in 1972, not only did Mike not make any money in real dollar terms – he actually lost $471 in real terms.
While surprising on the surface, this is quite understandable when we think about houses, inflation, mortgage rates and affordability. When we buy an asset that keeps up with inflation, then by definition that is all it does – it keeps up. It doesn't make a profit over and above inflation.
For example, if we buy something for $100 this year, and inflation raises prices by 100% so that the item is worth $200 next year, then on paper we have made a $100 profit. However, since the doubling of price levels means that the dollar is only worth half of what it was the year before, that means we made no profit at all in real terms, but rather we just kept up with inflation (and with most asset types we've also incurred a major tax liability should we ever sell the item, as covered in previous readings).
Another issue that those who were in the market to buy homes in the 70s and early 80s likely remember well, is that the higher the inflation rate, the higher the mortgage rate, and the more difficult it was to afford a home at any given price. By October of 1981, average mortgage rates peaked at 18.45%. That was more than 10% higher than mortgage rates in 1972, making homes less affordable for people in general.
Because homes were less affordable at higher mortgage rates, this hurt the housing market, and home prices were in fact not quite able to keep up with inflation.
Jim's Quite Different Approach
To better understand the true source of wealth for those millions of homeowners, let's look at someone else who also bought a completely average house (also for precisely $18,267) in 1972.
This homeowner's name was Jim, and Jim was fine with borrowing money when appropriate. So Jim took out a completely average loan and borrowed 80% of the price of his home purchase in the form of a mortgage. This 30-year mortgage had a fixed interest rate of 7.37%, which was exactly average for that time. As can be seen in Exhibit 2B, "The Starting Situation", the difference between the property value and the mortgage loan amount meant that Jim had an equity of $3,653 in his average home.
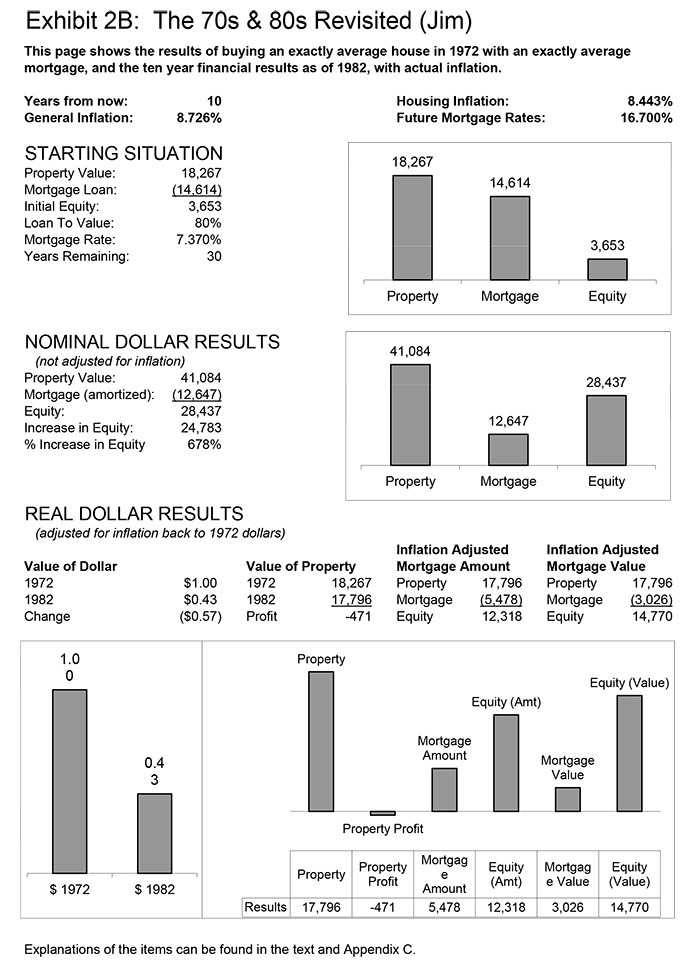
Now, let's move down to “Nominal Dollar Results” (“nominal” meaning not adjusted for inflation). Like Mike, Jim experienced exactly average price appreciation in his home for a 10-year period, as its value grew from $18,267 to $41,084 by 1982, for an increase of $22,817.
Comparatively little principal is paid down in the first 10 years of a mortgage amortization, but Jim's payments were sufficient to reduce his principal balance down to $12,647. Comparing the new value of the property to the new mortgage amount, we can see that Jim’s equity has grown from less than $4,000 to almost $30,000 – an increase of close to 700%! This sure looks great in nominal dollar terms, but will we lose it when we adjust for inflation, like we did with Mike?
To answer this question, let's take a look “Real Dollar Results” in Exhibit 2B, where all of our 1982 dollars are adjusted back to their 1972 equivalents. As we can see in the “Value of Dollar” section in the bottom chart and graph, a 1982 dollar is worth only 43 cents compared to a 1972 dollar, meaning the dollar lost 57% of its value within a 10 year period.
When we look just to the “Value of Property”, Jim's home is identical to Mike's home in that it did not quite keep up with the rate of inflation. The high mortgage rates averaging over 16% in 1982 kept property prices lower than they otherwise would have been, and Jim actually had a small loss on his house in inflation-adjusted terms.
The crucial wealth flow of (3) liabilities when combined with the wealth flows of (1) real estate and (2) inflation is the true secret of how so many millions of homeowners benefited from inflation in the past, and this can be found by looking at the “Inflation Adjusted Mortgage Amount". As you can see, when we adjust for inflation, the amount of money that we owe (in 1972 dollars) on the mortgage has fallen to about $5,500.
It isn't that the value of the home soared in inflation-adjusted dollars, for it did not even keep up. What did happen for Jim and so many others is that the inflation-adjusted amount that they owed on their mortgages plummeted. After ten years, Jim still owed $12,647 on the mortgage out of his original $14,614. But because the dollar was worth less than half what it had been, it meant that he really owed less than half of what he otherwise would have. Inflation wiped out most of what Jim owed over the course of that 10-year period, so Jim never had to pay back what he borrowed in real terms.
That means that in real terms, in 1972 dollars, Jim now had $12,300 in real equity. This represents a huge increase in real (inflation adjusted) equity when compared to the less than $4,000 that Jim had had only 10 years before. An increase in equity that did not come from the soaring value of Jim's house, which only kept pace with inflation. The increase instead came from the inflation-caused destruction of most of the value of Jim's mortgage.
Whereas Mike lost $471 in real terms by simply owning a house with no debt in a time of sustained and high inflation, Jim made almost $7,000 (after adjusting for the $3,653 in the original equity, and the $1,967 in nominal dollar principal payments).
If Jim sold his house in 1982, he would have directly collected the benefit at that time. He would have sold for $41,084, paid off the mortgage for $12,647, and walked away with $28,437 in profits (as shown in "Nominal Dollar Results"). Even if Jim did not sell his house, he would still very much benefit from the effects of inflation on his mortgage.
Indeed his benefits would be greater if he stayed, just as the greatest historical benefits were enjoyed by the millions of people who bought homes before the inflationary turmoil of the 70s and early 80s, and then stayed in those homes.
The Source Of Jim's New Wealth
The perspective presented here may sound a bit unusual today, but the concept of inflation causing the destruction of the dollar value of mortgages was not the least bit controversial in the 1980s. Indeed, the lending industry was all too well acquainted with the concept at that time.
You could in fact say that it dominated the industry for a good decade and more, as hundreds of financial institutions went into insolvency, and thousands more clung to life, relying on special government accounting treatments to stay alive long after the value of their liabilities exceeded their assets.
As a young investment banking vice president in the 1980s, I participated in the portfolio restructurings of billions of dollars of what were then known as “underwater” mortgage loans. For years, day after day, I spent my time analyzing portfolios from across the country. Whether the client was a small community savings & loan in Georgia or a multibillion dollar institution in Chicago, all of these financial institutions were carrying portfolios of hundreds, thousands, or even tens of thousands of little mortgages. With each of them bearing interest rates that seemed absurdly low by the standards of the 1980s.
By the mid to late 1980s when a nice new home in the suburbs was already up to $100,000 with then-current interest rates of 11%, 12% and 14%, there were all these little loans still outstanding of $4,000, $10,000, and $20,000; with interest rates of 7%, 8%, sometimes even 6% and below. Compared to even the home prices and mortgage rates of the 1980s, these were almost toy mortgages.
Yet, the cumulative impact of these many millions of small low-interest rate mortgages were anything but small for my clients and the rest of the financial industry. Paying 10% and more to borrow money and having that money invested at 7% in mortgages locked in annual losses on every one of those mortgages, which could quickly drive a savings and loan into bankruptcy.
Sell the loans however, and the huge loss per loan (as a 7% loan might only be selling for 60 or 70 cents on the dollar) would even more quickly drive the lender into bankruptcy. This dilemma drove so many savings and loans into bankruptcy that a special government agency, the Resolution Trust Corporation, had to be set up to handle all the dispositions. If we bring the amounts involved forward into current dollars, the savings & loans and banks had a $2 trillion problem.
While not the subject of the numerous headlines and congressional hearings caused by the Savings and Loan mortgage debacle, something equally powerful was happening on the other side. Which is that for every dollar of loss by the banks and savings and loans – there was a beneficiary. There was someone who was turning the lender’s loss into a dollar of personal gain. Hundreds of millions of dollars of gains for many millions of families.
Yes, something unusual was happening. Even if it was something rarely remarked upon then, and almost forgotten today. The little guy was actually winning! Every time my colleagues and I looked at a portfolio of a thousand “underwater” mortgages that was on the verge of bankrupting a $100 million financial institution, we were also looking at a thousand individual households who were enjoying the benefits of being “short” their mortgage during a time of inflation.
A thousand real households, with real people like our hypothetical “Jim”, who had borrowed money when mortgage rates were lower, before the inflation fully kicked in. Who borrowed dollars back when they were expensive – and paid the loans back with dollars that became cheap.
We were looking at a thousand families who could recognize a fat profit anytime they sold their house, with their home equity growing at a rate that was well in excess of the rate of inflation – because inflation had destroyed the value of the money they had borrowed. Even better was when they didn't sell their home, and the inflation-driven shrinkage of the real cost of their mortgage payments freed up vast amounts of wealth. These homeowners benefited every month they wrote one of those little mortgage payments that were bankrupting their lenders.
Without their even fully realizing the source of their good fortunes, wealth was given to these lucky people hand over fist, for year after year. Wealth that paid for new cars and new furniture. Wealth that paid for college tuition for children. And wealth that still forms the financial foundation for some retirees today.
The Hidden Currents of Wealth
Basic mathematics is that if we multiply a negative by a positive we get a negative, and if we multiply a negative by a negative – we get a positive. Very, very few people think of the flow of wealth in this way, but that is exactly what happened in the 1970s and early 80s with this particular combination of wealth flows.
A usually negative wealth flow – inflation – destroyed most of the value of the dollar in less than ten years. While devastating to the economy and individual savers as a whole, in the particular situation we're exploring the wealth flow of inflation by itself was in fact neutral. That is, it simply acted as the agent to transfer wealth between different sectors of the economy – as well as between different individuals.
For millions of unsuspecting homeowners, this negative force slammed into another wealth flow negative in their lives, which was the debt they owed on their homes. In this instance, multiplying two negative wealth flows equaled a positive, as the destruction of the value of the dollar also destroyed the value of the liability.
Home equity, like net worth, is equal to assets less liabilities. As an asset by itself, real estate did not maintain its value, but instead led to a slight loss in inflation-adjusted net worth. However, because homes nearly retained their value while the value of the liability was slashed, a very large gap opened between asset value and liability value, which sharply boosted both home equity and net worth.
On the flip side of every financial liability is a financial asset.
A mortgage is a liability for the homeowner, and an asset for the lender. A government bond is a liability for the government, and an asset for the investor. Your checking account balance is an asset for you – and a liability for your bank. (These opposing wealth flow relationships between individual savers on the one hand – and banks and governments on the other – will be crucial in later readings.)
Like almost all financial assets in inflationary times – including cash, bonds and savings account balances – these positive wealth flows were pummeled by the negative wealth flow of inflation, so that a positive was multiplied by a negative, and pain and devastation was the result.
Meanwhile, the opposite wealth effects of inflation on assets and liabilities acted as a transfer system, with the destruction of the value of the liability moving wealth from the savings & loan industry to average families. Those real estate owners without mortgages did not participate in this wealth transfer.
In other words, these millions of households were accidentally engaged in a naive and simple form of real estate-based asset/liability management, albeit with their homes rather than income properties.

During a sustained time of economic and financial crisis, much of middle class America found a hidden current of wealth flowing to them and producing windfall gains. Effectively, the debts that they had taken on to acquire the largest assets in their lives were mostly forgiven, even while the mortgage payments that had been such a substantial component of their pre-inflation income became a much smaller portion of their post-inflation income.
A powerful hidden current of wealth was flowing, hollowing out its source in the financial industry, even as it was enriching the average person.
Forty years later, we are in another time of economic and financial dysfunction – and what we are seeing is effectively a photographic negative of this previous cycle, with white having become black even as black becomes white.
Today, the overwhelming conventional advice is that the average person should do everything in their power to be as free of debt – in all forms – as they can. In other words, to make absolutely sure that there is no possible way to benefit from this hidden current of wealth...
On the other side of the table, the small community savings & loans were replaced long ago by the global money center banks, with an unprecedented concentration of wealth.
These sophisticated players understand with crystal clarity the wealth flows of inflation and liabilities, as well as the resulting hidden currents of wealth. They're not accidentally gifting anything to the middle class, but are instead using their knowledge and power in what could even be deemed a "predatory" manner to take wealth on a wholesale scale from those unsuspecting savers and investors who are following the conventional wisdom.

To further understand today's hidden currents of wealth, we need to include another wealth flow that is of crucial importance – that of interest rates. In our next reading we will integrate this additional wealth flow along with some powerful motivations.

If A Friend Sent You This Link
 What you have just read is an "eye-opener" about one aspect of the often hidden currents of wealth which are continually flowing all around us.


If you found this "eye-opener" to be interesting and useful, there is an entire free book of them available here.
All readings in the book are the exclusive property of Daniel R. Amerman, CFA. Subscribers are allowed to print a single copy for their own usage. Any other copying of materials from these readings and reposting or reprinting elsewhere is strictly prohibited and constitutes a violation of international copyright law. If you would like to share these educational materials with others - please use a link to this website.