
Reading Six:
Negative Savings
by Daniel R. Amerman, CFA
In our previous "eye-opener", we looked at how the four wealth flows of (1) governmental attempts to stimulate job growth, (2) a "back door" method for paying down national debts, (3) very low interest rates, and (4) low inflation came together to create an extraordinarily powerful hidden current of wealth.
In this next reading we will explore how the four wealth flows of:
 (1) very low interest rates,
 (2) financial assets such as bonds, savings accounts and money market funds, as well as most investment assets in general,
 (3) relatively low inflation rates that are nonetheless higher than interest rates, and
 (4) taxes
are combining right now to create a pervasive global environment of negative savings for individual investors. This is not to say the situation is hopeless – far from it. But to find the corresponding positive wealth currents, we first need to better understand the present convergence of the negative wealth currents.
(If a friend or colleague sent you a link to this reading, it is a chapter in a book. The individual Flows Of Wealth and how they converge to form the multiple Currents of Wealth comprise a system for financial learning, that is delivered in a carefully designed, step-by-step sequence. Therefore, to best understand and make use of these materials, it is recommended that you sign up for your own free copy, and read the chapters in the order intended.)
Level One: Compounding Savings
To fully understand how these wealth flows are transforming millions of lives right now – with implications that may change standards of living for current and future retirees for decades – we need to understand that interest rates determine two key results.
The first result is how much wealth we can build before retirement, and the second result is what kind of lifestyle we can enjoy during retirement.
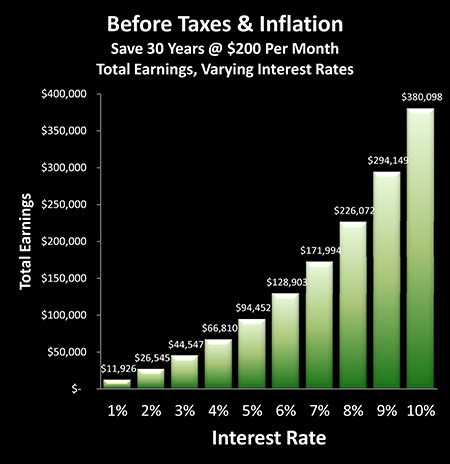
The above graph represents a completely average tax-deferred retirement account, and it captures the essence of conventional financial planning.
It is assumed that someone has a $200 payroll deduction taken out every single month for a period of 30 years, with that deduction being contributed to their tax deferred retirement account. This could be an IRA or 401 plan in the United States, or one of the equivalents in other nations. The initial contributions are tax deductible, the earnings compound without taxation over one's working career, and are only taxed at the then prevailing tax rate as they are withdrawn from the account and used to support standard of living in retirement.
Now as can be plainly seen above, when it comes down to the amount of money that's going to be available at retirement age, it's not so much a matter of the contributions, but the rate at which the contributions are invested.
In this example we are looking at bonds, or other high quality interest-bearing investments such as money market funds or certificates of deposit, but yields are yields, and this could just as easily be stocks, real estate or another alternative investments.
Now again these are just the earnings, they are whatever the account balance is over and above the $72,000 in contributions ($200 x 12 months x 30 years), and they represent the reward for those 30 years of discipline and deferred gratification.
This reward varies widely depending on the actual rate earned over the 30 years. If we're looking at a 6% yield they are about $128,000, at 4% they are around $69,000, and at 10% they soar to $380,000.
What this graph represents is what some people refer to as the "miracle of compound interest", and is what much of traditional financial planning is based upon. The basic principle is that if we engage in a disciplined process of saving and investing money over a period of decades, then our wealth will compound as our money works for us, building a surprisingly large amount of savings over the years.
This principle applies whether we're talking about actual interest payments or assumed stock returns, and it is exactly why the advice is so widespread to begin saving for retirement in our 20s and 30s.
However, there's another factor that can be even more important than the length of time invested, and that is the rate at which the money is invested.
It is the interest rate, or rate of return, that drives the compounding and creation of wealth. And if that rate drops too low – the fuel gets cut off, so to speak, and the wealth creation engine stops working.
And as we reviewed in the previous reading, the problem is that in this era of heavily indebted governments and stagnant economies, as a matter of deliberate governmental policy we have very low interest rates – indeed close to 0% in many nations at this time.
So instead of the traditional financial planning model that shows the wealth engine running on 5%, 6%, 7%, 8% interest rates and investment yields, we are instead in a transformed world where as a matter of governmental policy – the fuel has indeed been cut off. Which pulls a world of savers to the left side of the graph.
And if we compare let's say total earnings of just under $12,000 at a 1% return, to about $226,000 at an 8% return – with an identical $72,000 in savings – we see a rather fantastic difference in the amount of wealth that is built up. Indeed, the amount saved is of secondary importance compared to the rate at which those savings compound.
Level Two: Retirement Lifestyle
Now ultimately of course, the point of retirement investing is not to build up a nice looking sum on paper (though that's not a bad thing either). Rather, the idea is to reach a point where we have enough money to comfortably support us in a reasonable standard of living once we have stopped working, or to enhance that standard of living over and above what government benefits are being paid to us as a retiree.
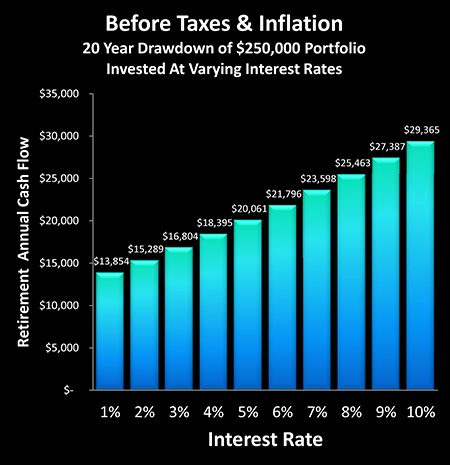
The above graph shows what could be called the flip side of building retirement savings – which is drawing down retirement savings.
The way this is supposed to work, according to the conventional models, is that we can expect to receive significant interest income, although it's not by itself large enough to support us. So we draw down part of our principal each year. And in the early years of retirement, those interest earnings may be the most important part of our cash flow until we've drawn down most of our portfolio, and then in later years we're predominantly relying on drawing down the principal.
Assuming a $250,000 portfolio in this example, if no interest earnings are factored in and all we are doing is drawing down the principal amount of our savings – that is equal to $12,500 per year. However, if we have 6% in interest rate earnings, that is worth another $15,000 per year, and a 9% interest rate is worth another $22,500. When we adjust for the shrinking principal balance over time, at a 6% investment rate we're enjoying a lifestyle based on almost $22,000 of annual cash available, and at 9% that would be over $27,000 per year.
Now if the interest rate decreases sharply, then the amount of earnings is slashed – which means the principal must be drawn down more quickly. And this process feeds on itself as the more rapid drawdown of principal reduces the amount that's invested, which when combined with a very low interest rate radically reduces the amount of cash available to support standard of living in retirement.
So when we look for the standard of living that will actually be delivered in retirement, once again it is the rate of return that potentially dominates.
Returning to the graph, the impact on standard of living from the current very low interest rate environment can be seen on the left. At 1% the annual retirement cash flow that we can withdraw each year for 20 years is down to under $14,000, or less than half the cash we would have available with a 9% yield.
And with rates at 2%, retirement cash flow is still only a little over $15,000 a year, which is a tremendous reduction from the $18,000 to $23,000 with 4% to 7% interest rates.
Unfortunately, many millions of current retirees who are depending on interest income to support their retirement lifestyle are seeing this in action right now. Their cash flow in retirement may be half of what they anticipated it would be, or perhaps 60 or 70%, and the reason for this is no accident.
Plainly put, when governmental and central banking actions distort interest rates and financial yields – whether it be for job creation or for reducing federal deficits and debt levels – they distort the entire playing field. And because of this particular choice of tools which governments are using to battle these problems, the necessary and absolutely predictable reduction in retirement standard of living on a global scale – possibly for the long term – is effectively the "collateral damage".
Level Three: Combining Saving Rates & Future Lifestyles
Now let's combine both levels, which is the building up of savings and their compounding via interest earnings (and investment yields), and then the drawing down of our savings, while using those interest earnings to (hopefully) boost retirement lifestyle. For illustration purposes, we'll assume 30 years of building wealth, followed by 20 years of drawing down that wealth.
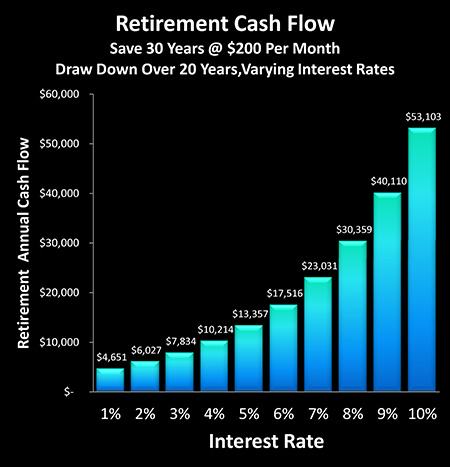
And as can easily be seen, the difference in wealth that can actually be enjoyed in retirement is substantially larger between different interest rates, than it was with either of our previous examples of building wealth by itself, or of drawing wealth down by itself.
For instance, in the draw down-only scenario in the previous section, a 6% yield would produce a little more than half again the annual retirement cash flow when compared to a 1% yield ($21,796/$13,854 = 157%).
However, when we take into account the full reality – which is that retirement standard of living is determined BOTH by the investment rates which govern how much wealth is built and by the investment rates which determine how rapidly wealth is drawn down – then we get a quite different picture. When we combine both the building up and drawing down phases, then as shown in the graph, a 6% yield produces almost four times the annual retirement standard of living that a 1% yield will produce ($17,516/$4,651 = 376%) – again with the identical $72,000 of actual savings over those 30 years.
And this is because the building of wealth and spending down of wealth are multiplicative. Thus if interest rates are low, then wealth builds very, very slowly compared to being in a higher yield environment, and upon retirement, principal must be drawn down much faster even as interest earnings are slashed.
Now this analysis looks at a period of many decades, and of course the fewer the number of years that the playing field is so heavily manipulated, the less the impact will be on our retirement investment. So if we are talking "only" about a five, ten or twenty year period of interest rate distortions, then the effect on supportable retirement lifestyle between the various interest rates will be considerably less.
That said, it is worth keeping the following in mind:
1. As covered in Reading 5, whether the governmental motivation is to create jobs and fight economic stagnation, or instead to wield Financial Repression to manage fantastic levels of federal debt – or to accomplish both objectives simultaneously – these are long term processes that can lead to the the deliberate creation of negative real interest rates for what could be decades.
2. Even interim time periods have "permanent" long term consequences. If financial plans are based upon the steady creation of wealth, and the fuel of this wealth creation goes "missing" for 5, 10 or 15 years – then that wealth is just never created. Unless there is a much higher than normal yield cycle which follows and allows investors to catch up – there is no recovery of this missing wealth.
3. The peak years for wealth creation are the final 10 to 15 years before retirement, given that portfolio balances are at their highest levels, and thus so are investment earnings. For those of us who are "Boomers", then, the time is right now for when most of our retirement wealth is supposed to be created by the investment of those largest balances at healthy yields. And if the wealth isn't built because of governmental interventions – then the consequences are likely to be permanent.
Level Four: Adding Taxes
Now of course with tax deferred retirement accounts, as the name implies – the taxes are not forgiven but merely "deferred".
So we make contributions with pretax dollars, and we compound wealth without paying interim taxes, and whatever we withdraw when the time comes is fully taxable at the then current tax rate.
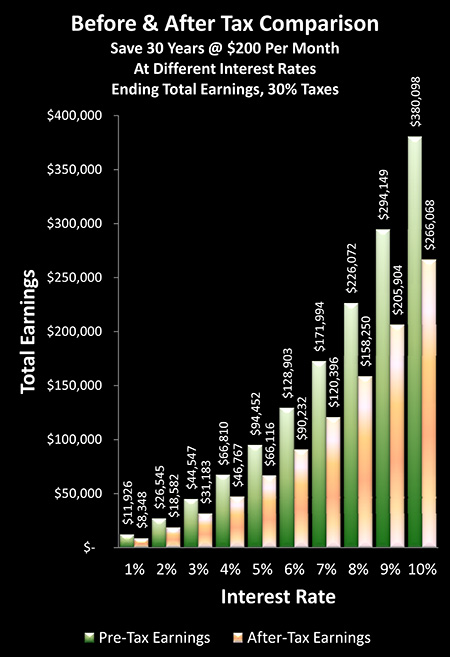
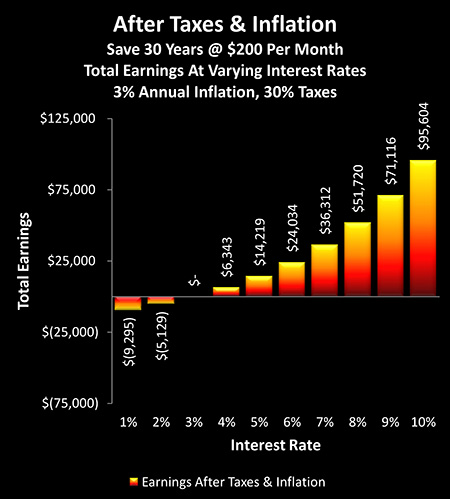
The above graph shows the impact of taxes on the retirement portfolio that we would have built after 30 years, if we had been making $200 monthly contributions over that period.
And if all we're looking at is taxes it's pretty simple.
For each interest rate, the bar on the left is pretax earnings, and taking off 30% of that gives you the after-tax bar on the right. So it is a very straight up and proportionate relationship, with those proportions being based upon the stated tax rate.
While in the United States a combined federal and state tax rate of 30% may seem a bit high for retirees, it should be considered that we're coming into a period of enormous unfunded government obligations still to be paid in terms of not just Social Security but most particularly the far more expensive issue of Medicare. Increased tax rates is thus a reasonable assumption in the years ahead.
(As a technical side note, as we are looking at earnings rather than total withdrawals, to do an "apples to apples" comparison with after-tax earnings, we need to be considering after-tax contributions.
So rather than costing us $200 per month for 30 years, if we assume 30% in taxes for that period as well, it's actually costing us $140 a month. That is, if we had not made the $200 contribution to the retirement account, we would've had to pay $60 in taxes, leaving us with only $140 available to spend or invest.
So the earnings shown in this graph are those above $50,400 in after-tax contributions ($200 X (100%-30%) X 12 X 30) rather than the $72,000 in pre-tax contributions used in previous graphs.)
Level Five: Adding Inflation
The wealth flow of taxes is one thing. And the wealth flow of low yields is another. But as explored in our prior readings, "Hidden Taxes" and "Stock Surprise", when we add inflation to the mix – the convergence of all three wealth flows can produce a remarkably toxic current.
With this reading we have moved on to another entirely different asset category – that of bonds and other fixed income investments. And we have added interest rates to the mix.
So what happens when we completely change asset categories, apply very low interest rates, include the effects of a low rate of inflation that is nonetheless higher than the interest rate, and factor in taxes as well?
We are right back in the toxic zone.
It is not simply a matter of frustratingly low interest rates, although that is the facade. The heart of the issue is that when the governments of the world force yields below the rate of inflation, while continuing to tax those yields, that combination creates a very powerful current that systematically strips wealth from the savers of the world.
As the above graph demonstrates, the lower the interest rate – the greater the force of the current, and the more wealth that flows away from individuals.
If we save $72,000 in pre-tax monthly installments over 30 years, and our interest rate is 5% (with the other assumptions shown), then our after-tax earnings (above after-tax contributions of $50,400) on an inflation adjusted basis are $14,219. Not exactly stellar results, but at least they are positive. Raise the yield assumption to 10% – and real after-tax and after after-inflation earnings are $95,604.
Drop the interest rate assumption to 3% – and there are no real earnings over the 30 years.
Drop the yields further to 2% – and there is a loss of $5,129.
Drop the yields to 1% – and our loss increases to $9,295.
When it comes to the effect of government-created negative real interest rates around the world, then, it could be likened to a massive hand taking savers, investors and retirees on a global basis – and shoving them as far left on the graph as they can go.
(The calculation methodology is necessarily a bit more complex here, due to mixing together taxes, inflation, and reconciling 30 years of monthly payments, with a one-time compounded earnings comparison at the end. The most accurate method for doing so is to compare the present value of the 360 after-tax contributions to the present value of the after-tax portfolio balance in month 360, with any positives being genuine after-tax and after-inflation income, and any negatives being genuine real losses.)
Level Six: What "Negative Real Interest Rates" Actually Mean
"Negative real interest rates" are not a reduction in earnings, nor do ZIRPs (zero interest rate policies) translate to zero earnings.
Negative means just that: negative. And when we take it a step further and integrate the four individual wealth flows of bonds and other fixed income instruments, very low interest rates, low inflation, and taxes, the resulting wealth current is profoundly negative for many savers and bond investors.
But yet – amazingly enough, that is not how they appear on the surface.
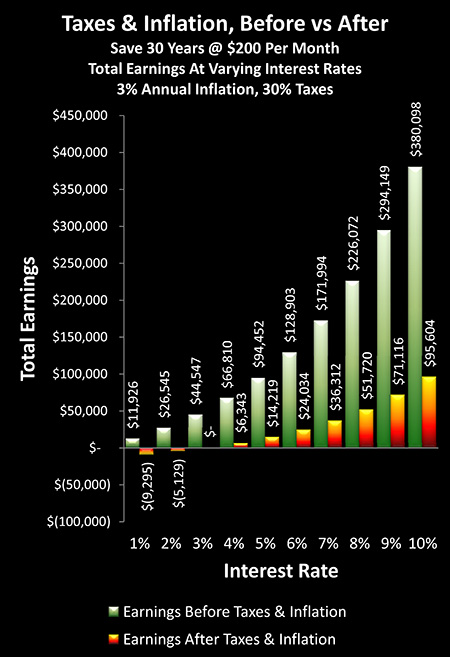
The green bars above represent just plain normal earnings with no economic or tax adjustments of any kind; they are the financial "reality" that is typically all that is presented in the media, and all that is seen by the general public.
As we explored earlier on, when governments force low interest rates on society, then they move everyone to the left.
There is a drastic reduction in building retirement wealth – but wealth is still being built.
There is a drastic reduction in supportable retirement lifestyle – but at least interest earnings are still there to supplement draw downs of principal, albeit at a paltry level.
The portfolio balances still grow, earnings are recognized, and taxes are paid.
However, once we include taxes and even a very low rate of inflation, then as we can see with the red/yellow bars on the graph – everything changes.
In real terms wealth does not grow, but is steadily reduced. And the more that is saved, and the longer that it is saved – the more wealth that is lost.
Now to be clear – someone who has steadily saved will still be in better financial shape than someone who spent every penny. Steady monthly savings do build over time. But each of those monthly savings contributions are supposed to grow in real terms – not shrink in value.
And when it does come time to cash in savings to support retirement lifestyle – there is no supplement from interest income. On a reality basis, then, principal is drawn down each year to pay expenses, and there is a further reduction in principal because of the effects of inflation and taxes. So the longer that retirement lasts, the less the real spending power of whatever savings are left at that time.
Now, the general public sees the green bars; it is their perception of reality as reinforced by the voices of authority and those around them. But that doesn't change reality.
And financial reality must reconcile with individual perceptions of reality. The currents of wealth are what they are, and whether a given current is hidden or not to a particular individual does not change the reality of that flow of wealth for that individual.
It is the disappointing (even if somewhat mysterious) loss of purchasing power – the reduction in actual goods and services that can be paid for – which serves as the mechanism for this reconciliation between widespread and deeply-rooted beliefs about how wealth is built, versus the underlying real flow of wealth.
And this reality check does not get any more real or any more personal than the actual standard of living that is being experienced by many millions of people currently in retirement, as well as the future standards of living of the tens of millions of global investors currently saving for retirement.
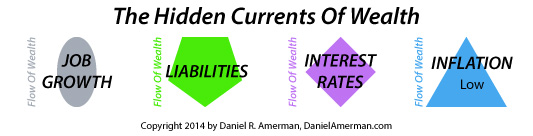
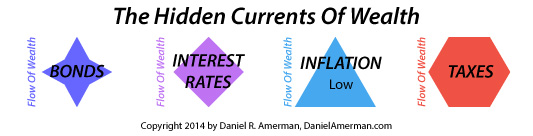
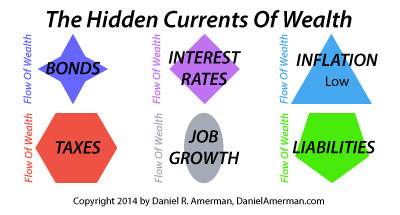
The Hidden Currents Of Wealth
In the previous reading, "Interest Rates, National Debts & Jobs", we combined the four flows of wealth below into a single major current of wealth.

Around the globe, there are major problems with unemployment and economic growth. And most of the nations with these issues also have staggeringly large national debt burdens, leading to further challenges ahead as they try to pay for retirement promises made to aging populations.
As it happens, the agreed upon economic cures for both economic stagnation and massive national debts seem to overlap to a remarkable extent. That is, the consensus of leading economists is that as a matter of policy, nations should create very low, near zero interest rates, while also creating a rate of inflation that is above those interest rates. In other words, they need to manipulate two of the core wealth flows.
This 1-2 combination creates negative real interest rates on a societal basis.
There is nothing controversial about this either, rather this is at the very center of current economic theory. There are a number of links in the previous reading that are worthwhile for learning more. A particularly useful e-book for understanding current economic thinking with regard to job and economic growth is "Secular Stagnation: Facts, Causes and Cures", recently published by the Centre for Economic Policy Research (CEPR), with Lawrence Summers and Paul Krugman among the many prominent contributors.
The websites of the Federal Reserve system are another good source, as are the writings and speeches from people like Ben Bernanke and Janet Yellen.
Now, if you do read these source papers from some of the leading economists in the world, you'll find there is generally a very dry, clinical detachment about the implications for individuals. Oh, there are the occasional expressions of regret when it comes to the effects upon savers. But from these academic perspectives, if you want to change "x", then of course, there have been a number of very well accepted papers showing that "a & b" need to change, and if you want to change "y" as well, then the relevant equations clearly show we need to change "c".
This academic approach is not only widely accepted – it is dominating the financial world right now. Take a look around the globe. The US, the EU, the UK and Japan are quite openly forcing negative interest rates onto savers, albeit with public regrets in some cases that they are having difficulties getting the magnitude of negative real returns which they are seeking.
In doing so, a massive current of wealth has been formed that is changing the lives of many millions of savers all around the world right now, and will likely be continuing to impact standards of living for decades to come, as the deferred effects of today's earning shortfalls are eventually felt.
To help identify the very personal and potential lifelong impact of the academic phrase negative real interest rates, in this reading we added the wealth flows of bonds (and other interest bearing instruments), as well as very low interest rates.
The first three "levels" of this reading looked at the practical effects of very low interest rates on a pre-inflation and pre-tax basis, and we found catastrophic implications when it came to the first level of building wealth within retirement accounts. There were additional major implications when it came to the second level, that of drawing down savings in retirement. We further saw that the worst of the results appeared in the third level, with the 1-2 combination of less wealth built before retirement, and what wealth there was being drawn faster after retirement, each because of lower interest rates.
We then added the wealth flows of taxes and a low rate of inflation, the latter of which was nonetheless still higher than interest rates.
What we discovered was a toxic current of wealth that had similarities to the currents explored in "Hidden Taxes" and "Stock Surprise". The combination of little if any yield, inflation and taxes produced negative returns and negative savings.
In combination, those six wealth flows converge into a single, very powerful current, which completely upends the usual rationale for savings and investment, even while it devastates retirement lifestyles of those following the conventional wisdom.
Now, there are a variety of narratives to help explain how this tragic situation has come to be:
It could be that a dedicated group of public servants and renowned economists are using every tool in their arsenal in the attempt to create jobs and boost economic growth for the greater public good; or
It could be that self-aware governments are quite deliberately concocting a toxic brew of inflation, inflation taxes, and Financial Repression, playing the game several levels of sophistication above what most people understand, so that they and their cronies control a much greater share of societal resources than informed voters would knowingly allow them; or
It could be that a not particularly cohesive global cast of characters, each of whom is pursuing their own individual agendas and self-interests, are – based on imperfect and incomplete information – stumbling through careers and life, and dealing with crisis after crisis as they come along, with ramifications they neither anticipated nor necessarily want to think about.
Whatever the narrative (or blend of narratives) for explaining how we got here, it doesn't necessarily matter that much when it comes to where we are. The current situation is what it is.
Whether deliberately, unavoidably, or completely unintentional – that hidden current of wealth is flowing at full speed as it changes lives around the world, with downstream effects that could impact lives for decades.
It is also a current of wealth that even while directed by the latest economic theory – is not acknowledged in the financial theory of past decades that still underlies conventional financial and retirement planning. These conditions are just not allowed for in that theory.
Markets are supposed to determine interest rates, and make sure investors are fairly compensated for any level of inflation. Markets are not supposed to be overridden by central banks and governments.
Economies aren't supposed to be stagnant – rather they are supposed to reliably build societal wealth over time, after allowing for the historically normal rate of temporary recessions.
Governments aren't supposed to get in such financial trouble with their debts and obligations that they override markets for their own benefit.
None of that is allowed for in the assumptions.
Meaning that our current reality is making a mockery of the theoretical basis for much of long term investment theory.
Yet, millions of investors continue to follow the usual path, in lockstep, being unaware that the theoretical basis for their investment strategies has collapsed, or even if they suspect that's the case, they're unaware of any viable alternatives, with their collective brokers and financial advisors not having any better ideas, and not wanting to upset the "apple cart" of commission and fee income that their own financial security is dependent upon.
There are unconventional alternatives to accepting a completely dysfunctional situation. These alternatives can be found through taking these multiple intertwined currents of wealth, going deep and looking at the fundamentals, determining where the wealth is an inflow ─ not an outflow – and changing strategies so that wealth flows to us, rather than away from us.
How one of the wealthiest segments of society is doing so right now ─ in a way that the average person has no idea even exists ─ will be the subject of our next reading.

If A Friend Sent You This Link
 What you have just read is an "eye-opener" about one aspect of the often hidden currents of wealth which are continually flowing all around us.


If you found this "eye-opener" to be interesting and useful, there is an entire free book of them available here.
All readings in the book are the exclusive property of Daniel R. Amerman, CFA. Subscribers are allowed to print a single copy for their own usage. Any other copying of materials from these readings and reposting or reprinting elsewhere is strictly prohibited and constitutes a violation of international copyright law. If you would like to share these educational materials with others - please use a link to this website.