
Could A Compound Interest Wildfire Threaten US Solvency?
by Daniel R. Amerman, CFA
For the first time since the end of World War II, the total US federal debt now equals 100% of the size the US economy. But while that is obviously a situation of great concern, it may not be the worst of the danger.
Instead, the greatest debt-related threat to the solvency of the United States government and the value of the dollar could be the fact that the US isn't actually making any net principal or interest payments on its debt.
That is, the US government is borrowing money to make the interest payments, even as it borrows to roll over the principal payments – even as it borrows still more to fund the general spending which is in excess of taxes collected.
This creates the risk of a potential compounding and acceleration of interest payments on that debt.
Now government debt in an environment of ongoing massive deficits doesn't work like mortgages or other consumer debt that most people are familiar with. If interest rates rise, then the money needed to make interest payments will naturally rise, and the annual deficit must increase as well.
(The analysis below was published in November of 2014, when the national debt rounded down to $17 trillion. All the concepts remain valid and essential. Eighteen months later and using the exact same methodology, but starting with the higher 2016 rounded down national debt of $19 trillion, then total debt in 20 years starting from that higher point, if rates rise by 5%, is now $94 trillion in 2036, rather than the $85 trillion in 2034 that is shown below.)
However, as shown in the graph above, the heart of the risk is that if interest rates were to rise substantially, there is an acceleration effect that kicks in. At higher interest-rate levels, the cruel mathematics of borrowing to make interest payments on debt – which was itself borrowed to make interest payments on debt – can flash out of control with shocking speed, much like a wildfire in a tinder-dry canyon.
Instead of taking six years for the government to reach $22 trillion in debt outstanding, it could happen in two years. And instead of taking twenty years to reach $35 trillion in debt outstanding – it could happen in about a quarter of the time, or five and a half years.
Quick Debt Illustration
When a government can't pay its basic bills – let alone the interest payments on outstanding debt – then the debt works in a very different way than most of us are familiar with as individuals.
For consumer debt, the required payments are usually higher than the interest charged, so there is money available to pay down principal each month.
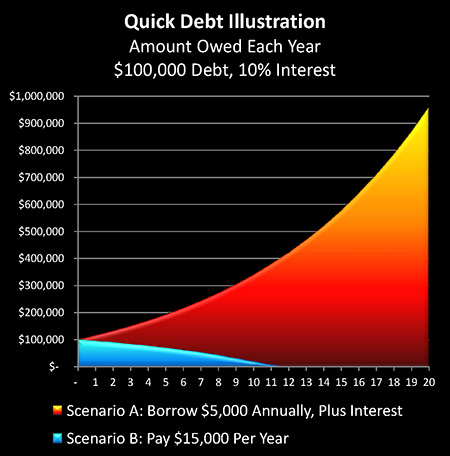
This common situation is illustrated with Scenario B in the graph above, using the round numbers of a $100,000 debt, a 10% interest rate, and a borrower making a fixed payment of $15,000 per year.
After paying $10,000 in interest, $5,000 is available to pay down debt in the first year, which reduces the debt to $95,000, which lowers the interest that is due to $9,500, which frees up $500, which means $5,500 can be paid down in the second year, This continues until the debt is extinguished in only 11 years, rather than the 20 years it would take with constant $5,000 principal payments.
However, this is not the situation of the United States government, which currently is paying neither principal nor interest out of its tax revenues, but is instead borrowing the money to make interest payments, as well as borrowing to roll over the principal payments, on top of borrowing to fund additional spending every year.
If the average person were to behave like the United States government, then they would find themselves in Scenario A above. They would borrow the $10,000 to pay their first year's interest, and they would borrow another $5,000 beyond that to fund their lifestyle.
Which means they would end the first year not $100,000 in debt – but $115,000 in debt. This higher debt level adds $1,150 to their interest due, meaning they now have to borrow $11,500 to meet interest payments in the second year, on top of the $5,000 that's helping to fund their lifestyle.
Debts aren't paid down when interest payments are borrowed, but rather an opposite form of mathematics takes hold – that of compounding. As shown in the illustration above, at the end of 20 years, this unfortunate individual's debt would have compounded to a total of $951,125.
At a 10% interest rate, this means they would need to borrow an additional $95,912 in the next year alone, just to continue to make interest payments, including:
1) $10,000 in interest due on the original $100,000;
2) $10,000 in interest due on the $100,000 borrowed over the next 20 years; and
3) $75,912 in interest due on the $759,125 borrowed to make 20 years of interest payments.
Like a major wildfire, when debt begins to compound out of control it can create its own weather system, in which the dominant force can quickly become not the original debt, nor the additional borrowings to fund normal spending, but the payment of interest on money borrowed to make interest payments. Which means that the interest rate paid on borrowings can quickly become more important than the spending itself, or even the starting amount of debt.
This is indeed the case with the United States government, meaning that on top of the well-known issues with annual deficits and total debt outstanding, there is a third closely related but distinctly different threat, which is the far more acute exposure to the risk of rising interest rates than is generally recognized.
Simply stated, debtors who must borrow the money to make their interest payments have a far greater exposure to rising interest rates over time, than those who make interest payments from ongoing cash flow.
To better understand, we'll explore the issue by applying three interest rate scenarios to the US government's debt and deficits. But first, we need to consider what has kept this debt compounding out of the headlines so far.
The Current Situation
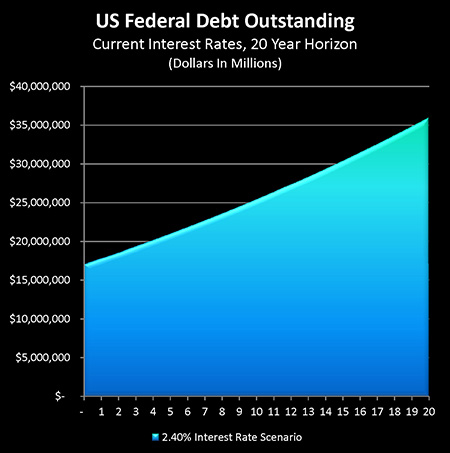
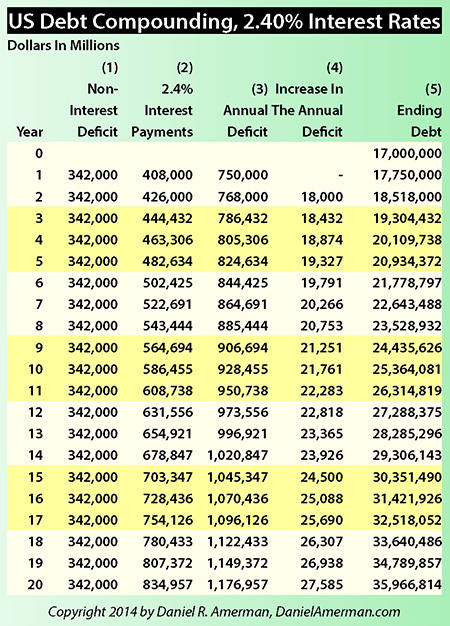
As shown in column (5) of the chart above, our starting situation is that the US government has about $17 trillion in debt officially outstanding. The true total debt which includes unfunded obligations is a separate matter, but for now we'll stick just to what's officially on the books.
According to the United States Treasury Department, the average interest rate on all outstanding US federal government debt is about 2.40%. As shown in column (2), when we multiply that interest rate times the rounded $17 trillion in debt outstanding, we get an annual interest payment of about $408 billion per year (this shifts a little bit with monthly changes in interest rates).
As shown in column (3), a round number for the current US deficit is about $750 billion per year, with the reduction from previous years being the result of the massive tax increase that took effect at the end of 2012.
That annual deficit has two components: general spending that isn't supported by taxes, and interest payments on the debt, which are also not supported by taxes. For our exploration it is essential that we split the two components. So we take the $750 billion total deficit in column (3), we subtract the $408 billion in interest payments shown in column (2), and we get the non-interest annual deficit of $342 billion in column (1).
Increasing Interest Payments
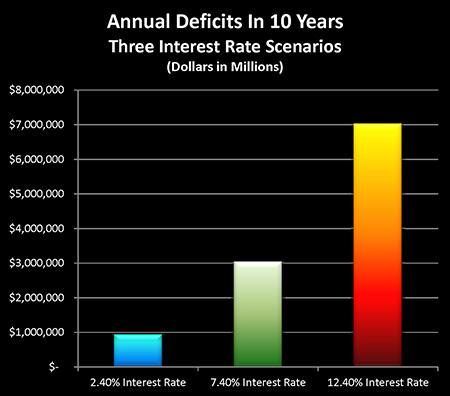
As can be seen with this scenario, with nothing else changing, the federal deficit would compound to be over $20 trillion in four years, it would be over $25 trillion in 10 years, it would reach $30 trillion in 14 years, and after 20 years we would have about $36 trillion in debt outstanding.
That is such a fantastic sum as to be almost incomprehensible. To put it in perhaps more personal terms, it represents approximately $370,000 per current above-poverty line US household.
But what is little examined and remarked upon is that even this situation – impossible as it is – depends upon extremely and artificially low interest rates, that have been created by the Federal Reserve.
So let's now consider what would happen if we returned to let's say a more typical level of interest rates that we have seen over the last 30 to 40 years.
Government Deficits With Higher Interest Rates
The graph and chart below explores what happens to US federal government deficits over time if interest rates were to return to what could be called a more historically normal level, over the period from the mid-1970s to the end of the 1990s. (There is a crucial reason why we are not using interest rates from the 1950s and 1960s, which we will visit later on.)
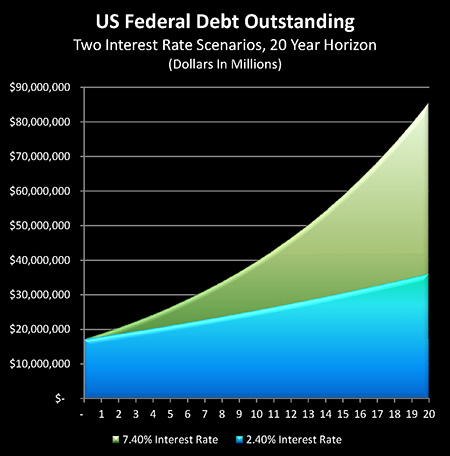
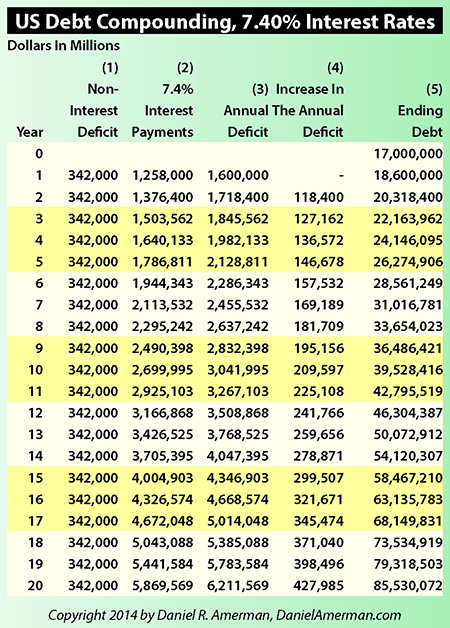
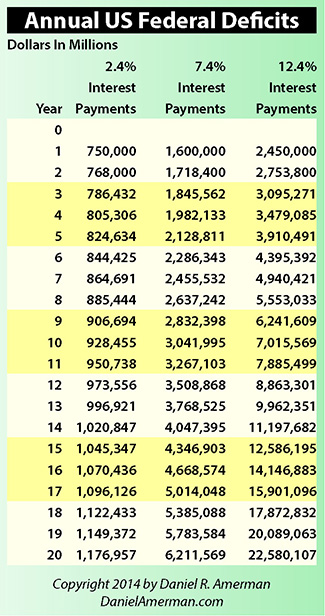
The chart is identical to the previous chart, with one exception – we assume interest rates are 5% higher, so the average interest paid on federal debt outstanding becomes 7.40% instead of 2.40%.
At this higher rate, annual interest payments on $17 trillion in debt jump from $408 billion per year to $1.3 trillion per year (column 2). That is a tripling of the annual interest cost.
When we include the same non-interest payment deficit of $342 billion per year, we now have an annual increase in the deficit of $1.6 trillion, meaning we have just doubled the rate of increase in the overall deficit.
Now mathematically, this quickly has an extraordinary effect.
It means that instead of taking four years to reach $20 trillion in debt outstanding, it only takes two years.
It means that instead of ten years to go past $25 trillion in debt outstanding, it only takes five years. And to reach our total of approximately $36 trillion in federal debt outstanding no longer takes twenty years, but takes only nine years.
This is how compound interest works.
Now some people consider "compound interest" to be something close to magic when it comes to investing money over the long term, and one could even arguably say that the very heart of conventional financial planning is all about the mathematics of compound interest in one form or another. (Or at least this is true when we look at things on a pre-inflation and pre-tax basis.)
As shown in the usual investment projections, we take remarkably small sums of money, preferably starting 20, 30, 40 years in advance, and after some years go by it is the earnings on our earnings that begin to exceed our annual contributions, and then things really start to take off.
However, in the case of a debtor who must borrow to fund the interest payments on their debt, there is a dark side to compound interest as well.
And when we look at the US government as this debtor, and we return to what has been reasonably common interest rate levels over the decades when there weren't massive governmental interventions going on, then we see that this very quickly creates an explosive and impossible situation for the US government.
(It should be noted that there are two major simplifying assumptions with this analysis.
One is that we are treating the interest rates on all US debt as increasing simultaneously. In practice of course, there is a term structure with US debt outstanding, with some of it being very short term, while some is medium term and some is long term.
Debt obligations with fixed rates and longer terms will keep their current low interest rates until the time comes to roll them over.
So if interest rates were to jump to substantially higher levels, this would actually take a number of years to fully reach the level shown in this analysis. That said, due to the potency of the mathematics, the compounding of short-term debt interest payments alone would still be enough to radically bring forward the date at which debt levels become truly unmanageable.
However, of more importance, as previously mentioned, we're not including the rapid increases in non-interest payment deficits over the years, as 4 million Baby Boomers per year reach retirement age and become eligible for Social Security and Medicare. When we take that into account, then the actual picture is worse than what is shown here.)
Much Higher Interest Rates
What would happen if we had true market interest rates for an effectively insolvent government?
When we talk about $17 trillion in federal debt outstanding, what must first be understood is that this sum is based upon the miracles of governmental accounting. The rules are very much written in the favor of presenting numbers that look good when it comes to election time – even if the use of governmental accounting by private corporations or individuals could in fact relatively quickly lead to prison time.
So when we expand our view of federal debt outstanding to take a private sector approach, then as has been reasonably well-established in late 2012 by Archer and Cox, the former head of the House Ways and Means Committee and former head of the Securities and Exchange Commission respectively: based on the numbers in the Medicare trustees report, if we include the unfunded obligations of expected future payments for Social Security and Medicare that are not covered by expected tax revenues in the future, then we have an additional $70 trillion in debt outstanding that is "off the books".
Add that to the official $17 trillion in debt outstanding, and we have a total of $87 trillion in real unfunded obligations outstanding.
Fortunately, interest payments only have to be made on the $17 trillion in official debt (although for those financially-oriented, the compounding as present value becomes future value in each year is its own form of compound interest, which radically increases the real annual deficit).
In other words, the US government is effectively insolvent, absent some major changes. Which is exactly why, we need to anticipate that there will be major changes.
Now let's make a crucial assumption for the sake of exploration, and say that we move to a true free market in interest rates in the future, with no governmental interventions. This would likely mean a substantially higher market interest rate because let's face it, inflation is the only way that these debt levels can be dealt with.
And if we're looking at increased inflation in the world, and a debtor nation that realistically can't pay its bills other than with inflation, then we should expect even higher free market interest rates.
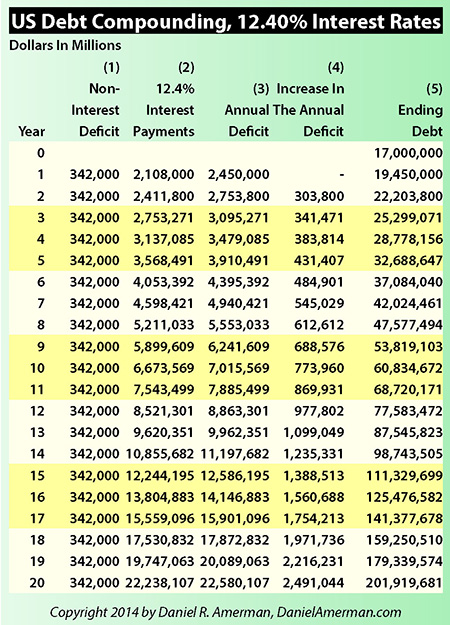
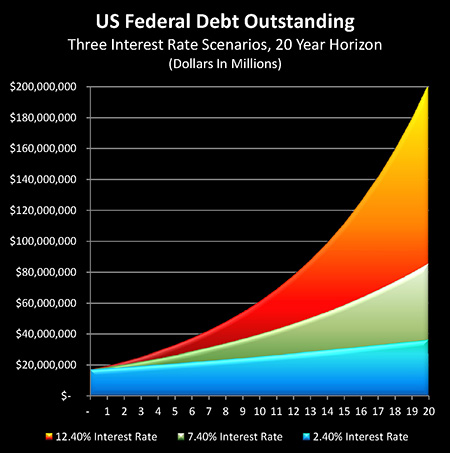
What is examined in the graph and chart above is what the debt and deficit compounding situation would look like if we had interest rates return to more like what they were at the peak of the previous (and lesser) financial crisis during the late 1970s and early 1980s.
Again the chart is identical, except this time we have moved the interest rate up a full 10% to 12.40%.
Now interest rates in the first year are no longer $408 billion, but five times higher at a level of $2.1 trillion (column 2). Add in our official non-interest payment deficit, and we're at almost a $2.5 trillion annual deficit level (column 3).
That means that we reach the $25 trillion debt outstanding mark (column 5) not in ten years, as with current interest rates, and not in five years, as with a 5% increase interest rates – but we reach it in three years.
We are $36 trillion in debt not in twenty years or nine years, but in six years. By the time ten years is reached, the US government becomes $61 trillion in debt.
And by the time twenty years out is reached, the US government would be $202 trillion in debt.
What this shows is that for a debtor nation such as the United States, which has an amount of debt outstanding that's equal to the size of the national economy – an increase in interest rates can very quickly become an existential event.
Now 1) a government can have high debt levels.
And 2) a government can have high interest rates on its debt.
But 3) a government which must borrow to make interest payments, can't combine both high debt levels and high interest rates for more than a relatively brief period of time without setting off an explosive compounding of interest payments and debt.
So then, why has the Federal Reserve made sure we have such very low interest rates in the United States?
It's because forcing artificially-low interest rates on the markets is crucial for a government trying to meet its debt payments and reduce its reported annual deficit over the coming years.
Now if the federal government judges that interest rates can be restrained in other ways, whether through a compliant market, or by returning to explicit statutory interest-rate controls as we've seen in previous decades, or a return to increasing quantitative easing. (It is worth noting that that this process of quantitative easing has not actually ended in the US, it has just stabilized, with the Fed buying enough securities to replace principal payment receipts, thereby keeping total holdings level.)
But something to always keep in mind is how close to the edge the United States is walking right now when it comes to interest-rate payments.
Oh, there can be minor interest rate increases, even a series of them. But if a return to true market levels were to substantially increase interest rates – then we can anticipate future interventions to keep rates below what they would be with a free market.
We are truly walking the edge of a precipice when it comes to the amount of federal debt outstanding, and interest-rate levels.
The Heart Of The Conflagration
To better understand the issues here, we're going to take a look at two further levels of analysis with these three different potential situations.
Our next graph and chart looks at the three scenarios, and compares the annual increase in the debt outstanding – i.e. the deficit – which is column (3) in all three of the prior charts.
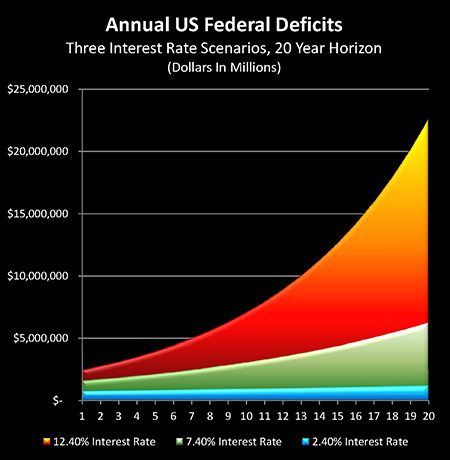
If we keep a 2.4% interest-rate as the result of extraordinary governmental interventions, then the increase is rather slow. It is $750 billion per year in year one, $768 billion in year two, $824 billion in year five, and $928 billion in year ten. It takes until year 14 that the level goes above a trillion dollars a year.
So while the destruction is in process even under current conditions, and even with current interest rates, it's a much slower process.
Now if we look at the annual increase with a 7.40% interest rate, this is where the compounding kicks in – it doubles in the first year to $1.6 trillion.
So we have already exceeded where we would be 20 years from now with artificially-controlled interest rates, if we had a return to more typical market levels over the period from the mid-1970s through the 1990s.
And this annual increase would reach the almost $2 trillion level by year five, the $3 trillion level by year ten, and would be compounding the annual deficit at a fantastic $6 trillion a year by year twenty.
Now if we were to look to appropriate interest rates for an inflationary nation that is effectively insolvent, and we were to move to a 12.40% interest-rate with true market conditions – much like seen in the late 1970s and early 1980s, then the annual level of increase in the deficit is instantly $2.5 trillion.
It is $3 trillion in three years, it's $5 trillion in eight years, it's a whopping $7 trillion a year by ten years out, and by the time we reach 18 years out, it is larger than the size of the US economy.
That is a rather fantastic level when just the annual increase in debt is larger than the total economy.
Putting The Pedal To The Metal
The interest rates paid by the US government on its debt is clearly an existential threat that the government will seek to control. But to see the full extent of the danger, let's take it to one more level.
Let's look at the acceleration of debt, as measured by the annual increases in the annual deficits.
As previously mentioned, many people see compound interest as being a form of financial "magic". And it is the acceleration in interest receipts – or payments – that is the little-known heart of the magic. This can be understood not by looking at the speed – but rather the rate at which the speed is increasing.
If this sounds a little complex, the vitally important concepts involved can become intuitively obvious if we move from the arcane world of financial mathematics to something we are all familiar with, which is how long it takes an automobile to reach a destination.
The speed at which we are traveling right now (the annual deficits) is obviously important. But what is much more important for a trip of any duration is whether we push down on the gas pedal to increase our rate of speed, how far down we push it, and how long we continue to accelerate. More than anything else – these determine the length of time it takes us to reach our destination.
If we have to travel 50 miles, then the important question is not whether or not our current speed is 10 or 12 miles per hour, but whether we push down on the accelerator to raise our speed to 50 miles an hour – or instead to 100 miles an hour.
Applying the automobile metaphor to a national government – our starting location is the amount of federal debt outstanding. Our speed is the annual deficit, as it adds to the debt outstanding each year. Our accelerator is how much the annual deficit changes each year, compared to the previous year.
For a heavily-indebted nation that must borrow not only to meet transfer payment promises, but also to meet all of its interest payments on its debt, then if we want to know how many years we have before we reach our "destination" – the point where the situation becomes completely unmanageable – the most important question is therefore not our current speed, but rather how far down we push the accelerator.
The "accelerator" – the annual increase in the annual deficits – includes both interest payments as well as increases in transfer payment obligations, such as rapidly increasing Social Security and Medicare payments as the Boomers retire in mass numbers.
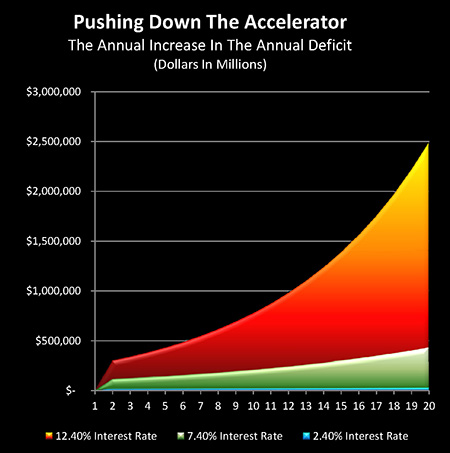
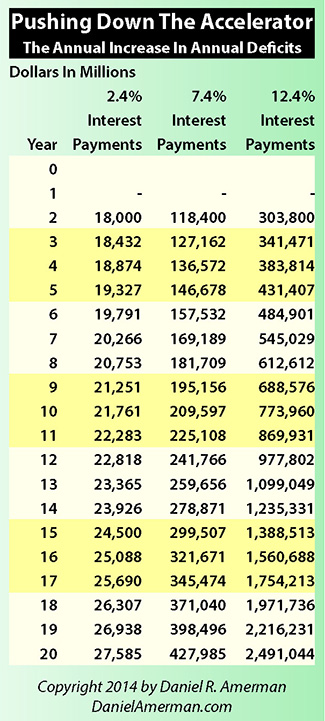
The columns in the chart below are taken from column (4) of each of our debt compounding charts. With our current controlled, below-market interest rates (and not allowing for increasing transfer payments obligations), our increase in the annual increase in debt is a mere $18 billion per year, and this grows very, very slowly over time, not even doubling in twenty years. (You may have to look carefully to see this on the graph above, it is the very thin little blue line.)
This could be viewed as the automotive equivalent of cruising a mall parking lot at ten miles an hour, with no noticeable acceleration whatsoever.
If we look to a more historically typical rate over the time between the mid 70s and when the Fed began aggressively lowering interest rates in the early 2000s, this would be our 7.40% interest-rate – and our increase in the annual increase is $118 billion in year two.
The compounding factor (acceleration) in year two is not three times higher as one might expect in going from a 2.40% to 7.40% interest rate, but rather is six times higher.
By year five, the acceleration is eight times faster with 7.40% interest rates than with 2.40% interest rates ($147 billion compared to $19 billion).
By year ten, this annual acceleration would increase to almost ten times faster, and by year 20, the nation would be feeling the pain of the rate of increase in the rate of increase adding another over $400 billion per year to the increase of the previous year, which is more than 15 times higher than the $27 billion per year seen with the very low 2.40% interest rates that had been artificially created by the government.
To continue our car analogy, this is akin to a driver merging onto the freeway, steadily stepping down on the gas pedal as they accelerate from 30 to 70 miles an hour. The situation is temporarily manageable, until 70 or 80 mph is reached. But if that steady increase in acceleration doesn't let up, the situation gets very risky, very fast, as the car reaches 90, then 100, then 110 miles per hour in heavy traffic.
What is far worse is when we look at the substantially higher interest rate, assuming that we see a return to true market interest rate levels, for an insolvent and inflationary nation.
Our annual increase in the annual deficit beginning in year two is $304 billion instead of $18 billion –17 times as high. This is a truly remarkable number, particularly when we compare it to our 7.40% interest rate scenario, where interest payments took 20 years of compounding to reach the fantastic level of accelerating at 15 times the speed of compounded 2.40% interest payments.
With 12.40% interest payments – that fantastic level of relative acceleration is reached and passed in the first year of compounding.
In dollar terms, the rate of annual increase in the annual deficit doubles in only six more years to $613 billion per year.
And in another six years in year 14, it would have doubled again to where the increase in the increase each year – the amount by which you're getting in trouble on top of the rate at which you were getting in trouble in the previous year – is climbing by over $1.2 trillion per year.
The acceleration in interest payments that occurs with a 12.4% interest rate on debt equal to 100% of GDP is the equivalent of a driver pushing the pedal to the metal and holding it there. Rocketing down a residential street in traffic, through the red lights and past the elementary school.
There are no good endings for that scenario, and it doesn't last for long. All of the possible endings are ugly, and the only questions are the specifics of how long it takes and how ugly it gets.
Much of the media and many investment firms have been painting a picture of increasing calmness and complacency as we're told the problems have receded behind us, and that good times are returning again. Hopefully better times are returning for the global economy; we could all use more of that.
But beneath the surface, there have been fundamental changes that can neither be wished away nor ignored.
The financial math involved is not particularly complex, yet the mind still reels in trying to grasp how this could be so, and just how dangerous it would be at current debt levels for interest rates to return to levels that all of us above a certain age have seen in our lifetimes.
Just as the mind spins in trying to grasp just how large a number $17 trillion in debt really is, and wonders how starting at $17 trillion in debt is going to work out with the retirement and medical expenses of the Boomers still to be funded.
Substantially higher interest rates – that same factor which could set off a fatal acceleration in the US national debt – could even more quickly set off a fire storm of cascading counterparty failures in the global interest-rate derivatives markets, and bring down the global financial system in a matter of days.
When we put all three interrelated, mind-reeling aspects of our current reality together – one thing that clearly isn't happening is a smooth and calm return to normal financial and investment markets governed by rational investor decisions and free market forces, with the last six years disappearing like a bad dream.
Now given this three-way combination of mind-reeling threats – gloom, doom, national bankruptcy, financial collapse and/or hyperinflation are certainly realistic possibilities at some point in the years ahead.
But they aren't the only possibility. Not at all.
Another possible scenario involves markets that look surprisingly normal on the surface and which could endure for decades – even if they are anything but normal beneath that surface. A reality which could render most conventional long-term investment strategies dangerously obsolete.
The Implications That May Govern Our Future
Once we fully accept this relatively simple financial illustration of just how much trouble the US government is in when it comes to the years ahead, then we must also accept the fundamental implications for savers and investors.
First and foremost, as illustrated above, there simply isn't the room for a return to true market interest-rate levels. This is not some radical opinion, but rather a basic mathematical fact – supported by US government history in the 20th century.
Because we've been here before, at least part of the way.
By 1945 and the end of paying for World War II, the US government had a level of federal debt outstanding that was equal to 100% of GDP, much like today. It was no lucky coincidence that interest rates were remarkably low for the next 25 years – that was survival, and part of a quite deliberate government strategy for reducing the debt in a manner that overruled market forces, even as savers earned below-market rates for decades.
The government quite simply could not afford the expense of paying high interest rates on its own debt, or risk having an acceleration of its interest payments set off by unrestrained market forces.
This led to a financial policy by the US government of what has since become known as "Financial Repression" (although it was never described as such in laws or press releases) for a period of 25 years, until the early 1970s. A tutorial which better explains this economic policy of the 1940s to the 1970s – and its return in recent years – can be found at the link, below.
During this 25 year period, there was a steady inflation that eroded the real value of government debts, while savers were prevented from keeping even with inflation (particularly on an after-tax basis), which allowed the government to reliably reduce the real cost of its debt and interest payments, even as capital controls and prohibitions of the ownership of precious metals kept savers and investors from effectively acting in their own self-defense.
The above components are essential to Financial Repression. And combined with a growing economy that also reduced the relative burden of the WWII debts – the package worked, and the toxic debt levels were tamed.
Variations of Financial Repression were played out by all the Western powers, and each was effective – without the public ever fully understanding what their governments were doing.
Given that Financial Repression "worked" in the past across many nations, it might seem that what investors need to prepare for is not a return to the 1980s and 1990s, but rather a return to the much more government-controlled markets of the 1950s and 1960s. The problem is, however, that this is not the 1950s or 1960s.
Back then, the Baby Boom pushed the economy forward all across the nation as consumption rose with tens of millions of children needing to be supported and housed, educated, and then entering the workforce as adults.
At this current stage, what we're faced with is an effectively inverse relationship, which is the Baby Boom retiring en masse and reducing their consumption, even as they demand their promised Social Security and Medicare payments from the government, and even as they cash out their retirement investments together simultaneously, whether directly or through their pension funds.
Most importantly from a governmental perspective, there were relatively few transfer payments in the 1950s and 1960s, so government tax revenues – which were incidentally based on substantially higher tax rate levels than we're seeing right now – were able to focus on basic government functions, as well as making interest payments.
That is of course not the case today, where we now have a vastly expensive transfer payment structure built into our laws, which must be paid for in combination with the interest payments on a compounding federal debt.
Now, interest rates can go up within a range, as they did in the 1950s and 1960s.
They could go up by 1% or 2% over extended periods of time, and – for relatively brief periods of time – they could certainly go up substantively higher than that, just as long as it was only the short term debt that was affected.
So there's a chance we'll see moderate fluctuations in the years ahead, we may continue to see rising interest rates over the next year and more, and we may even see a sharp little spike every now and then, as long as its duration is brief.
But we also have to quite clearly understand that there can be no return to "normal" market interest rates like we saw over much of the last 40 years.
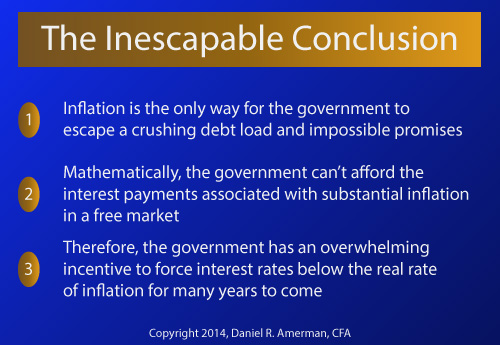
Such an increase would destroy the financial viability of the United States – unless the increase in inflation were even greater. That is the key loophole for the government.
As this analysis demonstrates, the relationships explored do destroy the viability of the US government across all three scenarios. The only question is the difference in time and the speed with which it arrives, particularly when we look at unfunded retirement obligations.
There is one major exception, which is if the debtor controls the value of the currency they're repaying their debt with.
As the United States government does.
So effectively the only defense for the US government, other than reneging and default, is to make promises cheaper to repay in the future than they are right now by reducing the value of the dollar.
This creates a lose-lose-lose situation for most savers and investors.
Number one, they have a rate of inflation that is destroying their net worth (the destruction from real declines in purchasing power works just as well, even if it isn't captured in the official rate of inflation).
Number two, they have massive government interventions on a more or less permanent basis, keeping them from earning market interest rates, and keeping the amount that they are receiving in interest to be less than the rate of inflation.
This occurs even while those interest payments themselves are still fully taxable, meaning they are paying taxes on their annual real inflation-adjusted losses.
This three-way combination of essentially taking wealth from investors and redistributing it to the government (which is also known as Financial Repression) is an essential requirement for the US government if it is to maintain financial viability.
And that means we can expect it to be a long term measure.
Conventional long-term investment strategies don't even allow for this situation, and thus they simply don't have solutions.
However, if we fully accept reality and seek unconventional alternatives, then there are indeed ways to flip this around to our advantage. To turn lose-lose-lose situations into win-win-win situations.
But to do so, we have to first fully understand what is going on, and that means that the first step is education.
 What you have just read is an "eye-opener" about one aspect of the often hidden redistributions of wealth that go on all around us, every day.
 A personal retirement "eye-opener" linked here shows how the government's actions to reduce interest payments on the national debt can reduce retirement investment wealth accumulation by 95% over thirty years, and how the government is reducing standards of living for those already retired by almost 50%.
 An "eye-opener" tutorial of a quite different kind is linked here, and it shows how governments use inflation and the tax code to take wealth from unknowing precious metals investors, so that the higher inflation goes, and the higher precious metals prices climb - the more of the investor's net worth ends up with the government.
 Another "eye-opener" tutorial is linked here, and it shows how governments can use the 1-2 combination of their control over both interest rates and inflation to take wealth from unsuspecting private savers in order to pay down massive public debts.

If you find these "eye-openers" to be interesting and useful, there is an entire free book of them available here, including many that are only in the book. The advantage to the book is that the tutorials can build on each other, so that in combination we can find ways of defending ourselves, and even learn how to position ourselves to benefit from the hidden redistributions of wealth.