
Changing Our Wealth Vision
by Daniel R. Amerman, CFA
Could changing the way that we "see" wealth improve our ability to create and grow wealth?
Let's think about a soccer player trying to kick a goal, or an American football player trying to catch a pass. Are the chances of kicking a goal higher if the player can see exactly where the goal really is?
Are the chances of catching a pass greater if the receiver can see the football in the air?
Of course they are. And there are strong parallels when it comes to wealth.
In this resource, we will learn to "see" wealth in a very different way than most people do. With this improved vision – this ability to see the ball in the air with greater clarity – we will revisit four long term markets, and explore how changing our vision can change everything that we think we know about the financial past.
Now, the reason for improving our vision isn't just to better understand the past - but to aid us in creating wealth in the future. With that objective in mind, we'll discuss four practical steps that we can take with our new vision, which in combination have the potential of transforming our approach to protecting and growing wealth.
A Profitable Investment
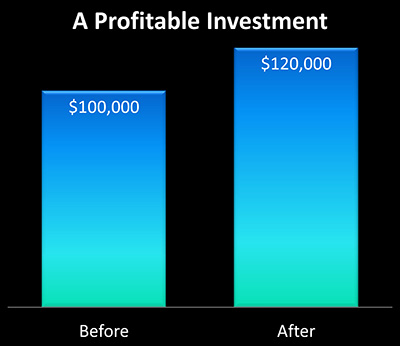
For the first step in our vision exploration, we'll use a very basic, round number example. Let's say we start with a $100,000 asset, and we end up with a $120,000 asset. This asset could be a house, stocks, bonds, a retirement account, precious metals, whatever you want it to be.
In this example, the dollar doesn’t change in value.
Since a dollar started out being worth a dollar, and ended up being worth a dollar, we end up with an asset worth $120,000.
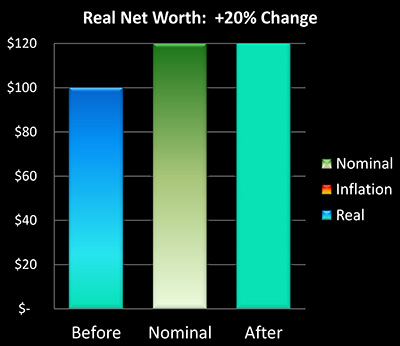
That means our net worth went up 20%, as shown in the above graph. That’s great!
Changing The Value Of A Dollar
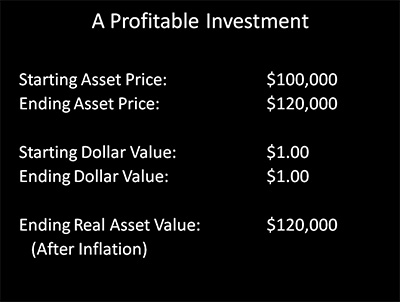
Now let's take a second look. Again, we start with an asset price of $100,000, and end with an asset price of $120,000. Indistinguishable from our previous example.
Only this time, we will add a crucial real-world consideration, which is to have the dollar drop in value over time. For as we all know, the value of money – its purchasing power – steadily declines over time, the only thing that varies is the speed.
We will assume that a dollar becomes worth 67 cents in purchasing power terms – which is common for let's say a 10 to 15 year investment period (in times of higher inflation it could drop to that value much faster than that).
So, if we can sell our asset for $120,000, but each of those dollars in the future will only buy what 67 cents will today, what’s the real value of our asset?
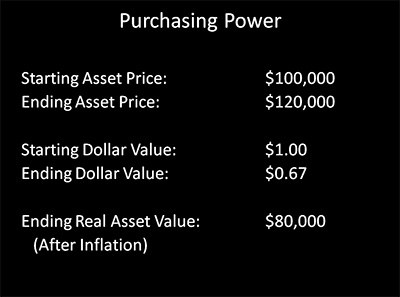
In the graph below, the left bar shows our starting asset of $100,000. If we consider only the ending number of dollars, we have the middle bar of $120,000, which seems to indicate that there was a $20,000 profit. But when we account for each of our dollars only being worth 67 cents in purchasing power terms, the real value of our asset is only $80,000, as shown with the right bar ($120,000 X .67 = $80,000).
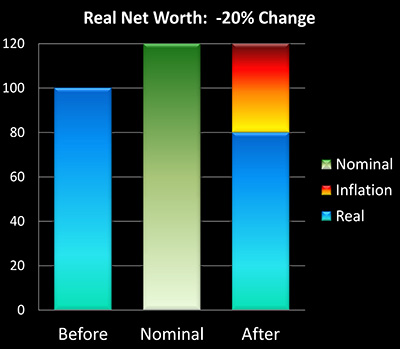
So while on the surface it still looks like we made a 20% gain, the purchasing power of our asset – what it will buy for us – actually experienced a 20% loss. And let me suggest that if we didn't realize this – we are effectively blind when it comes to making the best financial decisions.
First Level Of Wealth Vision
The way most people see the financial world is in terms of profits and losses. This is what we generally see in the newspapers and on television, it is how financial performance is usually reported, and it is what is shown in accounting statements and in tax returns. Quite simply – it is how the world generally "sees" money and investments.
From that perspective, in both of the examples we earned a $20,000 profit, i.e. a 20% gain. On the surface the two are indistinguishable. So looking backwards – we can't actually tell whether we came out 20% ahead or 20% behind. Even more important – when looking ahead to the future and making essential choices, we can't tell if there is a difference between making 20% and losing 20%.
In other words, if the pass is coming down the field towards us, we can't see if it is coming straight towards us, or if it's 10 yards to the left, or 15 yards to the right. We have no idea.
Now becoming aware of this potential inability to distinguish between gains and losses can be downright uncomfortable for many of us, at least initially. But let me suggest that when it comes to the future – it should instead be a cause for celebration. Because it can lead us to an easier and more reliable way of achieving the results we desire.
Investing can be a difficult process for most people. And in the real world, many millions of us may be currently or eventually deferring retirement plans specifically as a result of this difference in vision.
On the one hand, when we look at the number of dollars, most investments inside retirement accounts are indeed up sharply in value compared to ten, twenty and thirty years ago. The major profits are indeed there.
However, when we look at the purchasing power of our investments, what kind of lifestyle they can support given current price levels and the current cost of living – and for how many years – many of us are finding that we are coming up woefully short, compared to where we expected to be. The purchasing power is not there.
Now the past is the past, and there is not much we can do about that. But if looking at financial decisions with improved vision helps us make better choices for the future – then indeed, our chances of success increase sharply.
Second Level Of Wealth Vision
When it comes to improving our vision, the next level up is critical – even if still limited. We now very explicitly see that the value of money is continually changing.
Using this Second Level Of Wealth Vision, if prices rise, whether for groceries or investments or something else, then we have inflation. And if prices fall, we have deflation.
OK, so we're using a more specialized vocabulary now, but what can we actually see?
In our first example, we saw a $100,000 asset increase in price to $120,000, so that would translate to 20% inflation.
In the second example, we saw a $100,000 asset increase in price to $120,000, so that is also 20% inflation.
Uh oh – even with utilizing the most widely-accepted concepts of inflation and deflation, we are still incapable of distinguishing between gaining 20% and losing 20%. For if we say, as most do, that it has to come down to either inflation or deflation – one or the other – then both are inflation.
Once again, we have no idea if the ball is coming straight towards us, or is 10 yards to the left, or is 15 yards to the right.
Third Level Of Wealth Vision (a.k.a. Reality)
Our Third Level Of Wealth Vision is the most crucial of all, and it requires separating changes in the value of money from changes in the value of assets.
After all, the two are entirely different – even if we can't see that with our first two levels of vision.
In the United States and other nations, money changes in value almost continuously as a matter of national policy. Creating a steady but relatively low rate of inflation that reduces what the dollar will buy each year is a stated policy of the Federal Reserve, and this is also true of the central banks in other nations around the globe.
Separately, sometimes stocks have good years – and sometimes bad years. As do bonds, precious metals, real estate and other types of assets. And if we look not at dollars, but at what standard of living that selling a given asset would support – then we have a real measure of wealth, which is purchasing power.
When it comes to the purchasing power of the asset – which is what really matters – in the second example our asset experienced a 20% loss, which we could also call 20% asset deflation. However, our loss was hidden by the dollar experiencing inflation, and losing a third of its purchasing power. In other words, the loss in the value of our money actually hid the loss in the value of our asset.
But this loss can only be seen if we split the valuation of money from the valuation of assets. And as soon as we do so – for the first time we can see exactly where that ball is. It's going 10 yards to the right, not 10 yards to the left, and if we want to get more of what we want – wealth, financial security, and an enhanced standard of living – we better start moving in the correct direction, right now.
For an ordinary person, what are the practical implications for acquiring this much more accurate vision?
It potentially impacts every financial decision – and changes everything.
Revisiting Our Past With Improved Vision
With the improved vision we now have, let's take a look at two of the largest sources of net worth in the United States – housing and stocks. As we'll discover, what history shows us is that for 22 out of the 40 years between 1972 and 2012, much of the truth about financial performance has been almost invisible to people who have been viewing things in terms of just profits and losses, or simple inflation versus deflation.
Things thus didn't work the way most people think they did. Which necessarily means that financial opportunities have been missed, because people have been looking in the wrong places.
We'll start by taking a look at the stock market in a recent time period.
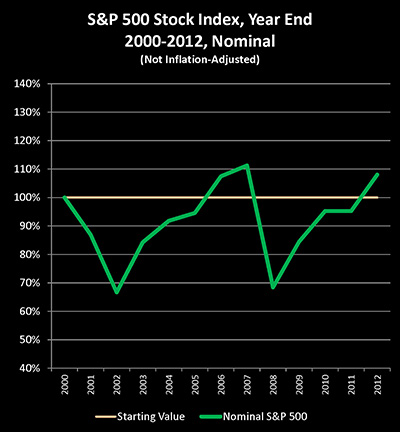
As we can see, the Standard & Poor's 500 stock index bounced around quite a bit between the end of 2000 and the end of 2012, but the end result was an 8% gain over those 12 years. So if we restrict ourselves to saying it has to be either profits or losses, then investors on average had an 8% profit from share price gains.
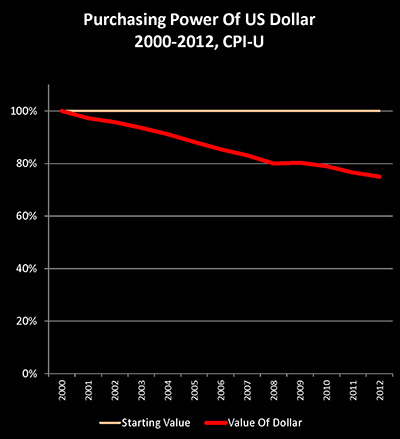
Until, that is, we adjust for the changing purchasing power of the US dollar. And if we take the Consumer Price Index as calculated by the US government, then a dollar by the year 2012 was only worth 75 cents when compared to a dollar in the year 2000.
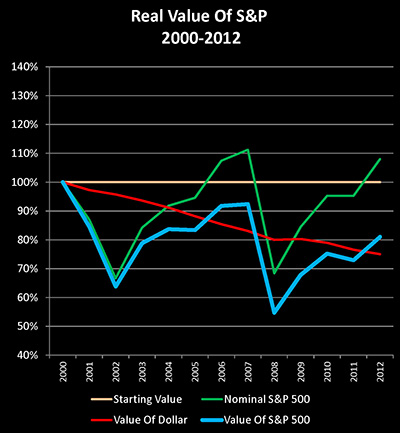
So when we look at historical prices for the S&P 500 (the green line), and we adjust for the falling value of the US dollar (the red line), we get a quite different picture for what happened to the value of the S&P 500 – and to US stocks in general – between the end of the year 2000 and 2012. Which is that in real terms – that is, in purchasing power or inflation-adjusted terms, the stock market fell by 19% over this 12 year period (the blue line).
Now if we look at newspaper headlines, if we look at financial averages as commonly reported, if we look at retirement or brokerage account statements – what we see is that there is absolutely no doubt that the ball was 8 yards to the left.
But if we take into account official US government statistics on inflation, then there is also no doubt whatsoever that the dollar lost 25% of its purchasing power during that time.
And the simple math is that if we have an 8% gain, meaning 8% more dollars, and we adjust for each of those dollars buying 25% less, then we have a 19% loss in what matters most, which is what those stocks will buy for us, their purchasing power. ($100 X 108% = $108; $108 X 75% = $81, $81 - $100 = -$19)
Indisputably then, for the largest investment category in the United States over a 12 year period in the recent past, nearly the entire nation thought the ball was 8 yards to the left, when it was actually 19 yards to the right.
So the natural question then becomes: how can any of us make good financial decisions based on bad information? How can we reliably create and grow wealth when the type of vision that we use is incapable of distinguishing between apparent gains and major real losses?
Now the good news is that there are ways to create real wealth that never even occur to most people because they're limited to the first two levels of financial vision. However, these wealth sources that are "invisible" to them do indeed become plainly visible when a more accurate vision is applied, which enables a more precise assessment of where the ball is.
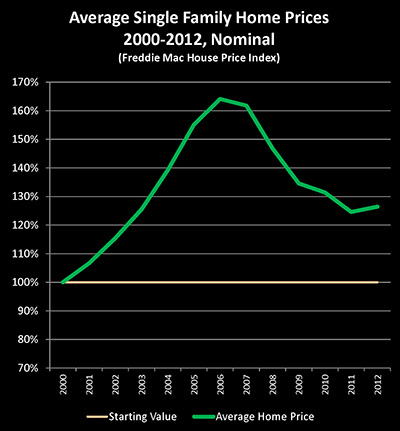
Now, let's take a look at what happened in the real estate market in the United States between the end of the year 2000 and the end of 2012. During the first half of that period through the end of 2006, the average single-family home price in the United States rose by 64%, according to the Freddie Mac House Price Index (the green line). And as we all know, there was a sharp plunge in values with the collapse of the real estate bubble. However, as we can easily see, the plunge isn't as bad as it looks because the average house was still worth 26% more by the end of 2012 than it was in 2000.
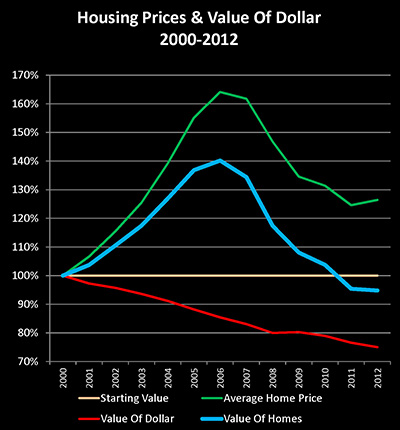
Until we adjust for the value of the US dollar falling by 25% in purchasing power terms over those 12 years (the red line). And when we adjust for inflation, we get a radically different picture of what has happened with the real estate market in the United States over that period (the blue line).
The average real value of a home never rose by 64%, but rather by only 40% even at the peak of the bubble. And in purchasing power terms, the average US home in fact became worth 5% less than it was 12 years before.
In the real world then, when we look at the entire single-family housing market, the truth could only be seen with our Third Level Of Vision. Because a nationally average 5% destruction in the real value of our homes was being entirely masked by a 25% destruction of the value of our money.
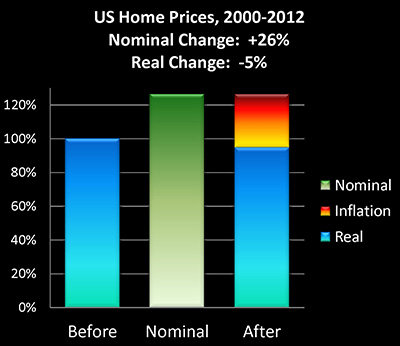
On the other hand, if we take the typical Level One approach of seeing only simple profits and losses, then we can't tell the difference between that real 5% loss and the illusion of a 26% gain.
So with regard to stocks and homes – the two largest components of net worth for most households in the United States – we simply could not distinguish between the gains and the losses. We had no idea where the ball actually was in either case. Which further reinforces the dilemma of how to make good decisions based on bad information.
Is this an anomaly?
Back To The 70s
To answer that, we'll go back in history to a time when the US economy was deeply troubled and struggling with issues of both high unemployment and slow growth – that being the early 1970s to the early 1980s.

The Dow Jones Industrial Average stood at 929 in June of 1972 – and was 812 by June of 1982, ten years later. Now as you may recall, this period also had the greatest bout of inflation that the US experienced in the 20th Century, when in the space of ten years the dollar fell in value by 57%. So when we take our ending DJIA number of 812, and adjust for a dollar only being worth 43 cents – the real value of the index was only 350. In purchasing power terms, what our investments will buy for us – the Dow had fallen by almost two thirds.
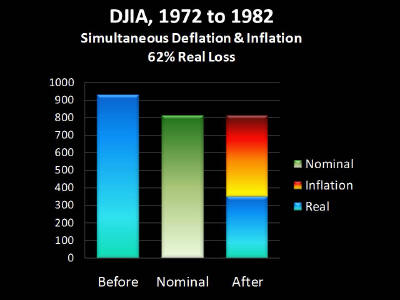
Asset values thus had fallen 62% in real terms, but this was almost entirely hidden by the dollar simultaneously losing 57% of its value.
However, if you are limited by the first two levels of wealth vision – all you will see is relatively mild losses or a case of quite mild asset deflation. And if we don't use a more accurate examination of history to guide us, then we are simply incapable of seeing the 62% annihilation of the value of the stock market which occurred during a time that most of us were alive.
Stocks are of course the single most recommended investment category for retirement and other long term investment. Yet, how often do you hear discussion of this 62% destruction of wealth in the real world?
As explored here, the loss doesn't even exist in the mind of the public because it is outside its vision. Instead, the highly misleading historical narrative is about the market's decade-long struggle to stay level.
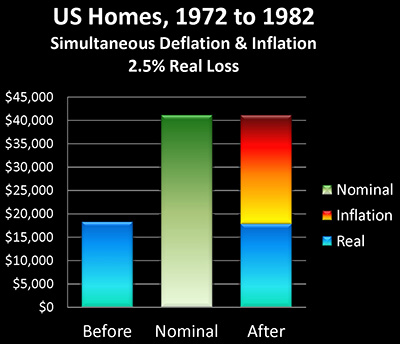
Now how about housing during those same years? In June 1972, the average US home was worth a little over $18,000, and by June 1982 this had increased to a little over $41,000. So the average US home more than doubled in value over a 10 year period, and if you talk to many people who were homeowners during this time, they would tell you their homes were one of the best investments they had ever made.
And for many people, it may very well have been the best investment they'd ever made, but not for the reasons they think, as I explore in the free book that is available on this website. That is because - and this may be sounding a little repetitive, but there can be extraordinary value in being able to see that repetition – we adjust for inflation and the 57% destruction of the purchasing power of the dollar. And then we find that in inflation-adjusted terms, the average home actually lost 2.5% of its value over those 10 years, and about $23,000 of our national average $41,000 home value in 1982 was never a gain in real value, but instead actually represented inflation and the destruction of the purchasing power of the US dollar.
Choosing Our "Game" Vision
So let's pull this all together and see how we did if we were home owners and stock investors over those 22 out of 40 years, and we achieved exactly average results.
If we use the near universal First Level Of Wealth Vision - we were a star athlete / wealth manager. Those were tough years economically and financially speaking, the toughest of the last 40, and yet, we still caught three out of four passes, with profitable returns in each long-term market. The only pass we dropped was during the nightmare of the stock market during the stagflationary 1970s, and even there - we were close, we only lost 8%.
In other words, to use the American football analogy - we were Pro Bowl material.
And everything looks great, until we look at what our investments will buy for us – and find out it is not nearly as much as we thought it should be. So despite our excellent performance, and doing exactly what we were supposed to do – saving with discipline and following the widely-accepted conventional wisdom – things just... didn't... quite work out the way we had hoped. Kind of like they didn't for a lot of other people we might know.
So, we extend the game into overtime, and keep our work income coming in, while we continue our previous strategy of catching the investment passes. We think it's worked before, it's what everyone else does, and we hope it will turn out better in the future.
The alternative and more accurate way to view those four long term markets for housing and stocks is by way of our Third Level Of Wealth Vision, which enables us to see not just "profits", but purchasing power.
With this more accurate form of vision, we clearly and unmistakably missed all four passes - and we knew it in real time as it was happening. We clearly lost purchasing power in every one of those long term markets. We actually didn't even come close to catching the stock market pass in the 1970s like we thought, but rather the ball landed far away in an empty field while we ran between the cheerleaders, over the benches and down the exit tunnel.
Perception is an interesting thing. Some might see this as an issue of optimism versus pessimism, as in optimists enjoy their profits and Pro Bowl status without reservation, while only pessimists spoil the party by adjusting for inflation.
Others might view our Third Level of Wealth Vision as being the very technical and geeky back-end of the process. Simply concentrate on creating as many profits as possible, and let the economics professors worry about purchasing power.
The issue with both of those perspectives is that purchasing power is not just theory, it isn't an emotional state, and it isn't a technical footnote. Rather – it's very real, and it's everything.
True wealth is the purchasing power of our net worth – what it will buy for us. Period. End of sentence.
Four Wealth Vision Changes
If we accept that true wealth what we want, then changing our Wealth Vision enables four powerful changes when it comes to how we practically seek to increase our true wealth.
1. Goal Setting
As explored herein, maximum dollar profits are not the same thing as maximum net worth in purchasing power terms. Because a closer examination of real history shows that what has been called "profits" during quite a few long time periods, have in fact been only the ongoing destruction of the purchasing power of the currency. And when setting our goals, if we don't clearly distinguish between a) genuine gains and b) illusory gains caused by that money having dropped in value – then we quite unnecessarily have major issues.
To more reliably gain true wealth, we have to set increasing true wealth as our very specific and primary goal. Otherwise, even if we appear to succeed, even if we appear to "catch the pass" – we may be nowhere near realizing our actual goal.
2. Real Time Feedback
Looking at financial reality can initially seem almost painful for those who've been used to viewing things on the much more pleasant and optimistic-looking surface.
However, feeling pain isn't always a bad thing, but rather quite the reverse. For example, physical pain is our body's defense mechanism, warning us that something's hurting us, and we should immediately pull back from what we're doing if possible.
This same principle very much applies to our finances and building wealth. If something is hurting us - we need to know about it right that instant. Indeed, the single greatest advantage to using the Third Level of Wealth Vision could very well be this early detection of when things aren't working as planned.
If we are underperforming, if the purchasing power of our net worth starts rapidly heading the wrong direction, then we'd be better off knowing about it as soon as possible. Because if we don't see the problem, then we don't pull away from the source of the pain. We don't make any changes, and what could have been limited to a minor injury can worsen over the years and even decades until we are a long ways away from our actual goal – and it is too late to do anything about it.
This isn't about optimism versus pessimism, but rather about recognizing reality. It may be more comfortable and pleasant to believe that we are catching the passes even when we're not. However, this approach creates the danger of our thinking about the Pro Bowl even as we run through the cheerleaders, on our way to the exit tunnel. The moment the distance starts to grow between us and the ball in the air – we need to know right then, before we ever leave the playing field.
3. Real Time Course Changes
So, we have identified our goal which is to create real wealth, as measured by increasing the purchasing power of our net worth. We use our improved vision to look at our interim results in purchasing power terms. And using this vision, we see that we are going to the left, and the ball is going to the right, so we are not on the correct path.
What happens next? Once we've identified that our current path is not taking us to the goal we have set, we do what any reasonable person would do, and change our course. We shift towards the right and we try to get under that ball.
This is how any long-term process of goal achievement works, whether we are talking about wealth, career ambitions, education, our families and personal lives, or sports. We first set a goal. We then take a series of actions to get to that goal. Not all of the actions succeed, so we continue with what works, while changing what doesn't work, until we (hopefully) reach the goal.
This is common sense, it is something we can all recognize as being the best approach when it comes to achieving important long term goals.
But yet, that is not the path that most of us are taking when it comes to building wealth, or creating financial security, or achieving a comfortable lifestyle in retirement.
Instead, the norm is to set a goal where we can't distinguish between real wealth gains and inflation destroying the value of our money. We measure our progress using a methodology that mixes and blurs together the value of money with the value of assets, so we can't really tell where the ball is or where we are going. Combining this inability to identify exactly where it is that we are going, and our inability to accurately measure how close we are getting, we then decide upon the needed course improvements.
Does that seem like a good approach for reaching a goal as vitally important as our financial futures?
But if we accept that there is a better approach, then we also need to accept that this is not some sort of small and technical footnote on the back-end, where if we want, we can adjust for inflation once the important decisions have been made. Rather, specifically targeting purchasing power and enjoying the benefits of real wealth gains becomes the very front-end of the wealth-building process.
When we accurately see what are our true objective is, and on an ongoing basis we see with clarity how we are actually doing, along with what is working and what is not, which then lets us make informed decisions about needed course corrections in real time – then everything gets better and easier.
4. Nonconventional Strategies For Greater Effectiveness
There is something else we can see quite clearly when we use our Third Level Of Wealth Vision. Which is that the conventional wealth-building strategies often don't work nearly as well as we've been told they would.
It's not a matter of pessimism, it's just reality. And if our goal is to achieve better results, then seeing reality is a very, very good thing. That way we can discard what's not working well, and replace it with something that potentially does much better for us.
Isn't that what we want after all? To identify what isn't working, so we can stop doing it, and replace it with something else that is more likely to help us achieve our real goal?
When we shift our focus from dollar "profits" on our account statements to increasing the purchasing power of our net worth, then all-new opportunities for nonconventional wealth creation open up. Our strategies can become much more holistic as well, because net worth includes everything. Net worth includes not only investments in a retirement account or brokerage account, but also our savings, and our home, as well as our mortgage and other debts. Everything is connected and has its own role in determining that bottom line of maximizing the purchasing power of our net worth.
Factor in everything, value it accurately, set the goal we actually want, measure our progress using reality-based methods, seek course changes when needed, use nonconventional strategies for maximizing purchasing power – and we are far more likely to get where we want to go.
 You have just read an "eye-opener" about a quite different way of seeing wealth, and how changing our vision can transform how we create wealth over the long term.
 A personal retirement "eye-opener" linked here shows how the government's actions to reduce interest payments on the national debt can reduce retirement investment wealth accumulation by 95% over thirty years, and how the government is reducing standards of living for those already retired by almost 50%.
 An "eye-opener" tutorial of a quite different kind is linked here, and it shows how governments use inflation and the tax code to take wealth from unknowing precious metals investors, so that the higher inflation goes, and the higher precious metals prices climb - the more of the investor's net worth ends up with the government.
 Another "eye-opener" tutorial is linked here, and it shows how governments can use the 1-2 combination of their control over both interest rates and inflation to take wealth from unsuspecting private savers in order to pay down massive public debts.

If you find these "eye-openers" to be interesting and useful, there is an entire free book of them available here, including many that are only in the book. The advantage to the book is that the tutorials can build on each other, so that in combination we can find ways of defending ourselves, and even learn how to position ourselves to benefit from the hidden redistributions of wealth.