

The Economic Deception At The Heart Of The Fiscal Cliff
by Daniel R. Amerman, CFA
Truth Testing The Narrative
Among many politicians and much of the media there is an accepted narrative about deficits, taxes and the so-called "Fiscal Cliff". It goes something like the following:
"The United States is running massive deficits that are bankrupting the country. These deficits are so high because of the Bush era tax cuts.
So if we just end the tax cuts that caused this deficit in the first place, and make the rich return to paying their fair share of taxes, then much of the deficit problem is solved."
For millions of people in this country this is a compelling narrative, and understandably so. Because if we're so heavily into debt because of tax cuts that were given to the privileged, we need to just end the tax cuts and then the downward spiral ends -- which seems fair enough.
There's only one problem with this narrative – it isn't true.
To uncover the hidden truth about the Fiscal Cliff we're going to explore seven layers of the trillion dollar a year sleight of hand which hides the real US economy, and is the actual source of the deficits.
For the first time, we'll examine the hidden "math trap" that the private sector has fallen into when it comes to supporting the public sector, and the extraordinary implications for all of us, particularly long-term stock investors.
Based on the math trap, we will show the staggering 40% increase in tax rates that would be needed to return the budget to 2007 levels, if this is to be done without reducing government spending.
Even in the unlikely event that the current Fiscal Cliff tax increases go through in full, those would cover only half of what is needed to pay for the transformed relationship between private and public sectors that was confirmed in the 2012 elections. Once we understand that, then the true nature of the Fiscal Cliff becomes clear: it is but the first step in an ongoing process, and the government will be coming back, again and again, in what may dominate the economy, investment returns and individual standards of living for decades to come.
Fiscal Cliff Overview
According to the Congressional Budget Office (CBO) and the White House, the Fiscal Cliff has three components for the next year:
1) A $112 billion cut in discretionary spending that will include ending extended unemployment benefits, cuts in the Defense department, and reducing Medicare payment rates for doctors, among other types of discretionary spending.
2) A $399 billion increase in tax revenues; and
3) Another somewhat obscure $105 billion in mostly projected "revenues" that result from economic growth.
The CBO is therefore projecting about $4.5 dollars in new revenues (increased taxes), for every $1 in spending cuts. Given that item #3 is pure guesswork on the CBO's part, we'll just examine the two straight-forward deficit reduction components. These total about $511 billion out of what the CBO estimates would otherwise be a $1.2 trillion deficit for fiscal year 2013. This is a massive reduction in the deficit – even if despite these draconian measures, most of the annual deficit remains outstanding.
Now among the most puzzling parts about the narrative and the spin surrounding the Fiscal Cliff is that the reduction in spending is sometimes referred to as the lead part of the story, and the tax increase is sort of the footnote that follows it.
The reality is, however, that what the Fiscal Cliff package is all about is a 3% reduction in spending and a 20% increase in individual tax revenues. In other words, it is actually primarily about a massive tax increase rather than a significant cut in overall spending. According to an October 2012 analysis by the Urban Institute and Urban-Brookings Tax Policy Center, the average tax increase per household would amount to $3,500, with the average middle class household seeing about a $2,000 increase.
Layer One: The Placid & Deeply Misleading Surface
The official version regarding the US economy is that there was a short recession that accompanied the Financial Crisis of the 2008. That between 2007 and 2009, the US Gross Domestic Product fell by 2%, and the recession ended in June of 2009. And since that time the US GDP has rebounded to over $15 trillion, and the nation has never been wealthier.
Now there are many among the public that don't entirely accept this version; in fact opinion polls show that a majority of the American people believe that the economy is in worse shape than the government says it is. And indeed, we only need to look at the term "Great Recession" to see the doublespeak and understand that the government and establishment are not being truthful about the economy.
That is, while the official numbers assert that a relatively brief recession ended in June of 2009, and that the US economy has never been larger than it is right now, there is simultaneously a quite open acknowledgement of the "Great Recession". Both obviously can't be true at the same time; either a short and not particularly deep recession ended long ago, or there is a severe recession that is still ongoing.
This conflict is the result of the common but overly simplistic approach of boiling the entire economy down to one number -- that of total GDP -- and gauging the economic health of the nation based on that one number. But if we go down just one layer beneath that single number, the conflict disappears - as does the recovery.
Layer Two: The Trillion Dollar Swap
The central problem with the US economy is that a big chunk of it effectively collapsed between 2007 and 2009, and despite claims to the contrary, it has not since recovered. Consider the graph below:
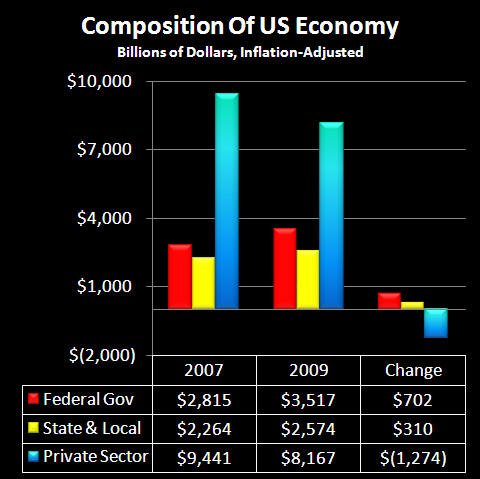
The private sector within the economy plunged by $1.3 trillion per year. The devastating effects of this collapse were, however, immediately covered over by the government ramping up its spending by $1 trillion per year (between state, local and federal governments).
So one could say that an economic sleight of hand was deployed. When the private sector fell by $1.3 trillion, the public sector simultaneously and on an unprecedented basis jumped by $1 trillion, thus fundamentally changing the composition of the US economy. However, when we look at the surface level of the economy as a whole - which is what the economic growth statistics and newspaper headlines are based upon - there is no way of seeing what actually happened. Instead, it appears as if the economy shrank by "only" $300 billion.
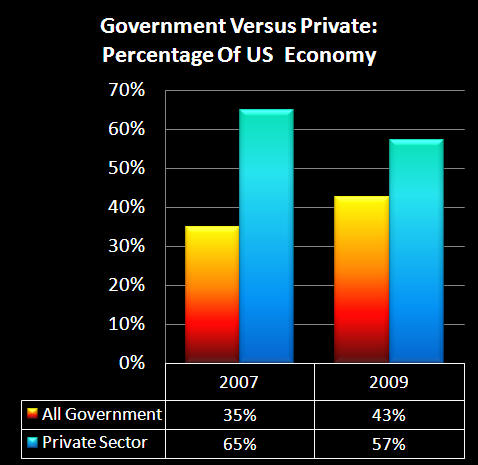
In an economic heartbeat, we jumped from the government consuming 35% of the US economy to the government consuming 43% of the US economy. Three years later at the end of 2012, the situation remains the same, with government spending still stuck at an extraordinary 43% of the US economy.
So when we look at the illusion of economic recovery, we see that it is dependent on the inability to distinguish between the government's spending money versus a private economy creating jobs and real wealth.
There are serious issues with this sleight of hand, one of them being that the government didn't and doesn't have the money to pay for the sudden surge in spending required for the public sector to go from 35% of the economy to 43% of the economy.
The private sector of course generates the taxes that pay for the public sector. So when we do a substitution of public for private on a trillion dollar scale -- even if the superficial picture that is presented does effectively deceive the public -- when it comes to taxes, the damage can't be concealed indefinitely. The loss of $1.3 trillion dollars of healthy, tax-producing wealth and jobs necessarily pulls down tax revenues, even as government spending instantaneously soars by $1 trillion per year.
Layer Three: A 28% Reduction
Now it would be easy to miss just how devastating this under-the-surface swap of private for public GDP was when it comes to the economy and tax revenues. One might think, "just 8% of the economy swapped, and that is less than 10%, which may not be good, but it's not that huge a deal, right?"
Wrong. What makes it a huge deal is that the two happened simultaneously. When the private sector started at $9,441 billion in 2007 and fell to $8,167 billion in 2009, that was a decline not just of 8% of the total economy, but of 13% of the private sector. And when the public portion of the economy rose from $5,079 billion to 6,091 billion in two years, that was an increase of 20% in public spending.
If we think about this like we would our household, and the wealth coming in drops by 13% at the exact same time that the expenses going out increase by 20%, then we have a much bigger problem than any of the individual numbers of 8%, 13% or 20%.
A single number that captures the bigger picture is to compare the ratio of the wealth being created by the private sector to the wealth being spent by the public sector.
When we divide $65 in private sector dollars in 2007 available (wealth coming in) to support every $35 in public spending (wealth going out), the ratio was $1.86 in private sector dollars available to support every $1 in government spending.
But beginning in 2009 through 2012, there were only $57 in private sector dollars to support a higher $43 in government spending, meaning the ratio of the private-public sectors fell to $1.33 to $1.
That is a 28% decline in private wealth creation available to support each dollar of government spending. This is really not looking good, but unfortunately, we need to take it one level further.
For those interested in the math, the four simple equations for Layers 3 & 4 are as follows:
$65/$35 = 1.86
$57/$43 = 1.33
1 - (1.33/1.86) = 28%
(1.86/1.33) - 1 = 40%
Layer Four: The Math Trap That Consumes Taxpayers & The Markets
There is a math trap that has consumed many an individual investor, and it has to do with the importance of avoiding losses. This math is even more important for economies than for individual investors, and indeed a worst case scenario for investors as a whole is when an entire economy falls into this trap, as the US private economy has.
In the simplest form, consider an investor who buys an investment for $1,000 and later sells it for $500. This is a 50% loss, so on the surface it might seem that the investor has to earn a 50% profit on his or her next investment in order to break even.
That is where the trap comes in. A 50% profit on the $500 investment only brings the investment back up to $750, so the investor is still down $250. To recover from a 50% loss takes not a 50% gain but a 100% gain, which means a $500 profit is required to get that $500 investment back to its $1,000 starting position.
The problem is that the "base" of the investment got knocked down. And once down, a far bigger percentage gain is needed to recover, which makes it not only more difficult to do -- but also more statistically improbable.
For the US economy then, a 28% decline in the ratio of private wealth to public cannot be offset by a 28% gain in the private economy. For when we multiply the $1.33 ratio in private-public sectors by 1.28 we only get $1.70 - because the base is down.
For the US economy to return to its 2007 level, the private sector would have to grow by 40% while public spending remains constant. Thus an extraordinary amount of real growth in private wealth would be needed to fix the situation, even while making the improbable assumption that the government would agree not to increase spending one dime in real terms.
America fell into the math trap, and is stuck in it right now. And it is likely to dominate the factors that determine long-term stock market returns for decades - even if few people yet recognize the extraordinary significance of what was hidden beneath the surface of a supposed minor 2% decline in GDP between 2007 and 2009.
It needs to be understood as well that the costs of systemic deception go far beyond deficits. As covered in my article, "High Government Deficits 'Crowd Out' Stock Market Returns", linked below, there are catastrophic implications for long-term stock valuation, which then means that the primary long-term wealth creation vehicle for both traditional retirement planning strategies and pension funds is no longer operational. This is the case even as tens of millions of retirement investors continue to stake their financial futures on an economy and economic order that hasn't existed for quite some time.
http://danielamerman.com/articles/Crowding.htm
Layer Five: Raising The Taxes By 40% & The True Nature Of The Fiscal Cliff
If we can't increase the size of the private economy sufficiently to support the public economy, the government has another means to the same end: just raise the tax take from the private sector of the economy by 40%, and the results are the same as if the economy had grown by 40%.
(For simplicity, we're leaving aside the critical issue of the likely associated reduction in private sector growth rates with higher taxes.)
When we understand this clearly, then for the first time, the true nature of the massive tax hikes contained in the Fiscal Cliff come into view.
The Fiscal Cliff is based on the official narrative of a miniscule and temporary decline in the overall economy, and on the reversal of unfair tax cuts. But the trillion dollar reality revolves around the largest increase in government spending in history, which continues to cover up the catastrophic wreckage in the private sector. And it is being paid for by the largest tax increases in US history.
Because there has been a 28% decline in the number of private sector dollars to support each dollar of public spending, and taking into account our "math trap" and that the base of the private economy has fallen dramatically, the public sector needs to increase its take from the average wealth creator in the private sector by 40% per year, if the extraordinary deficit crisis is to be ended.
The Fiscal Cliff legislation is a halfway step in that direction, with a 20% increase in tax revenues out of the total 40% that is "needed". How much of this will actually survive the negotiations we can't yet know, just as we don't yet know the exact particulars of where the tax increases will hit.
But when we understand the source of the "problem", then we understand the most essential information of all, which is that the Fiscal Cliff is not a one-time event - but a process. The next stages in the process will have similar goals even if possibly different names, and likely different explanations will be used to mislead the public.
But the government will be back to raise taxes again, likely again and again. It will be back because the world we knew in the latter half of the 20th century and the early years of the 2000s is gone for good. The swap of private for public happened, and the results are likely to dominate the economy and taxes for decades to come. Even if most of the general public never understands a bit of what is really going on beneath the deceptive surface.
Hidden beneath the surface of the minor 2% decline in GDP between 2007 and 2009, was one of the largest economic changes in US history, with the end result being that each private worker is now responsible for carrying a 40% increased burden when it comes to paying for public spending. And if that massive swap of private for public continues to be defended in elections - as it was in 2012 - then that burden must be borne for the rest of our lives.
There is another way to approach this "needed" 40% increase, which is with a simple "back of the envelope" calculation:
Start with the CBO projected deficit for 2013 of $1.2 trillion, with a 57/43 private-public sector split and no Fiscal Cliff changes.
Subtract the $400 billion tax increase component of the Fiscal Cliff.
But since the Fiscal Cliff increases taxes by only 20%, double it from $400 billion to $800 billion to include the effects of a full 40% increase in taxes.
Subtract the $800 billion from the $1.2 trillion and we are left with a $400 billion deficit, which is in the range for the deficits prior to the Financial Crisis of 2008, back when the the economy had a 65/35 private-public split. In other words, 1.33 times 140% does indeed equal 1.86.
Layer Six: The 2012 US Elections & Spending
Of course there is an another way out of the "math trap", which is by slashing spending. Which brings us back to the 2012 US election. Neither party ran on massive spending cuts, the option wasn't even on the table. And the results of the election could be construed as not only endorsing the public for private swap of 2007-2009, but setting the stage for an ever-expanding public share of the economy.
There also wasn't a chance to vote on the separate issue of whether the public share of the economy would continue to grow or not. Both parties were making absolute promises to the all-important older voter segment that Social Security and Medicare would be there for the bulk of the Baby Boomers and those older. There was an election to win, victory was all that mattered from the perspective of the politicians, and the political calculus therefore required making those assurances.
What this translates to are annually rising costs for Social Security and Medicare that exceed the rate of growth in the overall economy. Which means the amount of private sector wealth available to support each dollar of public sector consumption drops a little more each year, increasing the shortfall, and also increasing the severity of the math trap.
The trillion dollars a year in emergency measures went to many millions of people. But after several years, and human nature being what it is, this unprecedented and massive redistribution that was undertaken to cover up economic disaster now seems to have become the rightful income for many millions of citizens. People who have neither the knowledge nor concern about hidden economic swaps, GDP components or hidden math traps, but who will (and quite rationally) vote to defend what they see as their rights to their income and to their lifestyle, as was seen in the recent elections.
Layer Seven: Deceptions & Investments
The moral of the 2012 elections is that if politicians have the choice between facing unpopular and unpleasant truths, or creating pleasant deceptions, they will consistently choose pleasant deceptions.
Now as we just saw on November 6th, this not only works in practice – but we could even say that the voting public insists upon this approach. This was also shown to be true earlier this year in France. When faced with an economic system that could not possibly meet retirement promises with a retirement age of 62, the French voters put into office a president who promised to reduce the retirement age to age 60. They wanted the fantasy and the promises instead of dealing with the harsh truth of what was going on.
This is human nature and is therefore predictable. What I have been writing about for many years now has been the deceptions that will, from a governmental perspective, necessarily be a part of dealing with an increasingly impossible economic situation that has been building for decades when it comes to retirement promises.
Impossible promises have not only been made in many nations, but the voters seem to favor making those promises more impossible than ever.
Therefore, I believe that the central task for long-term investors is not to invest for the status quo, but rather to invest for the breaking of impossible promises in a deceptive manner.
The bottom line is that there simply isn't enough wealth to go around; there isn't enough wealth to give the voters what they have voted for themselves. This necessarily means that the promises will be broken, and likely in a manner in which the voters will never quite understand.
To even partially meet those promises will require a major redistribution of wealth. Which from a political perspective, as the false narrative behind the Fiscal Cliff demonstrates, must be done in a increasingly deceptive manner. Now let me suggest that for those who do not invest in anticipation of that process, that it will be their wealth that will be redistributed. And just as most voters won't understand why the lifestyle they voted for themselves never turns out to be as good as what they thought they voted for, much of the redistribution of wealth from investors and their retirement accounts will be done in a manner that is sufficiently complex to assure that most people will not understand what is happening.
Let me also suggest that what the 2012 election results illuminate is a very stark personal choice. Either we can educate ourselves and learn how to pierce through the multiple levels of deceptions, in order to understand and resist the re-distribution of wealth within an economy and markets that are ever-more dominated by the government, or we can face the personal consequences. These consequences may never dominate the headlines, or be discussed in the presidential debates, but they are all too likely to determine the day-to-day standard of living in America and other nations, particularly for retirees.
 What you have just read is an "eye-opener" about one aspect of the often hidden redistributions of wealth that go on all around us, every day.
 A personal retirement "eye-opener" linked here shows how the government's actions to reduce interest payments on the national debt can reduce retirement investment wealth accumulation by 95% over thirty years, and how the government is reducing standards of living for those already retired by almost 50%.
 An "eye-opener" tutorial of a quite different kind is linked here, and it shows how governments use inflation and the tax code to take wealth from unknowing precious metals investors, so that the higher inflation goes, and the higher precious metals prices climb - the more of the investor's net worth ends up with the government.
 Another "eye-opener" tutorial is linked here, and it shows how governments can use the 1-2 combination of their control over both interest rates and inflation to take wealth from unsuspecting private savers in order to pay down massive public debts.

If you find these "eye-openers" to be interesting and useful, there is an entire free book of them available here, including many that are only in the book. The advantage to the book is that the tutorials can build on each other, so that in combination we can find ways of defending ourselves, and even learn how to position ourselves to benefit from the hidden redistributions of wealth.