
Chapter 11: The Wealth Function, Fed Cycles & Stratospheric Asset Prices
By Daniel R. Amerman, CFA
TweetThere is a mathematical function that forms the very bedrock of investment valuation. When we look at the continuing effects of the extraordinary measures which the Federal Reserve took to contain the Financial Crisis of 2008 and the Great Recession, and we run the numbers through that function, what it tells us is that the end result should eventually have been some of the highest valuations for stocks, bonds and real estate in history.
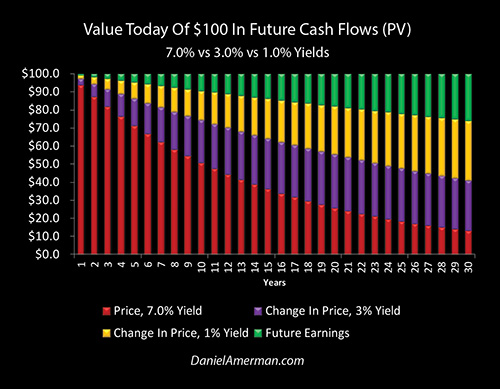
To see what the mathematically supported increases in valuations have been - in generic terms and across multiple asset categories - we can compare the red bars of long term historical valuations, with the purple bars of what current valuations should be.
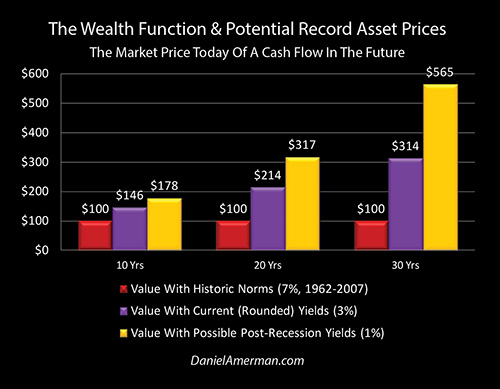
A cash flow from any source (it could be stocks, bonds or real estate) that is ten years out and would have been worth $100 in ordinary times, should now have a value of $146, all else being equal. And a cash flow 30 years out should now have a value of $314, which is 3X what it would have been in the decades before the financial crisis.
The unprecedented and extraordinarily powerful interventions made by the Federal Reserve in order to contain the last cycle of recession and crisis, also necessarily created the mathematical foundation to support many trillions of dollars in new wealth - and that is exactly what we have. Many millions of households currently enjoy very elevated values for their homes and stock portfolios because of this new foundation, and many fortunes were made in the path to those elevated levels.
We could very well see another round of recession and crisis in the next few years, and the near term results could be devastating for most stock portfolios and home valuations. However, if we examine the even more extreme measures that the Fed intends to use to overcome the next cycle of recession, and we run the numbers through the Wealth Function, then we can see that the end result could be a mathematical foundation for the golden bars. What would in ordinary times have a value of $100, could be worth $178, or $317 or even $565. We could eventually see the highest asset prices in history, with far higher levels than even those of today.
To understand how the dire event of another cycle of recession could eventually lead to another and amplified cycle of record prices for stocks, bonds and real estate - we need to be able to follow the math. Using graphics and a series of simple to follow examples, this analysis will explain how the math works, and show how the Fed's planned even more extraordinary actions for the containment of a possible new cycle of crisis could potentially end up creating one of the most profitable investment markets in history.
This analysis is the eleventh chapter in a free book, an overview of the rest of the book is linked here.
A Challenged Fed & Record Asset Prices
The Federal Reserve was faced with some major challenges as it tried to contain the damage from the Financial Crisis of 2008, and to bring the nation out of the Great Recession. Indeed, the Fed used interventions of extraordinary and unprecedented strength, including following zero percent interest rate policies for seven years. The Fed also created literally trillions of new dollars via quantitative easing, and used the money to take an unprecedented degree of control over medium and long term interest rates, forcing them downwards.
In the years that followed, we have seen record stock index prices.
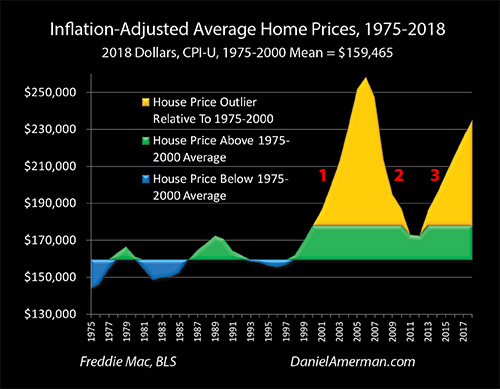
Across the nation, we have seen record home prices on an inflation-adjusted basis (link here).
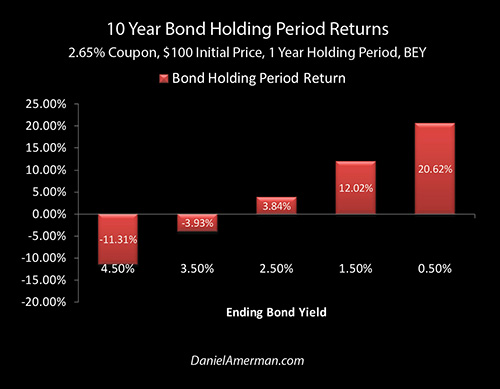
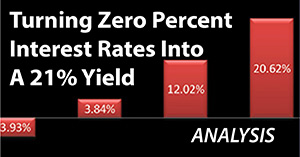
We face the possibility of a new recession within the next one to two years, and if that happens - the Federal Reserve is likely to slam interest rates straight back down to zero percent in the attempt to contain the damage, while resuming quantitative easing. That sounds pretty bad - and it would be very bad for many investors - but it could also result in one year returns of 21 percent and more, as shown in the graph above (analysis link here).
As explored herein, record asset prices can exist not in spite of the Fed's unprecedented actions to contain crisis and exit recessions, but rather, record asset prices can be the direct result of those extraordinary actions. The source of this counterintuitive relationship is a mathematical function that exists at the very foundation level of investment valuations
The Wealth Function & Future Wealth Creation
A function is a special mathematical relationship where each input has a single output. Change the input that goes into the function, and there will be a new output that will come out the other side of the function, in an exactly predictable manner. Functions are critical for mathematics, programming, many fields of science - and the bedrock mathematics of finance and the creation of wealth.
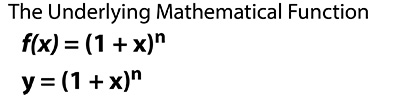
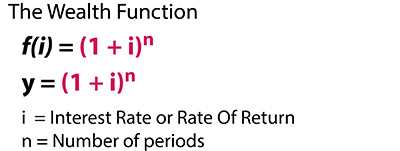
The above is the general form of a straightforward mathematical function, which is f(x) = (1 + x)^n. It can also be expressed as the equation y = (1 + x)^n (which may be easier for some people to follow). The input or independent variable is X. Whenever the value of X is changed, then we also get a direct change in the value of the function output, also known as the dependent variable of Y. It should also be noted that this is an exponential function, which means that it is nonlinear.
For finance - underneath everything else - we use a specific form of that function to calculate values and prices today, as well as how much cash will be created in the future. Because prices today and cash in the future are each core to what wealth is (in the minds of most people), I will refer to this as the Wealth Function, and it is shown below.
We have a rate of return, which is often (but not necessarily) an interest rate, and we have time, which is represented by "n". Change the input, which is rate of return, and for any given period of time, we have a straight-up mathematical relationship which determines our new output. This new output is our new cash in the future, or it can also used to determine the cash value of our investment today. Either way, the function output is our wealth.
As a matter of policy the Federal Reserve has been changing the input variable and moving it into ranges it has never been before. This means that the output variable of wealth creation is also necessarily moving into ranges that it has never been before, and this is happening in ways that relatively few individual investors are fully taking into account.
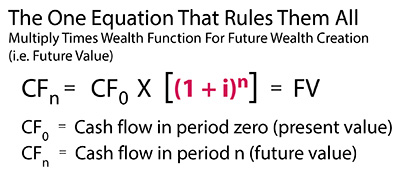
The Wealth Function output is critical to the foundational equation above, which is arguably the single most important equation in all of finance. We start with cash invested today, we multiply times the output of the Wealth Function, and we get cash in the future, which is also known as future value.
The Wealth Function governs the most historically reliable form of creating wealth over the long-term, which is the reinvestment of cash flows. Creating wealth through compound interest is the best-known use of this equation but it is also every bit as true for reinvested cash flows for stocks and real estate, albeit with a few more factors involved

The extraordinary impact of Federal Reserve interventions on wealth creation over time was the subject of the previous chapter, and the results can be seen above.
The red bars are the cumulative total of interest earnings and interest earnings on the reinvestment of earnings, at the historically normal rate of 7%, which was about the average yield on 10 year U.S. Treasury obligations between 1962 and 2007. Using the Wealth Function output of 7.61 (as covered in the previous chapter) a $100 investment would become $761 over 30 years, of which $661 is new wealth created.
Interest rates are currently far lower as a result of Federal Reserve policies. If we change the input in our Wealth Function from 7% down to 3%, to better reflect current conditions (in round terms), then our generation of future wealth falls from $661 down to $143, as shown by the much shorter purple bars. This $518 decrease is a 78% reduction in the creation of wealth.
If we do get another recession in the next one to two years, then as covered in previous chapters, we know what the Federal Reserve intends to do in response - and that is shown with the tiny slivers of the golden bars. Wealth creation would fall from $661 down to a mere $35, as the Fed slams interest rates back down to zero percent and aggressively resumes quantitative easing. As calculated using the Wealth Function output, there is a 95% reduction in wealth creation over time, as a direct result of the Fed's intentions to change the input variable through the use of extraordinary and heavy-handed interventions.
This was a very short recap of the previous chapter, the implications of that chapter impact the entire investment world with profound implications for financial planning, and that analysis is very much worth reading in its entirely if you have not yet done so (link here).
The Wealth Function & Higher Asset Prices
The implications of past and future cyclical Fed interventions seem quite dire when we use the Wealth Function to find the impact on future wealth creation from cash flows. So where exactly do the record asset prices and the creation of so many fortunes come in?
Our starting point is the algebraic equation above, which uses the Wealth Function to calculate the future creation of wealth, i.e. future value, and was the core of the previous chapter.
To find asset prices today, and to be able to calculate changes in asset prices - we don't even need an independent equation. Instead, all we have to do is start with the same future value equation, and just divide both sides of the equation by the same factor - the Wealth Function output - much as if we were a math student trying to solve a simple algebra problem.
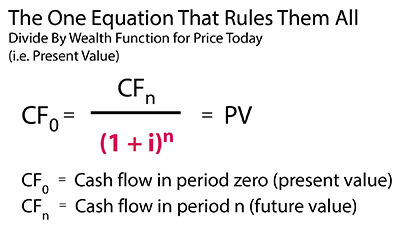
The result of dividing both sides by the Wealth Function output is the price today. This is the cash that someone would pay us for that asset - which is also known as present value.
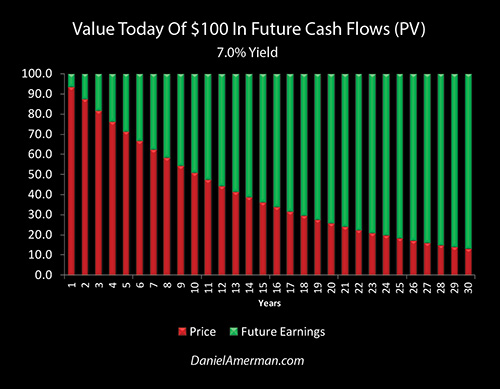
As shown above, if we look at a $100 cash flow 30 years out with a historically normal yield / input of 7%, and we divide it by our Wealth Function output ($100/[(1+.07)^30] = $100/7.61), then we get the red bar of how much someone would pay us today for that single cash flow, which is $13.14.
The green bar stacked on top of the red bar represents the share of the $100 that will be future income. At a 7% yield / input, $13.14 is a return of investment and $86.86 is the future income on that investment.
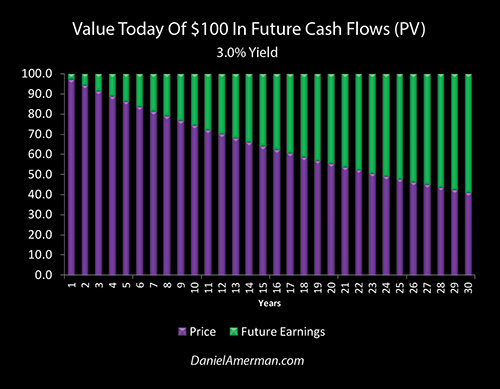
However, history doesn't apply anymore - the Fed is stuck in an interest-rate trap of its own making, and we need to look at the value of that cash flow today with a 3% return. Take the new input of 3%, enter it in our Wealth Function, the function spits out an output of 2.43, and when we divide the future $100 by that output, we find that the value today - what other people will pay us - is up to 41 dollars and 20 cents, as shown with the purple bar.
So, as a direct result of the Fed's extraordinary and heavy-handed interventions - which have fundamentally changed the value of the input variable - our cash value is equal to 314% of what it would be based upon long term averages. Change the input, divide future cash by the output, and our wealth today has increased by 214%.
That increase in value doesn't just apply to bonds. All else being equal, the valuation today of any expected stock or real estate cash flow thirty years out, to the extent that it is based upon the risk-free rate - is also then equal to 314% of what would be normal, if we are looking at long-term, inflation-adjusted average valuations.
Just to be clear - the intent of this analysis is to communicate critically important information about how the Federal Reserve's extraordinary interventions are mathematically creating amplified investment wealth cycles that operate on a basis that are quite different from what the nation has previously experienced. To illustrate this message clearly for a general audience - we are getting down to the bare bones and sticking to one cash flow, one yield component, and one time period.
Now in practice, not all cash flows are 30 years out, as is shown with the rightmost bar on the graphs. Instead price today will usually be based on the cumulative sum of many cash flows, with many values of "n". As can be seen with preceding 29 bars in the graphs, those nearer term cash flows - which are likely to form the majority of the value today - will not experience as dramatic of fluctuations in their output variables for a given change in the input variable, as what is seen with 30 year calculations.
When the Fed changes the Fed Funds rate, it effectively changes "i", which is the overnight risk-free rate. As discussed in the previous chapter, when we move out in time, we need to include a term premium (which is implicit in this analysis), and we also need to include market risk premiums that will vary with the asset class, such as corporate bonds, equities or real estate. These additive components change the output of the exponential Wealth Function in a nonlinear manner.
Those more technical qualifications are important - but they don't change the underlying message.
When the Fed sufficiently changes the input variable - as it has been doing - it can create stunning changes in the output variable. One of those changes is to support radically higher investment prices than could be supported at more historically normal levels for the input variable. And while this is easier to illustrate with bond prices - the maximum investment profits from understanding the Wealth Function are not to be found in bonds, but in stocks and real estate.
The Wealth Function & Stratospheric Asset Prices
Now, let's consider the possibility of another recession within the next couple of years. As previously explored, the Federal Reserve would be caught in a trap, lacking the traditional "ammunition" of large interest rate decreases to contain and exit recession. So, as covered in previous chapters, the Fed slashes interest rates straight back down to zero percent, and immediately creates trillions of new dollars to force medium and long term interest rates down as well, in an early intervention of unprecedented strength.
The desperate Fed actions force the input variable straight down to 1%. The Wealth Function output variable plunges down to 1.35.
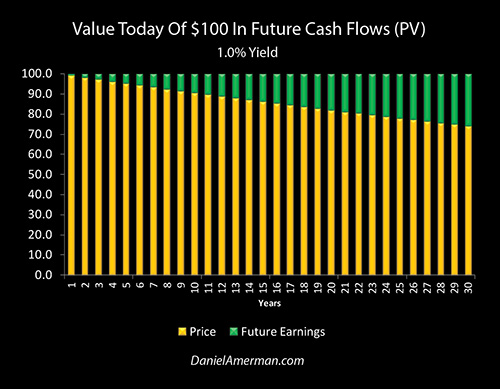
When we divide our future cash flows by the crippled output of the Wealth Function - we get the towering gold bars above, of the new asset values that could result from a new Fed cycle of the containment of crisis. The value of our $100 cash flow 30 years out rises to an astounding $74.19.
Change the input, calculate the output, apply it - and the result is an 80% increase in price for that cash flow, from the already quite elevated asset prices that exist today (which are the purple bars).
A direct result of a new round of recession and heavy-handed Federal Reserve interventions to contain the resulting economic devastation - could be asset prices equal to 565% of historic averages (comparing to the red bars, for the example 30 year cash flow shown).
Now, again, we are taking the simple approach, and the direct implications of this astonishing increase relative to long-term norms is most applicable to those bonds which lack a credit risk component.
When we look at stocks and real estate, then the economic changes, corporate earnings declines, and market psychology impacts of a new recession could lead to severe price losses for years to come - much as they did the last time the cycles changed, and perhaps worse than the last time.
However, if we assume that stability is ultimately regained, and the Fed once again finds itself unable to fully backtrack, and is stuck at much lower interest rates than today, with a much lower Wealth Function input - then, all else being equal, the extraordinary increase in asset price levels will apply to stocks and real estate as well, and the great majority of the cyclical profits would ultimately likely be gained in those categories as well (again).
With some investments, the eventual impact of the next cycle of crisis and the containment of crisis could be indeed be what can be described as stratospheric asset prices, when compared to historical averages.
One Function, Bipolar Results
For many people, this analysis of the Wealth Function and the impact of the Federal Reserve changing the input variable - might seem to be a bit on the bipolar side.
A potential 95 percent reduction in the most reliable form of wealth creation for a nation is so awful to contemplate, such an extreme example of pessimism and negative thinking, that is hard to believe it could even be remotely possible
On the other hand, having a trapped Fed and future rounds of recession actually act to create asset values that are as much as 5.7X higher than historic norms is such a wildly optimistic scenario that it would be difficult for many people accept - as much as they might like to.
However, this is not a clash of wild optimism versus extreme pessimism, but rather the results of applying a single and entirely self consistent mathematical function.
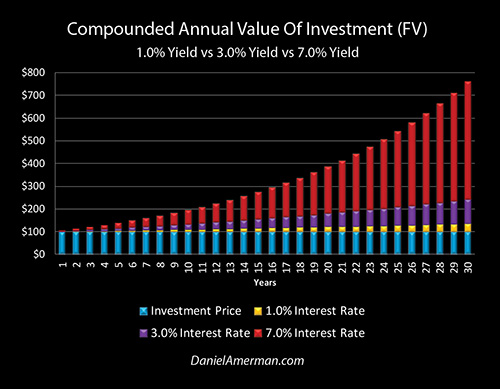
We start with historic yields as the input, and look at the creation of wealth over time in the top graph. For year 30, the function output is 7.61, we multiply times $100, we get a total of $761 in future cash, we subtract for the $100 initial investment (the bottom blue bars) and as we can see with the red bar stacked on top, the Wealth Function has created $661 in new wealth over time
We take the same input yield, the same equation, divide both sides by the same Wealth Function output of 7.61, and we get the red bars of the bottom graph. We can sell a future $100 cash flow for $13.14
One function, one input, one output, and one equation - just rearranged a bit. The historic norm is an explosion in wealth in the future, which necessarily means little wealth today.
We take the same function, adjust for extraordinary Federal Reserve interventions in moving the current input variable down to 3%, and use a single equation again. Our new Wealth Function output is 2.43, we multiply times $100, subtract the initial $100 investment, and the purple bars in the top graph show us that our new wealth creation over 30 years is now down to only $143.
Take the same equation, divide both sides by the same Wealth Function output of 2.43, we get the purple bars of the bottom graph, and we can see that a $100 cash flow in the future will sell for a price of $41.20.
The Fed put its massive thumb down on the scales, and we have lost 78% of our ability to create wealth in the future, even as the value of what we have today rises by 214% (if n = 30). Two halves of the same coin, two faces of the same function.
Assume that a cornered Fed comes into a future recession, lacking the traditional "ammunition", and between zero percent interest rate policies and new rounds of monetary creation - the input variable is forced down to 1% for cash flows 30 years out.
When we look at the top graph, our Wealth Function output is down to 1.35, and as shown by the tiny golden slivers, our new wealth creation is down to a mere $35 per $100 invested.
When we look at the bottom graph, and divide both sides of the one equation by the same Wealth Function output of 1.35, then we get the soaring golden towers, and an amazing value of $78.19 today for every $100 in cash flow that is expected to be received 30 years in the future.
If a desperate Fed goes into all-new territory to deal with the next cycle of crisis and the containment of crisis - and if they succeed (that's a big "if"), then the value of some of our investments could eventually equal 500% or more of long term averages, even on an inflation-adjusted basis. This occurs even while 95% of our ability to earn future wealth evaporates at the same time, and as the result of the Fed changing the same input of the same function.
Making Fortunes, Past & Future
If something like this happens, then the results will be very unfortunate for the sustained and reliable creation of wealth over time for all of us.
On, the other hand, if we stick to just looking at changes in prices - many fortunes could be made.
Indeed - many fortunes have already been made.
A little less than 20 years ago the Federal Reserve pushed the Wealth Function input variable to a 50 year low in order to contain the damage from the popping of the tech bubble and the associated recession. The Fed later pushed the input variable to an all time low with zero percent interest rates and the introduction of quantitative easing - in order to escape the Financial Crisis of 2008 and the associated Great Recession.
At a foundation level - these input changes created Wealth Function output changes that eventually supported - and do currently support - increased valuations of many trillions of dollars in multiple major markets including stocks, bonds, personal residences and investment real estate.
We currently have record or near record valuations for stocks and real estate relative to historic norms - and based upon the Wealth Function output, that is exactly what we should have. This has led to tens of millions of investors and homeowners feeling much better about their financial situations than they otherwise would - and this is likely to hold true when it comes to the current personal household net worths of most of the people reading this analysis.
Counterintuitive as it may sound, there is a very strong mathematical case that many millions of average Americans (possibly including you) are enjoying a total of many trillions of quite spendable additional dollars of household net worth, not in spite of the Financial Crisis of 2008 - but specifically because of the extraordinary and heavy-handed interventions the Federal Reserve made in the attempt to contain two previous cycles of crisis.
And counterintuitive as it may sound, if the business cycle has not been repealed and if the Fed takes even more extraordinary steps to contain the next crisis, then the eventual result could be stratospheric asset prices in multiple investment categories.
Trouble plus trouble has indeed already created the mathematical foundations for trillions of dollars in additional household net worth today.
And if another round of trouble is contained and is followed eventually by recovery and the stabilization of the input variable at a level that is still further into the unprecedented range - then the new output variable would lay the mathematical foundation that could support still more trillions of dollars in household net worth - and the corresponding investor profits (if the system can survive another round of that scenario).
And that could produce many more fortunes to come - particularly for those who can follow the math.
A Nonrandom, Nonlinear Investment Framework
We live inside a boom & bust cycle that has always been there - it is called the business cycle. Through U.S. history and around the world we have a very long history of economic expansions and recessions, as well as market booms and busts.
This cycle has changed in the United States over the last twenty or so years - as the result of a series of extraordinary and increasingly heavy-handed Federal Reserve interventions. We have had some extreme lows - such as the popping of the tech stock bubble, the popping of the real estate bubble, and the Great Recession.
We have also had some extraordinary highs - including very elevated valuations for stocks, bonds and real estate for the nation.
The highs and lows are not independent. Rather, as developed in the preceding chapters in this book, they are part of the same process of the cycles of crisis and the containment of crisis.
What was developed in this chapter is a principle that goes down to the bedrock fundamentals of financial mathematics, but yet, is not fully understood by many investors. That is how the use of increasingly low interest rates and other aggressive interventions by the Fed, as the cycles continue and potentially amplify, can set a mathematical foundation to support much higher asset prices in some major investment categories at some stages in the cycles.
These elevated asset prices can reach levels far above historic averages, and they do not need to be fleeting, but can persist for years at a time - as we have seen in recent years.
As the Federal Reserve makes extraordinary changes to the input variable of the Wealth Function - among other changes - it fundamentally distorts how investment markets work, and how risks and returns work as well. In some cases, what used to be highly reliable may now not work at all, while what now works the best - may be something quite different than the strategies of a time gone by (at least for now).
There are three particularly important types of practical investment implications for investors.
1) Many traditional sources of wealth creation are likely to be gone, or to face acute performance risks to an extent that did not exist in the past.
2) Across multiple investment categories - at some stages in the cycles - some of the highest investment prices that we have seen in our lifetimes may still be ahead of us, even in inflation-adjusted terms.
3) The framework for identifying the changed risks and returns in this new investment landscape is both nonrandom and nonlinear.
In traditional investment theory, markets are supposed to be a "random walk", so we might as well just passively index. What we have seen over the last near 20 years, however, is markets being dominated by the increasingly aggressive interventions of an outside player - the Federal Reserve - following its own agenda and its own policies. What the Fed is doing is far from random, and can be at least partially understood in advance.
The way these nonrandom changes are expressed is a nonlinear process. As explored herein, the Wealth Function is an exponential function. Generally speaking, when we make fundamental changes to the input variable of an exponential function, moving it to all new and radically different places - we don't just get subtle tweaks or minor changes to the output variable.
So when the output variable happens to govern some of the very foundations of the creation and redistribution of wealth - we don't get minor tweaks to traditional investment strategies.
Instead, we get an amplification of some risks, with a far greater potential for swift and severe losses. Crucially, if the cash flow reinvestment engine that is the source of stability for many buy-and-hold strategies is indeed deprived of fuel by changes in the input variable, then history may no longer be a reliable guide in terms of which traditional strategies will indeed be protected from major losses - even over the long term.
On the other hand, and on the flip side of the function, when we combine the potential enhanced volatility of the total cycles, with the foundational mathematical support for potentially far higher asset prices during some stages of the cycles - then we also get an amplification of some profit opportunities, with much greater gains in some asset categories in some stages, than should otherwise exist. The cumulative total is again likely to be many trillions of dollars in gains across multiple markets.
The graphic below is an organizational framework I created, to help explain how the changes in the cycles of crisis and the containment of crisis can change investment category results at various stages in those cycles.
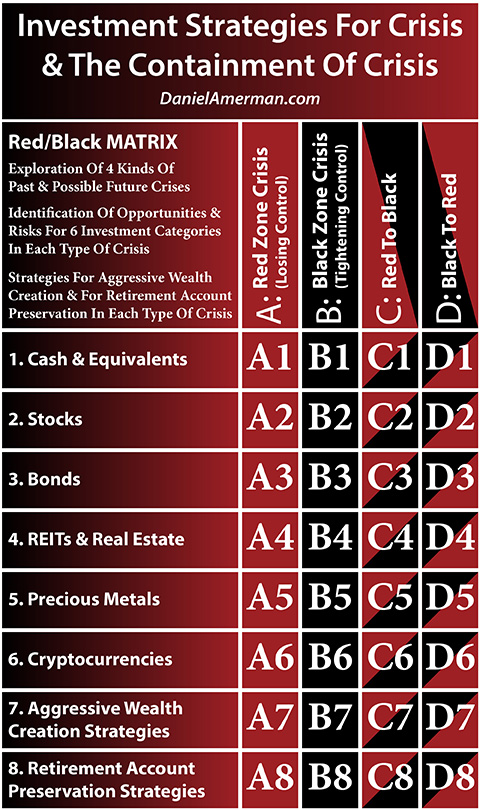
An explanatory analysis for the matrix is linked here.
The columns are cycles of crisis and the containment of crisis, and are our current amplified version of the business cycle. The economy travels from expansion to recession to expansion - and the markets strongly react at each stage as they always have. We have not just the fundamental economic changes and corporate profit changes, but the changes in investor and market psychology - and those remain quite important.
What is different about this time around is the strength and degree of Federal Reserve interventions. The Fed slammed interest rates to zero percent and introduced quantitative easing in the desperate attempt to exit the Great Recession the last time around - and those measures are still with us, potentially coming into the next round of recession. The Fed was never able to unwind the very low interest rates or balance sheet expansion, and that means that so long as the business cycle has not been repealed, the next time around could require the most extreme measures yet to contain the crisis and exit the recession.
Each of rows 1-6 consists of investment categories. These traditionally do change, and often sharply, with new stages in the business cycle.
However, a cornered Fed has been and is likely to continue to make extraordinary changes to the input of the Wealth Function, at various stages in the columns, with the progression of the cycles.
Each time it does so, the mathematical implications of the change in the input variable reach down via the output variable, and change prices and returns in each of the investment rows, in somewhat different ways, and with somewhat different timing. So in addition to the usual economic, corporate earnings and market psychology changes, we also now have nonrandom changes in the input variable, at different stages in the cycles, which trigger nonlinear changes in risks and returns, that differ in each investment category, and at each stage.
In other words - we have potentially staggering losses and extraordinary gains, that will move between the investment rows at various stages in the progression through the economic cycles, with different individual matrix cells (in each investment category) becoming either toxic or golden at different points.
The framework is an organizational aid, with lettered columns and numbered rows, to help to identify and analyze in a systematic fashion where and how the risks and opportunities shift between the individual matrix cells as the cycles progress and potentially continue to amplify (with each individual cell being identified with the unique combination of an economic cycle letter and an investment row number).
*******************************