

Chapter 21: How Virtuous Circles Can Multiply Wealth After Retirement
by Daniel R. Amerman, CFA
Sequence of returns risks are not always negative. Indeed, history shows quite clearly that for some fortunate retirees, the sequence of returns can create more wealth and financial security AFTER retirement - sometime years after they have retired - than everything they had built up with decades of savings before retirement.
It all depends on the timing of the secular cycle, and this is true for both gold and stocks.
Yes, if the retiree begins asset sales at the wrong time in the cycle, then sequence of returns risks can be one of the worst things that can happen to a retirement. As explored in Chapter 20 (link here), twenty years of planned retirement financial security can fall apart with two years of fast falling investment prices in a "vicious circle", leaving the retiree in an almost inescapable downwards spiral for what is left of their funded retirement.
However, if the cycle is entered at the right time, whether that be deliberately or by happenstance, then history shows that a "virtuous circle" can be created with either gold or stocks. In a virtuous circle wealth is created at a rate that is not only much faster than the rate of inflation, but it can also greatly exceed the ongoing withdrawals used to pay for standard of living in retirement.
As we will explore, one of the best parts of virtuous circles is that there can be more than one. The first virtuous circle can extend retirement savings long enough to catch a second virtuous circle, which can then fully fund retirement well past age 100.
Hit the cycle correctly - and a gold investor who retired at 65 with enough assets to last them to age 85, could find their retirement assets lasting until age 112, while pulling out six times more annual dollars at age 111 than they were at age 65.
If a stock investor hits their contracyclical cycle correctly, then instead of running out of assets by age 85, they could be pulling out three times as many annual dollars at age 104, while sitting on a portfolio that is five times larger than it was when they retired at 65.
Sound too good to be true? It's just what financial history shows us, if we know where to look. Gold and stocks are each potent inflation hedges, but neither are stable. Instead, each asset class experiences huge swings in inflation-adjusted values in long term - and opposing - cycles. The little understood intersection of these secular cycles for gold and stocks with sequence of returns risks can be so powerful that it creates a financial explosion. Sometimes this explosion can rapidly destroy financial security. Other times this explosion can create more wealth and financial security in a short period of time than the retiree would have thought possible at the time they retired.
This analysis is the 21st chapter in a free book. The earlier chapters are of essential importance for achieving full understanding, and an overview of some key chapters is linked here.
Reversing The Sequence Of Returns
We've previously seen the damage from what happens if someone retires into a major bear market or secular down cycle. Now, let's reverse the sequence of returns. Someone retires just as a major bull market or secular up cycle begins. Their assets are worth much more than they planned in their first ten years of retirement, so they are able to support their planned standard of living in full, while selling less of their assets each year than expected.
In this case, sequence of returns risks are not necessarily bad at all, instead they may just be the best thing that could happen to a new or recent retiree. Let's go back to 1969, and say that instead of a stock investor selling assets into secular down cycle, which created the stock vicious circle explored in Chapter 20, the new retiree was invested in the contracyclical asset of gold, so they were selling their assets into a secular up cycle.
This mutual timing of starting in 1969 for both stocks and gold while experiencing opposite results is no coincidence, but shows the extraordinary and life changing intersection between contracyclical assets and sequence of returns risks.
Using the same assumptions as in Chapter 20, the investor starts with $1 million, and sells enough assets in each year to finance a $50,000 a year inflation-adjusted standard of living (above what Social Security by itself would deliver). Because gold is in the early stages of a secular bull, the investor would have a little more than what they started with by the end of 1972, with an inflation-adjusted $1,045,478 portfolio value, even after taking into account two years of $50,000 annual drawdowns.
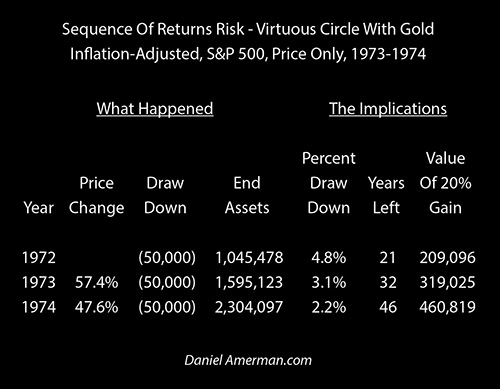
In 1973, inflation was shooting upwards, and gold was shooting up far faster (for the reasons explored in Chapter 16), climbing by an inflation-adjusted 57.4%, which was a $599,645 gain. From that, $50,000 had to be taken out, but the profits were so huge, that the portfolio still climbed to a value of $1,595,123. This is critical for understanding why sequence of returns risks can produce results that are so dramatic they may seem non-intuitive. In a secular up cycle the base can be growing quickly, even after the asset sales that are used to pay for standard of living.
Let's review what happened with our historical example of creating a virtuous circle in 1973-1974 through the lenses of the three sequence of returns risks developed in Chapter 20.
Sequence Of Returns Risk #1: Permanent Gains (Losses)
There was a sale of $50,000 of gold out of the portfolio of $1,645,123, leaving the $1,595,123 shown as "End Assets". These sales occurred at a price that was 57% higher than the year before - and those gains were permanent once the sale occurred, there was no unwinding them if prices later fell. This also meant that only 3% of the portfolio had to be sold, leaving that much more of the portfolio still there and able to fully participate in the secular up cycle.
Those gains are real, they are permanent, and they are important. However, rather than comprising most of "sequence of returns risk" as described by some sources (and reviewed in the previous chapter), those permanent gains were actually the least important aspect of what was happening. An extra 57% in price on 3% of the assets is only worth 1.7% of the portfolio. Nice, good, but not overwhelming.
Sequence Of Returns Risk #2: Falling (Accelerated) Portfolio Drawdowns
A portfolio drawdown of $50,000 on the $1,045,478 ending portfolio of 1972 would be 4.8%. If we divide $1,045,479 by $50,000 (or 1 by .048), then we find that the portfolio should be able to support another 21 years of inflation-adjusted drawdowns of $50,000 each, all else being equal.
Because of the gains in 1973, the ending assets in the portfolio rose to $1,595,123, on an inflation-adjusted basis. This large increase in the base, meant that our constant $50,000 drawdowns are now equal to only 3.1%. In terms of financial mathematics, this change in percentage drawdowns is the life changing heart of sequence of returns risks, and the virtuous circles as well as the vicious circles.
Dividing the $1,595,123 in ending assets by the $50,000 drawdowns, the portfolio will now support another 32 years of retirement spending, all else being equal. The year before, 21 years would have been supported, so 20 years should have been left. This means an increase of 12 years in additional funded and fully inflation-protected retirement - from a single year of gold price gains in a time of recessions, global turmoil, falling stock and bond markets, and fast rising inflation.
Sequence Of Returns Risk #3: Expanding (Shrinking) Gains From Rebounding Prices
The critical impact of the third sequence of returns risks can be seen when we look at the third column of impacts, "Value Of A 20% Gain". With the $1,045,478 portfolio at the end of 1972, a 20% gain in the following year would have produced a $209,096 gain -which would have covered another four years of retirement standard of living.
When gold jumped 57%, the much larger base that was created AND the smaller percentage drawdown of that base combined to leave an ending base of $1,595,123. This meant that the "Value Of A 20% Gain" in the next year would be worth $319,025, which would cover an additional six years of inflation-adjusted retirement standard of living expenses.
The higher the base grows as the result of previous years gains, the less that will be lost (in percentage terms) to asset sales in each year. That then leaves that much more base to gain from the increase in asset prices, which also increases the size of the base. This double combination of bigger bases building on bigger bases to produce ever larger gains for a given percentage increase in asset prices, even while the necessary percentage depletion of the portfolio to support standard of living in retirement falls, is a virtuous circle, and is the natural result of a retiree (or near retiree) selling assets into a secular up cycle.
This virtuous circle continued into 1974 - another year of economic, market and monetary pain for the nation - with gold jumping up again, and climbing by an inflation-adjusted 47.6%.
Sequence Of Returns Risk #1: Permanent Gains (Losses)
Just looking at 1973 -1974, the sequential combination of 57.4% and 47.6% annual gains was enough to produce a 132% increase in the price of gold even after discounting for inflation. For every ounce of gold sold in 1974, this gain was locked in with the asset sale, and would not be erased by any future decreases in price.
However, as pleasantly profitable as it was, it only applied to the small percentage of the overall gold portfolio that was sold in 1974, and was not therefore itself the source of life changing results for financial security or years of funded retirement.
Sequence Of Returns Risk #2: Falling (Accelerated) Portfolio Drawdowns
What started the year as a $1,595,123 portfolio, ended the year as a $2,304,097 inflation-adjusted portfolio, even after taking out $50,000 to fully support retirement standard of living in a year of fast rising prices that was creating financial pain for those retirees who were not so protected.
The following year of annual drawdowns would be equal to only 2.2% of the new market value of the portfolio. A 2.2% annual drawdown means that a portfolio will fully fund another 46 years of retirement, all else being equal.
Two consecutive years of a virtuous circle were enough to take a portfolio that had been expected to last another 21 years, and to boost it to lasting 33 years in the first year of the circle, and then to a total of 46 years in the second year of the circle. Given that two years of fully funded retirement occurred while this was happening, this was actually an extension from 21 years to 48 years, or 27 years.
Think about someone who started investing at 30, who steadily invested for 35 years in a disciplined manner and who built the assets for an expected 20 year retirement starting at age 65. Then in the 4th and 5th years after they retired, while enjoying a good lifestyle and putting no new money in, with no active trading or even following the markets - their years of funded retirement abruptly expanded by 27 years. Over the course of two years of not working but drawing money out - in the midst of severe financial stresses that were consuming the stock and bond markets - more new financial security was created for them than what 35 years of savings did while working.
Such is the power of sequence of returns risks creating a virtuous circle for a contracyclical asset - and in this case, years after retirement with a passive investment strategy (no active trading).
As long time readers know, for over ten years now the original solutions-oriented research that I've been doing has led to me repeatedly making two quite uncommon statements: 1) gold is not a stable store of value, but something better; and 2) gold's primary value is not as an inflation hedge, but something better.
What we just reviewed is one aspect of what gold does do best, which is functioning as a non-financial contracyclical asset in secular cycles, with that power being magnified when it intersects with sequence of returns risks, close to or after retirement.
Sequence Of Returns Risk #3: Expanding (Shrinking) Gains From Rebounding Prices
If we look at the "Value Of A 20% Gain", at the end of 1972 (using annual average inflation-adjusted prices), a 20% gain would have produced another $209,096 dollars, which would have funded about four additional years of retirement.
Because the gain in 1973 was larger than that in practice, the "Value Of A 20% Gain" by the end of that year had risen to $319,025, which would have funded about an additional six years in retirement. Because the base had risen by so much, each percentage point in annual gains in another year of secular up cycle were worth that much more.
From that much larger base, there was another year of gains that were well in excess of 20%. Taking those gains, and applying them to the larger base, the "Value Of A 20% Gain" rose to $460,819. This means that a future 20% gain on the even larger base is enough to fully fund yet another 9 years of retirement.
All three factors work together to create the virtuous circle. Each year of fully funded retirement where assets sell at above average prices is permanent.
As covered in Chapter 20, it is the rising percentage of assets needing to be sold each year when asset prices are falling fast in the early years that creates the vicious circle and a near impossible to escape dilemma. However, when selling assets into rising prices, the fast falling asset sales as a percentage of the portfolio can create additional financial security and potentially many years of fully funded retirement with what can be almost startling speed. And each time the drawdown percentage falls, the stage is set for an even more dramatic increase in years of retirement funded, with the next gain as part of the secular up cycle.
The sequence of positive returns on an building base that is mostly insulated from the drawdowns due to the decreasing percentages, then builds a base that is that much higher, multiplying together the gains from each up year in the secular cycle.
The particular sequence in which returns occur after retirement matters, and history shows us that it matters greatly. A major early Down-Down sets off a vicious circle that a subsequent Up-Up can't overcome. An major early Up-Up, sets off a virtuous circle that can easily handle a later Down-Down.
The Next 42 Years Of Retirement
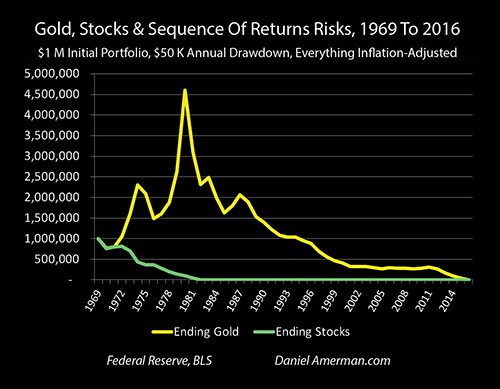
Gold would then go through a downdraft, before a second and much larger leg up. Even after taking out six more $50,000 annual drawdowns, the portfolio would have still been up to an inflation-adjusted $4,601,628 in 1980, the eleventh year of retirement. That number is based on the conservatism of using inflation-adjusted values, if we don't adjust for inflation, the value of portfolio in simple dollars would have been $10.3 million.
If we look at it in percentage terms, at the peak which was 11 years into it, a $50,000 annual drawdown is equal to 1.1% of the $4.6 million inflation-adjusted portfolio. This means that if the inflation-adjusted value could have been frozen at the $4.6 million, it would have covered another 91 years of retirement, which on top of the 11 years of retirement that had already occurred, would have funded a total of 102 years of retirement instead of the planned 20 years.
However, what happened instead is that gold hit a secular down cycle after 1980, and lost 79% of its value over the next 20 years. This is the same market (as was developed in the previous chapter) that would wipe out in ten years a gold investor who entered the sequence at that point with $1 million, and took out $50,000 a year.
As can be seen in the graph repeated above - the value of the portfolio did plunge. The percentage decline in gold each year was of course identical to the investor who lost it all - but having entered the sequence of returns with asset sales earlier, meant not just more savings coming in, but that the percentage drawdowns were much smaller at that point.
Drawing down 1.1% annually instead of 5% initially greatly reduced the damage from the secular down cycle. The investor who entered the sequence with a secular bull, would have still had an inflation adjusted $1.4 million outstanding in 1990, the same year that an investor entering the sequence in with the start of the secular bear would have been down to zero dollars. Crucially, this meant that the annual percentage drawdown in 1990 was only 3.4%, still well below the starting 5% in 1969, which gave the portfolio the staying power to withstand the second ten years of secular down cycle as well.
Another way of looking at this is that if an investor retires into a secular up cycle, then the operation of the "virtuous cycle" of an increasing base and decreasing percentage drawdowns over the course of a number years builds up a very large safety margin. That safety margin can absorb potentially many years of price losses, before the percentage drawdowns become large enough that they are caught in the mathematics of a "vicious circle" end game of fast shrinking base and soaring drawdown percentages that is almost impossible to escape.
This could be called the reverse of common sense. With identical inflation-adjusted savings and standards of living in retirement at age 65, one would expect that a newly retired 65 year old fresh from working would have far more capacity to withstand down markets than a 76 year old who hadn't worked in 11 years, and had already drawn down their savings to pay for standard of living in each of those years. However - common sense doesn't necessarily apply when it comes to the actual history of stocks, gold and sequence of returns risks. If the older retiree had been so fortunate as to retire into a virtuous circle early in their retirement, then they could have built up a degree of financial security - after retirement - that the younger retiree could only envy.
The fortunate older investor would finally reach the 5% barrier in 1995 at age 91 (five years after the unlucky younger retiree went broke in 1990 at age 75), drawing down an inflation-adjusted $50,000 from a portfolio worth an ending inflation-adjusted $957,231. Again, using inflation-adjusted numbers is very conservative - and delivers a result which is highly desirable for investors over the long term, a standard of living that fully keeps up with inflation.
If we don't adjust for inflation, then in simple or nominal dollar terms the investor would have had $3,976,385 at the end of 1995. Their annual drawdowns in simple dollar terms would have passed $100,000 a year by 1980, $150,000 a year by 1987, and in 1995 they would have been pulling out $207,702 per year in retirement - which would have same purchasing power as $50,000 in 1969.
By 2001 and age 97, the investor would have made it to the next big step in the sequence of returns, the start of the next long term up cycle in gold - but the ending inflation-adjusted value of the portfolio would have been down to only $327,746, with an annual drawdown in that year equal to 13.2%. The following years of secular up cycle and soaring gold prices were not enough to overcome the sheer size of that annual cash flow drain, but they were enough to really stretch out how much longer the portfolio lasted.
Finally, in 2016 the gold would have run out. For someone who had retired at 65 in 1969, they would be 47 years into their retirement. And in their 46th year of retirement, at age 111, they would have still been able to take out $327,585, which would have the same purchasing power as $50,000 in 1969, meaning they would have fully maintained their standard of living for all 46 years, even as 85% of the value of the dollar was destroyed.
Comparing Gold Sequence Of Returns Risks
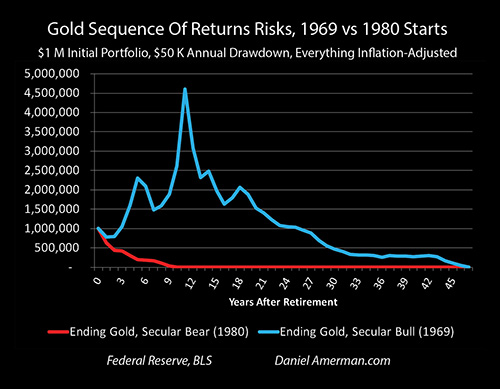
The graph above is not stocks versus gold, but gold versus gold. There is the identical starting position, which is a $1 million portfolio, and the identical drawdowns of an inflation-adjusted $50,000 a year. The asset is identical, and the long term history of the performance of the asset is identical.
One investor is broke by age 75. The other investor is still able to pull $327,585 out of their portfolio at age 111, in order to support their standard of living in retirement, as they did every year before that (adjusted for inflation).
The only difference is sequence of returns risks.
What year someone was born and what year they retired and began the sale of their assets could be called happenstance. But yet, the particulars of that random year that asset sales began, and where it happened to fall in the sequence of returns at various stages in the secular cycles, would have in fact been the dominant determinant of their standard of living in retirement, and not the amount they had saved or the asset in which they were invested.
Stocks, Sequence Of Returns Risks & A Virtuous Circle
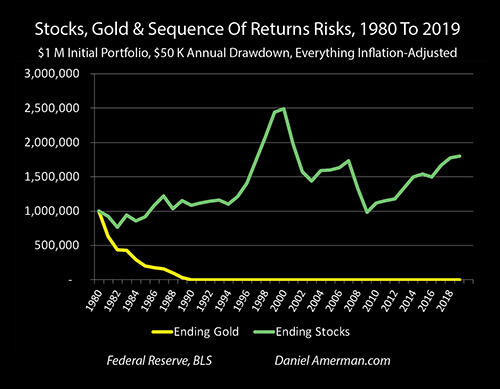
When we look at stocks in a secular up cycle, there is also a night and day difference in actual financial results in retirement, that is triggered by the point in the cycles the sequence of returns risk is initiated by the first asset sales. For the illustration below, we will look at an investor who is 100% invested in the S&P 500, who retires at the end of 1980 with $1 million, and who draws down $50,000 per year, inflation-adjusted, in each of the following years.
The starting year here is 1980, which is the same year that created the vicious circle for gold in Chapter 20. This mutual timing of starting in 1980 for both stocks and gold while experiencing opposite results is no coincidence, but shows the extraordinary and life changing intersection between contracyclical assets and sequence of returns risks.
There was a much slower climb in portfolio values in the early years, and the increase in asset prices was partially enough to offset the ongoing drawdowns.

So by 1985 - after 5 years of retirement - the investor would have an inflation-adjusted $913,921 in their portfolio, and their annual drawdown as a percent of the portfolio would be 5.5%. In other words, they were still early in the downward spiral, and five years into their retirement they were still far enough away from the cruel mathematics of large percentage annual drawdowns creating the vicious circle - that they could escape, if the markets cooperated.
Stocks were in a secular up cycle, and the markets did cooperate, rising by 24.1% in 1986, and by 17.2% in 1987. Attractive permanent gains were locked in place by asset sales as part of the 1st sequence of returns risk. But, while nice, they were again not a dominant or life changing factor, those changes were delivered by the 2nd and 3rd sequence of returns risks.
The fast rising asset prices decreased the percentage drawdowns from 5.5% at the end of 1985, to 4.6% over 1986, and 4.1% in 1987. This virtuous circle then took the years of funding remaining from 18 years, to 22 years to 24 years.
These gains are not nearly as strong as the 21 years to the 32 years to 46 years that we saw with the stronger gold virtuous circle. But, that is the point - a virtuous circle does not need to be that strong to have life changing implications for a retiree.
What happened over the two years of this milder virtuous circle with stocks is that time was put back on the clock. Two years of retirement standard of living were fully funded, and the time remaining at the end of the second year was six years longer than when it started. The fortunate retiree was given the gift of time, and eight years of full retirement funding were added at ages 71 and 72, long after they had stopped working.
The third sequence of returns risk also delivered strongly positive results as part of the virtuous circle. As the size of the base ratcheted upwards - aided by the decreasing percentage drawdowns - the value of a 20% gain went from $182,784 to $216,878, and then up to $244,182 by the end of the second year. The growing base raised the value of any given percentage gain, and in this case, the extension of retirement that would be created by a 20% gain went from 3.5 years, to 4 years, to almost 5 years.
While not the most dramatic feature on the graph repeated above, the virtuous circle of 1986-1987 was nonetheless vital, because in an environment of slower price increases over the next eight years of the long term up cycle, the combination of lower percentage asset drawdowns and a bigger base to multiply gains upon, was just enough to keep the inflation-adjusted base more or less level. This meant that the retiree still had a substantial enough portfolio of assets remaining - 15 years after retirement - to fully participate in a second and larger virtuous circle.
That's the best thing about virtuous circles. If enough years can be put back on the clock early to keep outside of the asset drawdown downward spiral - then the fortunate investor can still be there with sufficient assets to catch and take advantage of a second virtuous circle, later in retirement. For long-lived retirees - which is where the financial need is the greatest - this can then open up the possibility of catching a third virtuous circle, much later in retirement.
The Second Virtuous Circle & The Beauty Of Asset Bubbles
Now, if stocks had remained even in inflation-adjusted terms, with prices rising in exact synch with the rate of inflation, the 15 annual $50,000 drawdowns, would have left the investor with only $250,000 remaining at the end of 1995. Instead the investor would have had $1,212,588.
The combination of sequence of returns risk and the positioning in the secular cycle meant that the investor had almost five times the assets they otherwise would have after 15 years of retirement, and their annual drawdowns were only about one fifth of what they otherwise would have been as a percentage of the portfolio. That is a remarkably good outcome, and is by itself a strong illustration of the importance of sequence of returns risks, particularly when compared to an unlucky stock investor who began asset sales at the beginning of a secular down cycle, and was broke in 13 years, as previously developed.
Then things would rapidly get much better from there, because an asset bubble would inflate, that of the tech stock bubble of the late 1990s.
Now, asset bubbles are usually considered a bad thing for investors, and they usually are, particularly since so many investors are drawn in at the latter stages, they buy in or begin day trading near the peak and are then devastated by the crash.
However when we look at the sequence of returns risks for a retiree who is selling assets to pay for standard of living in retirement, then you should be so lucky as to have a really big asset bubble inflate after you retire, because the mathematics for the virtuous circle that is created are pretty sweet. This is contingent upon the following conditions being met: A) the retiree is fully invested in the asset before the bubble ever starts to inflate; B) the retiree does not put any new money into the market as the bubble inflates; and C) the drawdowns are constant (either nominal or inflation-adjusted), and do not increase with the inflation of the bubble.
In inflation-adjusted terms, the S&P 500 increased by 20.3%, 27.1%, 22.4%, 19.7% and 4.9% in the years 1996-2000. All three sequence of return risks created three strongly positive results for retiree investors.
1) Each sale at temporarily inflated prices is permanent at the time it occurs, and it is not unwound by later decreases in prices. So the retiree selling each year gets ever more of a bargain, it's permanent, the year of retirement has been lived and paid for in full, that is permanent as well, and neither is unwound in the later crash.
This is, incidentally, an important difference between saving into an inflating asset bubble, and selling into an inflating asset bubble. A saver building a portfolio is buying fewer and fewer assets, at higher and higher prices, all of which are subject to major price risks when the bubble later collapses. A retiree drawing down a portfolio is selling fewer and fewer assets at higher and higher prices, with each gain locked in permanently as the asset is sold and the money spent. To some extent asset bubbles can be characterized as an intergenerational wealth transfer from younger savers to older retirees (which may have very important implications for the 2020s as well).
2) In 1995, the annual percentage drawdown for the portfolio was 4.1%, meaning that the expected years of retirement funded was another 24 years. By 2000, the annual percentage drawdowns to support an inflation-adjusted $50,000 standard of living (over Social Security) would be down to just 2%, and the implicit years of retirement funded was 50 years. Remaining retirement funding increasing from 24 years to 50 years even while five years of retirement is lived, is an increase of 31 years.
Now, one could say that having 50 years of remaining retirement funded was an illusion based upon an asset bubble, that would vanish with the popping of the bubble, and there is certainly truth from that perspective. However, there was still a tremendous amount of value created for the retiree investor, nonetheless. Starting from heights of a 2% annual percentage drawdown there is an enormous amount of room to fall before entering the danger zone of increased asset sales percentages creating a downward spiral. This created a great deal of resiliency and protection from secular down cycles - which would indeed start the very next year, with the popping of the asset bubble.
3) Because the increase in asset values exceeds the annual drawdowns, there is a rapid increase in the base, which means that still more dollars are there to participate in the rally each year (this is the exact reverse of a secular down cycle). So, the 20.3% gain in 1996 would have increased the portfolio by $246,654, while the smaller 19.7% gain in 1999 would have increased the portfolio by $409,228, because the base was so much larger by that point.
When we combine the rapid increase in the base, the decrease in the percentage drawdowns, and the ability to sell fewer shares at higher prices, then the retiree would have had an inflation-adjusted portfolio of $2,491,622 at the end of 2000 (annual average prices). When we don't discount for inflation, the portfolio would have been up to $5.2 million (before dividends!).
That is 20 years after retirement, and if there were no secular cycles or sequence of returns risks, the investor would have done their 20th $50,000 drawdown, and would be broke at that point. However, because of sequence of returns risks in an up cycle, that were reinforced by an asset bubble, they would have had almost 2.5 times what they started with at retirement, even after discounting for inflation and the 20 years of standard of living that had been paid for.
The Fall & The Third Virtuous Circle
As can be seen in the graph repeated above, the secular down cycle that followed would hit the investor very hard, with particularly large blows in 2001-2003 and 2007-2009. The sequence of returns risks would have been devastating for a younger retiree, someone who retired and began asset sales in 2000, or 2001, in particular.
However, because of the previous 20 year secular up cycle, the older investor would have entered the secular down cycle in a much stronger position at age 85, than a new retiree at age 65. The much larger portfolio, and the forgiving 2% starting drawdown would have been an enormous help. By the end of 2009, the inflation-adjusted $2.5 million portfolio would have fallen to $984,358 as a result of nine years of drawing down into falling prices. This was way down - but it was still well above the range where the retiree would have been vulnerable to the vicious circle end game.
And then the cycles turned, and an up cycle began. In 2010, at age 95, the third virtuous circle began, there were still enough assets to fully participate, the base started growing again, and percentage drawdowns compared to the portfolio size would have started falling again.
The rebound would continue through 2019 (average annual prices), and 39 years into retirement, the retiree would be back up to an inflation-adjusted $1,797,861 portfolio, even after having drawn down a $50,000 inflation-adjusted standard of living for 39 straight years.
If we assume they retired at 65, and we don't adjust for inflation, then at age 104, they would still have a $5.6 million portfolio, and they would have just taken out $155,000 in the previous year to support their standard of living.
Comparing Stock Sequence Of Returns Risks
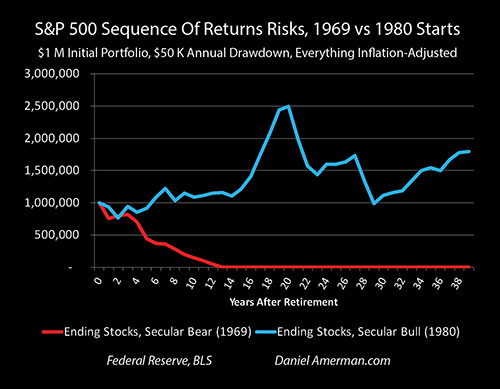
The graph above is not stocks versus gold, but stocks versus stocks. There is the identical starting position, which is a $1 million portfolio, and the identical drawdowns of an inflation-adjusted $50,000 a year. The asset is identical, and the long term history of the performance of the asset is identical.
One investor is broke by age 78. The other investor still has $5.6 million at age 104, and is still able to pull $155,000 out of their portfolio in that year in order to support their standard of living in retirement, as they did every year before that (adjusted for inflation).
Whether a virtuous circle for a long time stocks investor who truly believed in stocks would be available or not when they happened to reach retirement age? Call it random.
When we look at gold only, a 65 year old who retired in 1969 would have benefited from a virtuous circle, and they would have had a fully funded retirement through age 111, still drawing out over $300,000 a year through the end to support their standard of living in retirement.
Conversely, a 65 year old who retired in 1980 would have been devastated by a vicious circle, and would have been broke by age 75.
Whether a virtuous circle for a long time gold investor who truly believed in gold would be available or not when they happened to reach retirement age? Call it random.
Now, let's look at investment choices in terms of years and contracyclical assets, instead of asset preferences.
In 1969, stocks faced a vicious circle, and a rapid destruction of inflation-adjusted wealth. Because of its contracyclical nature, gold offered a virtuous circle of long term wealth creation in that same year.
In 1980, gold faced a vicious circle, and a rapid destruction of inflation-adjusted wealth. Because of their contracyclical nature, stocks offered a virtuous circle of long term wealth creation in that same year.
If we expand our horizons from one asset to two, and those two assets are genuinely contracyclical over long term cycles, then it is no longer random. There is always one virtuous circle available for the investor (as well as one vicious circle).
Now, the results are not necessarily as dramatic as what was historically explored herein. When an investor starts asset sales in the middle of cycle, then the effects of the sequence of returns risks are not as great - but the same principles still apply. The asset in the down cycle is moving towards a vicious circle (on average), and the asset in the up cycle is moving towards a virtuous circle.
Inflation Hedges & The Sequence Of Returns Risk Wild Card
What gold and common stocks have in common is that they are each potent inflation hedges over the long term.
With the national debt of the United States (and other nations) exploding upwards, even as monetary creation is effectively the only source for preventing financial crisis - there are some very, very good reasons to be concerned about rising rates of inflation.
However, what neither gold nor stocks offer is stability in inflation-adjusted purchasing power. Instead, each has a long history of being quite unstable, when we look not just at dollars but at what dollars will buy for us.
This creates the issue that if we invest in either gold or stocks in the attempt to beat inflation - but we happen to catch the cycles at the wrong time, then the value of our savings could be destroyed anyway, in a vicious circle created by sequences of returns risks.
On the other hand, there is always also the chance of a virtuous circle - and an extraordinary increase in financial security, perhaps even years after retirement has begun.
For someone seeking protection from inflation - history shows that there is a significant chance that sequence of returns risks can bring in a wild card that can dominate actual financial security in retirement, and that would likely catch many people completely by surprise. It is my hope, that after these last three chapters in particular, that the reader is now well aware of both the strong downside - and strong upside - risks that are created by the intersection of sequence of returns risks and the secular cycles.
Another way of looking at this is that because of the contracyclical nature of the secular cycles for gold and stocks - there is always a vicious circle in one asset, given enough time. There is also always a virtuous circle - in the other asset. By combining gold and stocks together over the long term, then inflation can be protected against, the downside sequence of returns risks controlled, and at least some access to the abundant upside potential can be maintained as well.
Learn more about the free book.
********************************************
Watch The 2020s Edition Online
Learn more about the contracyclical strategies for gold and stocks, brochure link here.