Chapter Twelve: The Wealth Function, Fed Cycles & Permanent Losses
By Daniel R. Amerman, CFA
TweetIn the previous analysis we explored the relationship between a new generation of heavy-handed Federal Reserve interventions - and the highest asset prices in history.
There is a problem, however, with asset prices that are based on extraordinary interventions - and that is what happens to the asset prices if the interventions cease.
As explored herein, the simple stress test of assuming a return to the normal investment valuations of most our lifetimes could inflict investment losses that are not only crippling - but are effectively "permanent" as well. There would be no reason to expect a cyclical recovery of those losses, even when the economy itself fully recovered.
The amplified investment cycles created by unprecedented Federal Reserve interventions can generate both amplified profits - and amplified losses. In this analysis we explore the long-lasting financial consequences of a potential "reversion to the mean", i.e. a return to the decades long averages for how stocks, bonds and real estate are valued.
This analysis is the twelfth chapter in a free book, an overview of the rest of the book is linked here.
The Highest Asset Prices in History
As developed in the previous analysis (link here), the Federal Reserve contained the damage from the Financial Crisis of 2008 and the Great Recession by taking radical steps. These included forcing short term interest rates down to zero percent for seven years, as well as creating trillions of dollars out of the nothingness via quantitative easing, and using that money to force down medium and long term interest rates.
These steps crippled the historical ability of many investors to create wealth via the magic of compound interest, as well as the ability of many retirees to support their standard of living in retirement from interest payments.
At the same time - as explored in detail in the previous analysis, the Fed changed investment valuations at the bedrock level of financial mathematics.
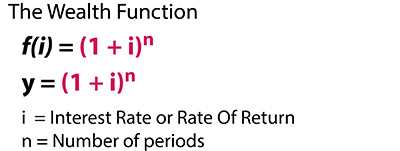
The Fed changed the input variable for the Wealth Function - the risk free interest rate (plus some term premium) and while rates have somewhat recovered, they still remain far below historic averages.
As previously developed, the combination of very low interest rates and quantitative easing set the mathematical foundation for much higher investment prices than normal historical averages. Indeed, we currently have record or near record asset prices (inflation-adjusted & relative to cash flows) for stocks, bonds and real estate when compared to long term historic norms.
We also have a wounded Fed, caught in an interest rate trap of its own making, unable to return interest rates to normal levels or to unwind its balance sheet and its prior creation of trillions of dollars out of the nothingness - out of a fear of triggering a recession and market crashes.
What we have been exploring through the use of the Wealth Function is that those are not two separate issues - but two halves of the same coin.
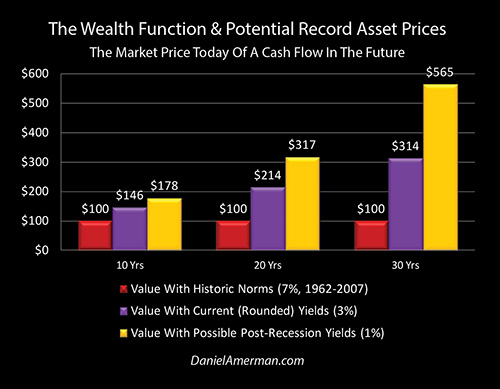
Comparing the heights of the red and purple bars, it is the Fed’s extraordinary and heavy-handed interventions that have created the foundation for the move from the red bars to the purple bars across multiple asset categories, including stocks, bonds and real estate.
Whatever the investment category source, our values today, the wealth we have, are up 46% for cash flows ten years out, are up 114% for cash flows twenty years out, and are up 214% for cash flows thirty years out - all else being equal, and at the foundation level of financial mathematics.
Again this is a very brief summary of the previous analyses (link here),but the bottom line is that the Federal Reserve is still stuck in a cycle of the containment of crisis, unable to return to normal interest rates or a normal balance sheet without triggering another round of crisis.
And the result is not wounded markets, but to necessarily set the mathematical foundation for the highest asset prices for stocks, bonds and real estate in history. The households of America currently have many trillions of dollars in additional net worth because of this - likely including you - and this applies to both the value of their homes and the value of their investment portfolios.
The Cost Of A Return To Normality
However, there is an issue - these extraordinary valuations are directly and necessarily based on the extraordinary interventions by the Federal Reserve.
So, if the extraordinary were to end, normality were to return, and we were to simply experience normal conditions again, as we have for most of our lifetimes - then there would be a change in the mathematical foundation that would radically change the values of our stock investments, bond investments, real estate investments, and the values of our homes. The Wealth Function would move the other direction, we would go from 3% to 7% - and a “miracle” of sorts would return.
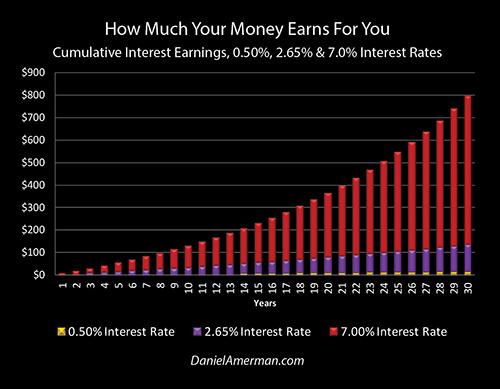
We would go from the purple bars to the red bars. Average savers, simply by the act of savings would once again be able to exponentially compound wealth again. A saver with $100 could once again create $661 in future wealth ((1+.07)^30 = 7.61, $100 * 7.61 = $761), instead of $143, ((1+.03) ^ 30 = 2.43; $100 * 2.43 = $243). This would be a stunning increase of 362% relative to where we are today.
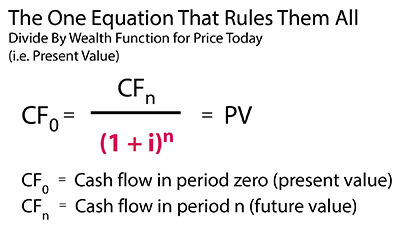
But at the very same time, when we look at what the current values of our investments would be - we would have to divide future cash flows by a much larger Wealth Function output to determine those values.
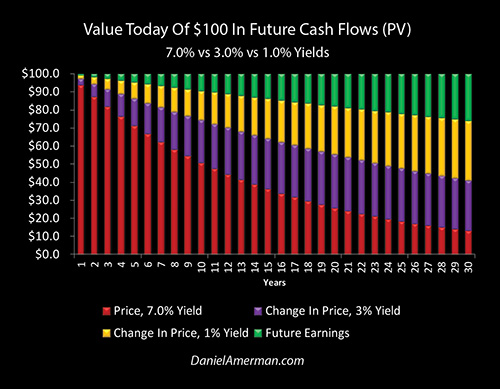
Going 30 years out, we now divide by 7.61 instead of by 2.43 - and what was worth $41.20 ($100 / 2.43 + $41.20) is now worth a mere (historically average) $13.10 ($100 / 7.61 = $13.10).
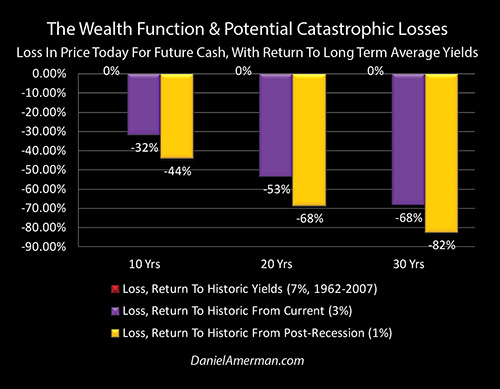
As shown above, at the bedrock foundation level for the mathematics of investment valuation, we would necessarily lose (all else being equal) a full 68% of the value of all cash flows that are 30 years out. The closer the cash flow to today, the less we would lose, but as shown above, we would still lose 53% of the value today of our cash flows 20 years in the future, and 32% of the value today of our cash flows 10 years in the future.
The specifics would vary, and a great deal would depend on both the timing of the cash flows associated with the specific asset, and the specific timing in the business cycle, as well as the cycles of crisis and the containment of crisis.
That said - the necessary flip side of unprecedented asset prices that exist as the result of extraordinary interventions, is that if those interventions cease, and we return to normality - there are likely to be unprecedented and even crippling asset losses. This would apply to stocks, to bonds, to real estate investments and to personal residences (at least on an inflation-adjusted basis).
We do indeed currently live inside a boom and bust cycle that has been greatly amplified when it comes to investment and home prices by extraordinary and heavy-handed Federal Reserve interventions.
The simple and inescapable logic is that the bigger the boom that results from external interventions, then the bigger the bust when we eventually do return to normality, and investment prices are no longer being warped by the extraordinary interventions. Where this becomes particularly important is that there is a very reasonable chance that we could still just be getting started, and the peak of the boom - and the peak in asset prices could still be far above where we are right now.
A New Recession & Higher Heights
As has been the subject of widespread discussion in the financial media and as explored in recent analyses, it appears that there is a reasonable chance that the U.S. economy could enter another cycle of recession in the next 1-2 years. If this happens, then one possibility is that the Fed, lacking its traditional tools because of very low interest rate levels - could lose control at some point. The end result (and the path there could be quite messy) could be a return to more normal market conditions – and interest rates.
Should that happen, then we could see the losses explored in the previous section within the next several years, with crippling reductions in real estate, stock and bond prices that could be the new normal, absent further extraordinary interventions.
However, the Fed has no intention of letting this happen – not if they can possibly prevent it – and as explored in previous analyses, their intentions are to exit recession and contain crisis by using the most extraordinary interventions to date (if need be).
These include as a starting point, a quick return to zero percent short term interest rates, and an early and aggressive use of quantitative easing to purchase still more trillions of dollars of medium and long term Treasury debt, stacking a new QE on top of the old QE, and rapidly forcing down those rates as well. (And also conveniently funding exploding federal deficits with newly created money at far below normal market rates, as an entirely intentional side effect).
What this would do to the Wealth Function and how this could cause an explosion in asset prices was explored in detail in the previous chapter .

If we move from 3% to 1% as our compounding/discount rate, then one result would a drastic reduction in the ability to create wealth over the long term as the Wealth Function output for 30 years would fall to only 1.35. This means, as can be seen with the gold bars above, that the most reliable form of creating wealth over the long term would be cut by a full 95%, with $100 only creating $35 in new wealth over the next 30 years, instead of a more historically normal $661. ((1+.01)^30 = 1.35, $100 X 1.35 = $135)

On the other hand, dividing by that much smaller Wealth Function output would send the present value of future cash flows soaring (all else being equal and after economic and market recovery – if that happens). Assuming that markets stabilize at still lower interest rates, with Fed even farther away from being able to claw back to normality, than a cash flow 30 years out that is worth $13.10 in ordinary times would become worth, as seen above, an astounding $74.19, a full 80% above even today’s elevated levels. ($100 / 1.35 = $74.19)

Counterintuitive as it may sound, when we look at how increasingly powerful Federal Reserve interventions work at the bedrock level of investment valuations, the forcing down of discount rates to unprecedented lows in the attempt to contain crisis, could produce asset prices that are 178% of historic norms for cash flows ten years out, 317% of historic norms for cash flows 20 years out, and an astonishing 565% of historic norms for cash flows 30 years out.
These could be the highest investment valuations in history, for stocks, bonds and real estate – and they would not need to be fleeting, but could persist for years at a time, as we’ve seen with our more recent and smaller record highs. Many fortunes would likely be made in the process, and the money would be entirely real and spendable while it was there.
However, the higher that ever more fantastic and extraordinary Federal Reserve interventions would force asset prices – then the greater the fall when normal times did eventually return, whatever the particulars of the year or the means. Some might consider the losses shown in the gold bars below to be difficult to believe – but all they represent is the price of a return to the long term averages. A simple reversion to the mean.

If rates do go much lower as part of the containment of a future recession and crisis, and there is then a return to average interest rates, this would necessitate an 82% reduction in the values of all cash flows 30 years in the future. There would need to be a 68% loss for the values of cash flows 20 years in the future, and a 44% loss for cash flows 10 years in the future.
The price of going to levels well above even the elevated asset prices of today – for potentially years at a time – is that the losses associated with simply a return to average values, could grow in many cases from being crippling to being catastrophic. It could become the single defining financial event in many people’s lifetimes – particularly if they are retired or close to retirement, with few options for replacing the potentially stunning degree of losses.
Normal Business Cycle Losses Versus Permanent Losses
The above losses are based strictly on changes to the extraordinary interventions of the Fed with regard to the risk-free rate, and using QE to change term premiums (forcing long term interest rates to lower levels).
In contrast, normal business and market cycles usually involve changes in economic conditions, employment, corporate earnings and market psychology. As the economy, employment, earnings and investor psychology all fall together - markets can fall steeply, often in a 20% to 40% range if we are looking at stock indexes.
Sometimes we can see larger losses, as in 2009, and indexes can fall 50% or more. Times can appear bleak, but the good news is that we have seen this “nightfall” happen 34 times since 1854, and 34 times in a row - the sun has eventually risen again. The economy, employment, and corporate earnings do rebound, investor optimism returns, and the markets not only recover but eventually go higher than ever (helped by inflation, of course).
Many people take this for granted - losses will always rebound for the markets as a whole, and they may effectively bet their financial security on the mistaken belief this is necessarily true.
What was covered in this analysis and the preceding analysis was something quite different, and did not (directly) include such normal factors as the economy, employment, earnings and market psychology. In contrast, the potential 32% to 82% losses described herein, are based solely on changes to the Wealth Function input variable. It is based entirely on an ending of the extraordinary and unprecedented interventions by the Federal Reserve.
If we go from the current fantastic to the long term normal, then changes in the input variable would - all else being equal - create losses of 32% to 68% on the value of cash flows from any asset 10 to 30 years out, be it bonds, stocks or real estate.
If we have another round of recession, and it is contained (as planned) by even more extraordinary actions by the Fed with regard to interest rates and creating trillions of dollars out of the nothingness, and that then creates a new round of record asset prices (as explored in the previous analysis) - then we would be at still higher heights
And when the fantastic eventually failed - which could be a number of years from now - the change in the input variable of the exponential Wealth Function would be that much greater, and the fall - all else being equal - would now be from 44% to 82%, for the valuation of cash flows 10 to 30 years out, for bonds, stocks and real estate.
We have two quite distinct sources of losses - the normal 20% - 50% losses associated with economic and market cycles, and an additional 32% -82% percent loss for the value today of future cash flows returning to the normal range.
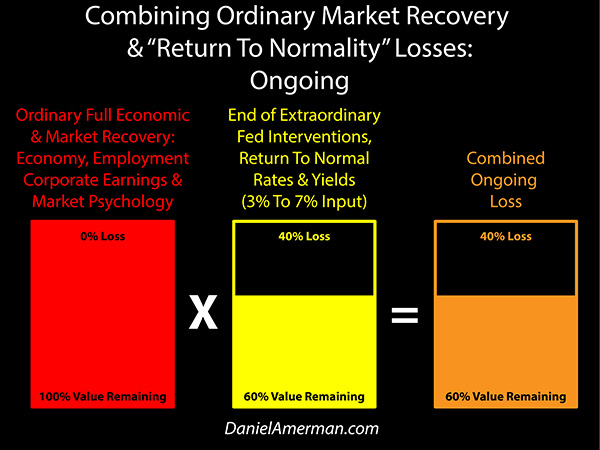
Total losses would be the multiple of the normal business and market cycle losses, times the losses from input variable of the Wealth Function returning to historic averages. (The actual equation would be (1 - normal losses) X (1 - Wealth Function losses) = remaining asset value).
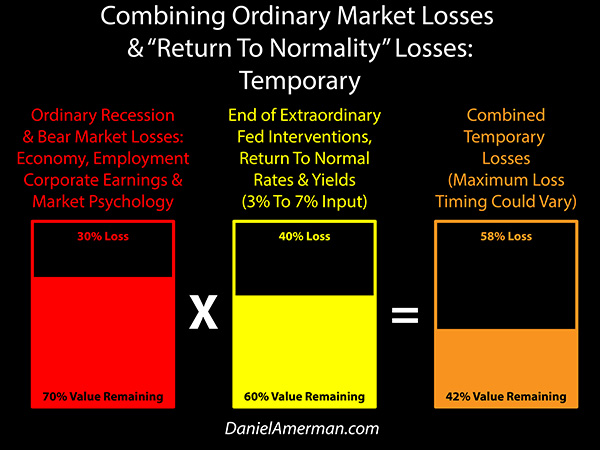
So if we lost 30% of investment values in a reasonably mild bear market due to changes in the economy, corporate earnings and market psychology, and our investment asset lost a distinctly different 40% due to an end of extraordinary Fed interventions and a return in normality, then we would need to multiply what is left after losses, by what is left after losses. We would have 70% left after ordinary cyclical market losses (100% - 30%), and we would multiply that times the 60% that is left when extraordinary Fed interventions no longer distort all asset values (100% - 40%), and that would mean that on a combined basis, we would have 42% left .
At the first level then, when we combine the two forms of losses, what was a 30% loss in an ordinary market, becomes a 58% loss, and that is serious. However it is the second level that is much worse.

With time and the next round of the long term economic and market cycles, then we would fully expect to recover the first 30% loss, as the economy, employment, earnings and investor psychology all rebounded. However, so long as the input variable to our Wealth Function remained in the historically average range - then the other 40% would never return.
So instead of a 30% temporary loss that eventually becomes a 0% loss, we would have a 58% loss that would with normal recovery remain a 40% loss on a “permanent“ basis. In total, even after the markets and economy recovered, we would still be off 40% on a permanent basis - unless the Federal Reserve were to return to the extraordinary and the fantastic with regard to monetary policy, quantitative easing, and the resulting changes to the input variable.
There is simply no reason for extraordinary gains that came from an outside source - extraordinary and heavy-handed interventions by the Federal Reserve - to return, unless such interventions were to return.
So with normality in the future, It would be a permanent loss for multiple asset classes (relative to the current unnatural heights), that could take many years to unwind via the combination of economic growth and inflation.
Paying Two Pipers
To get a more extreme example, let’s assume that there is another recession, and the “can is kicked down the road” via even more extreme interventions from the Fed. Let’s assume the containment of crisis is successful, the business cycle resumes, the economy eventually turns around - and the end result of record Fed interventions is record asset prices for stocks, bonds and real estate, well above even today’s elevated levels.
This could indeed be the one of the most profitable investment markets in history, and this could be particularly true for those who understand what is happening and why it is happening. It could persist for many years, and be one of the dominant events in a lifetime of investing.
But yet, history shows us that the time will come when the cycles will turn again, and if the containment is not successful that next time around, there will be not just one - but two pipers to be paid. One piper would be a crisis that could be much larger because it had been deferred, and for round numbers sake, let’s say for purposes of this illustration that it is a 60% market loss (not all that different from 2008-2009).
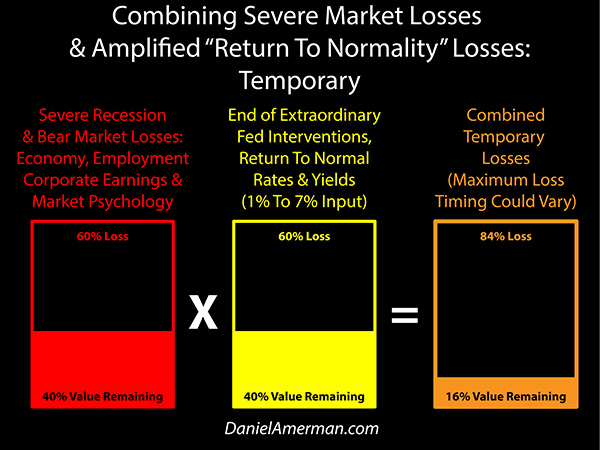
The other piper would be a collapse of even more extreme Federal Reserve interventions and distortions, and an eventual return to normality for rates of return and investment prices. For round numbers sake, let’s say the losses with this second piper are another 60%. Forty percent left after losses (100% - 60%), times 40% left after losses (100% - 60%), means that we are left with 16% of our value relative to the absolute peak valuation, which would be a staggering 84% loss for investors.
The cycles then progress, it takes longer than usual because of the depths of the deferred crisis, but the economy and markets eventually return to normality and a cycle of expansion - and our normal 60% loss disappears. We fully recover the normal side.
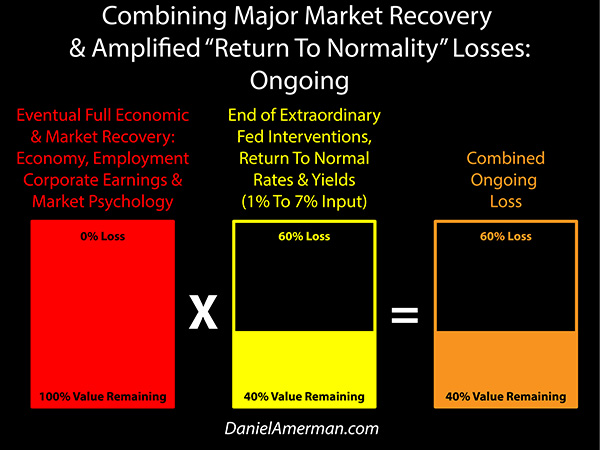
However, let’s also assume that the extraordinary interventions do not return, and given the depths of the pain, the nation swears off zero percent interest rates and financing deficits with trillions of dollars of created money for at least a generation or two. With no extraordinary interventions, and a simple return to long term historic averages, the 60% loss in investment valuations - compared to the distorted peaks - becomes permanent.
So paying two pipers instead of one, means that instead of a 60% loss that returns to 100% of valuations over time, there is an 84% loss that over time that becomes a 60% permanent loss (before inflation and economic growth).
Just to be clear, these are round number illustrations rather than projections, but what is being illustrated could be of critical importance. Indeed, whatever the specifics and the timing, the potential extraordinary move up - eventually followed by the potential extraordinary move down (perhaps many years later) - could end being the 1-2 sequence that defines standard of living and financial security for many millions of investors, particularly retirement investors.
The investment markets are not independent of unprecedented and heavy-handed Federal Reserve interventions, and when the Fed creates the historically fantastic in terms of zero percent (or negative) interest rates and creating trillions upon trillions of dollars out of the nothingness - then as explored in this series, it also sets the mathematical foundation for highly elevated asset prices. It creates the support for stock, bond and real estate prices that are entirely outside of and above the normal historical range. These valuations are not fleeting, but can persist for a decade or more - so long as the interventions persist for a decade or more.
However, the completely necessary flip side of this, is that if the extraordinary interventions that support the asset prices collapse or otherwise cease, then the mathematical basis for the elevated valuations would also collapse. This collapse would be separate from ordinary business and market cycle losses, it would be multiplicative if it occurred at the same time as an ordinary crisis, and it would be permanent - even after full economic and market recovery - unless there was another cycle of the extraordinary and the fantastic when it comes to market interventions by the Fed.
Cycles Of Amplified Gains & Losses
We are in a new place, with extraordinary Federal Reserve interventions leading to unprecedented new risks and opportunities for investors. Let me suggest that there are three particularly important considerations.
1) The new cycle of outside interventions has to date created record profits in multiple investment categories - including stocks, bonds and real estate - for reasons that are not part of traditional investment theory or financial planning. If we look at the Fed's plans for dealing with future recessions - this process could still just be getting started, the highest investment prices in history might still be ahead of us, and this situation could potentially last for years while appearing to be quite stable.

2) The new cycle of "deus ex machina" market interventions creates amplified losses at some points in the underlying business cycle, for reasons that are also not part of traditional investment theory or financial planning.

Because the source of the amplified investment prices and profits is extraordinarily powerful interventions by an outside agency (the Federal Reserve), the losses associated with the end of such outside interventions could be not only drastic, but could have a permanence that is completely outside of conventional financial planning assumptions, with potentially drastic consequences for millions of investors, particularly in retirement.

3) The amplified losses and amplified profits that result from these powerful new cycles are not random but can be at least partially anticipated in advance through understanding the double trap (of its own making) that the Federal Reserve is now caught in over the long term, and anticipating the market effects of the known strategies that the Fed has been using in the past and/or intends to use in the future.
Because I believe the Fed's increasingly heavy-handed interventions have created cycles of crisis and the containment of crisis which are very important for individuals to understand, I created the framework below to help explain how these new changes in the cycles can change investment category results at various stage in the cycles.
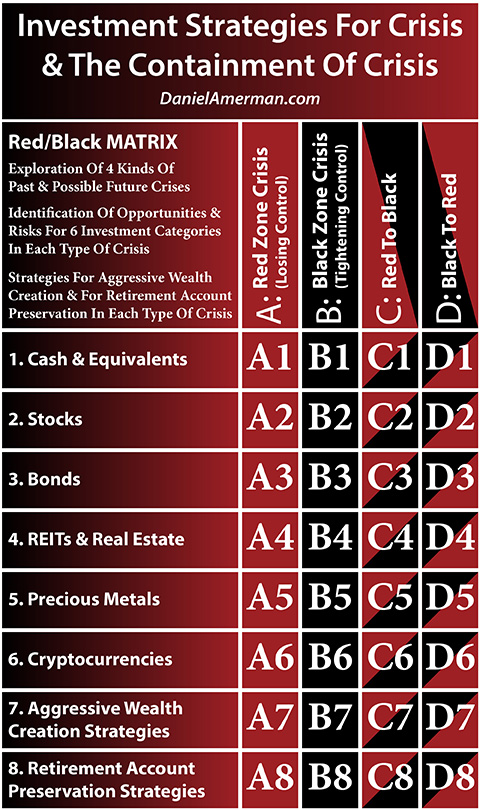
An explanatory analysis for the matrix is linked here.
This analysis is the first in this series to go to the first column, which is the all red “A” column. It shows what happens - all else being equal - if we completely exit the Black Zone containment of crisis, whether voluntarily or involuntarily.
So unlike the other three columns, there is no Black, no extraordinary interventions, we go to historic norms for the input variable, and the values of cash flows today - i.e. the prices of our investment assets - fall between 32% and 82% for cash flows between 10 to 30 years out.
Crucially, this analysis didn't assume anything extraordinary or frightening - no global economic collapse, or collapse of the U.S. monetary system, or new Great Depression. Instead, we just explored the implications of “average and average” - an average full recovery and a return to average interest rates with no quantitative easing. Such a return to average interest rates would produce a “miracle” of sorts for investors - a return to the miracle of compound interest creating reliable wealth, along with the benefits of compounding higher dividend payments and real estate cash flows.
However, there is only one function and one equation, and the results are necessary and indisputable.
When we run a return to financial normality through the Wealth Function, the result is a major and permanent decrease in asset values, until such times as they are offset by real increases in earnings, or real increases in real estate values, or by the most reliable source of all for increasing asset values - that of inflation.
Much of the household net worth of America today is based upon extraordinary and heavy-handed Federal Reserve interventions that have moved the Wealth Function range entirely outside the normal range - and as the necessary mathematical result, are supporting record asset valuations.
Each time that crisis threatens - we have a fork in the path. The crisis could contained - and the Fed will use every bit of its extraordinary powers to achieve that outcome. So long as the crisis is contained - or the string of crises - then we are in the "B" or "C" columns, and there are some potentially major profits to be earned along the way.
But yet, this has all been an experiment on the part of the Fed since the Financial Crisis of 2008. They have never actually done this before, in terms of containing another round of crisis from our current starting point, and there are numerous risks and pressures in play. If the experiment fails at some point, if the cycle breaks, and if the end result is a simple return to the investment pricing norms of most of our lifetimes - then there will likely be losses in the fall from our current or future artificial heights that are both larger and more permanent than what can be seen by looking at historic averages.
*******************************


