Why Is The Federal Deficit Really Falling?
By Daniel R Amerman CFA
There are two ways a nation can use economic growth to reduce budget deficits. The first method is to participate in economic growth, with a growing economy increasing tax collections. A second method is to raise taxes so drastically that they consume all economic growth.
The United States government recently announced it has some great news - a fast moving economic recovery is slashing the size of the deficit.
“Thanks to the tenacity of the American people and the determination of the private sector we are moving in the right direction,” Treasury Secretary Jacob J. Lew said in the report. “The United States has recovered faster than any other advanced economy, and our deficit today is less than half of what it was when President Obama first took office.”
In this analysis, using numbers directly from the White House Office of Management and Budget, we'll take an independent look at these assertions and see if they are supported by the data.
1) We will examine whether the source of the shrinking deficit is indeed rebounding economic growth, or whether the actual source is higher federal government taxes taking a greater share of the economy.
2) We will look at how much economic growth is left for the private sector after adjusting for the substantially higher tax take from the federal government.
3) We will adjust economic growth for inflation, and examine the surprisingly powerful impact of inflation and rising taxes working in combination when it comes to reducing non-governmental economic growth.
4) We will examine whether this is an anomaly, or is instead the result of fundamental factors that are likely to persist in the future in the United States and in other nations in similar situations.
5) We will consider the implications if the true rate of inflation were to be even slightly higher than the official rate of inflation.
6) We will explore the broad range of implications for investors.
Economic Growth vs. Growth In Federal Taxation
According to official US government figures, the federal deficit, after being fairly stable at just under a $1.3 trillion annual deficit in fiscal years 2010 and 2011, fell to a level of approximately $1.1 trillion for fiscal year 2012, and then dropped all the way down to $679 billion for fiscal year 2013. This is getting close to a 50% reduction in the federal deficit in the two years between fiscal years 2011 and 2013.
During this time in nominal dollar terms (not adjusted for inflation) the reported gross domestic product (GDP) of the United States rose from approximately $14.8 trillion to approximately $16.6 trillion.
In those same years, federal tax receipts rose from a little under $2.2 trillion in fiscal year 2010 up to almost $2.8 trillion in fiscal year 2013.
Now just eyeballing those two figures, it would appear that the federal tax receipts are jumping up faster on a percentage basis than the growth in the economy. Is that indeed the case, and how great is the differential?
(click here to see the supporting calculations)
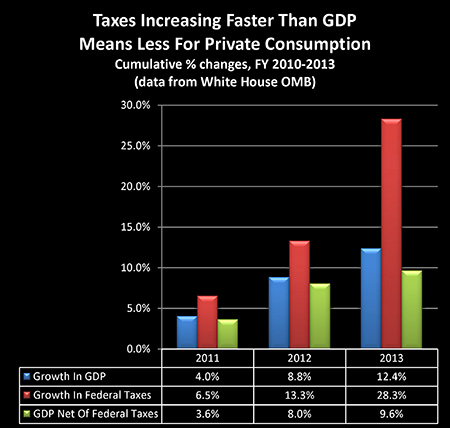
As shown in the blue bars in the graph as well as the percentages in the table, the United States economy grew 4% between 2010 and 2011, it cumulatively grew 8.8% by 2012, and grew a total of 12.4% by 2013.
Now what is fascinating is when we look at the red bars, which are the cumulative percentage growth in federal tax receipts.
Per the government's figures, the economy grew by 4% in 2011 – but federal taxes grew by 6.5%.
In over two years between 2010 and 2012, the economy grew by 8.8% – but federal taxes grew by 13.3%.
And most remarkably, taking into account the sharp increase in taxes that took place at the end of the 2012 calendar year, while the US economy cumulatively grew by 12.4% between 2010 and 2013 – federal tax receipts grew by 28.3%.
The graph – and the underlying numbers – are unmistakable.
Federal tax receipts are growing at a much faster rate than the economy itself.
So to understand exactly why it is that the deficit has been falling so sharply – it is because the government is taking significantly more of the economy than it previously was.
Determining Growth Not Consumed By Taxes
Another approach is to look at how much economic growth is left for the private sector once we adjust for increasing federal tax revenues. While a somewhat unconventional measure, this could also be called one of the most crucial measures of all. Because obviously, the more the federal government takes, the less that is available for everyone else.
And if federal tax receipts are rising at rate that is greater than overall economic growth, then the share of the economy available for the private sector must necessarily be growing at a rate that's less than the overall rate of economic growth.
So if we look at the first year between 2010 and 2011, if gross economic growth was 4% (the blue bar), but the federal government's take from the economy rose by 6.5% (the red bar), that means that only 3.6% in growth (the green bar) was available for the rest of us.
Where things become dramatic is when we look at our three years of cumulative growth between 2010 and 2013.
The economy grew by 12.4%, but federal tax receipts jumped up by 28.3%, leaving only 9.6% available for the rest of the country.
How Inflation Changes The Picture
Now an issue with looking only at gross economic growth is that it does not take into account the destruction of a currency's purchasing power. That is, if we just look at GDP, we're not necessarily looking at economic growth, but may actually just be looking at the effects of inflation.
So what is routinely done is to adjust GDP for inflation through the use of a GDP price deflator. And when we do so here, we find that much of our economic growth disappears.
(click here to see the supporting calculations)
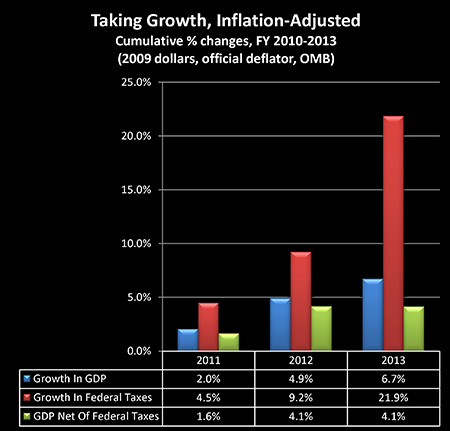
Adjusted for inflation, GDP is now up only 2% through 2011, 4.9% through 2012, and 6.7% through 2013.
For the next step, in order to keep an exact "apples to apples" comparison, we took the same GDP price deflator and applied it to federal tax receipts. This ensures that federal taxes get exactly the same inflation adjustments as what is being applied to gross domestic product.
Adjusting for inflation, we find that federal tax revenues grew by 4.5% in the first year, by 9.2% over two years, and by 21.9% over three years.
So we see a far more dramatic difference between the growth in the economy and the growth in taxes. We go from government tax rates increasing at a rate of a little more than twice the growth of GDP in nominal terms (28.3% to 12.4%), to inflation-adjusted taxes growing at more than three times the rate of inflation-adjusted growth in GDP (21.9% to 6.7%).
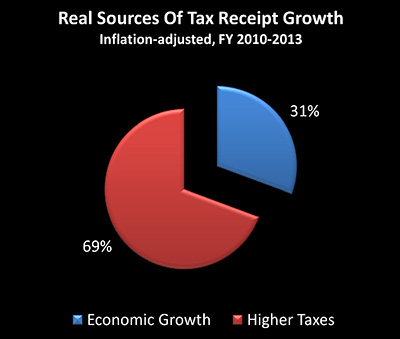
The real economy (if we accept official US government inflation rates) grew by only 6.7% over three years, while the federal government's real take of that economy rose by a remarkable 21.9%. Because 6.7% in economic growth is only equal to 31% of the total 21.9% increase in tax revenues, this means that economic growth only accounted for 31% of real tax growth, while it was the increase in tax rates that generated the other 69%.
So while the reduction in deficit is being presented as increased revenues from a surging economy, in fact more than 2/3 of the growth in tax receipts was simply from raising taxes.
Real Private Sector Growth
The next crucial step involves looking at inflation-adjusted GDP and subtracting inflation-adjusted federal taxes, which together determine the real bottom line of what is available for the rest of us.
Net of the increase in federal taxes, real economic growth was 1.6% in 2011, it was 4.1% cumulatively over two years in 2012, and – this is where things get really interesting – our after-federal tax and after-inflation GDP stayed at 4.1% during fiscal year 2013, the very year of the drastic reduction in the deficit.
After federal taxes the real economy cumulatively grew by 4.1% in the two years through 2012, but total growth was still only a cumulative 4.1% in the three years through 2013. That is because all growth in real GDP in 2013 was consumed by higher federal taxes alone. (Including increases in state and local tax collections would just reduce what is available for the private sector that much more.)
So to place a little more accuracy on the press releases, it wasn't a surging economy that reduced the deficit from $1.1 trillion in 2012 to $659 billion in 2013. Instead it was the federal government taking 100% of real economic growth for the nation that so dramatically reduced the deficit in 2013. And because this redistribution of the economy from the private side to the federal government is the result of tax code changes, it is not a one-time occurrence, but will continue to persist with each passing year.
The "Crowding Out" Of Private Economic Growth
What has happened over the last three fiscal years is in reality not only quite different from what is being publicly presented – but it was also entirely predictable given the constraints facing the government.
In 2010 – the starting year for this analysis – I first published an article (since updated and available here) titled "High Government Deficits "Crowd Out" Stock Market Returns", in which I made the case that we should anticipate that because an aging population meant an increasing percentage of people would be receiving retirement benefits each year – that combined with other rising transfer payments, the percentage of the economy consumed by the federal government must rise.
This is just common sense. There is only so much total economic growth available. And if the government's share of that economic growth is rising at a rate higher than total economic growth – then economic growth in the private sector must be falling relative to total economic growth.
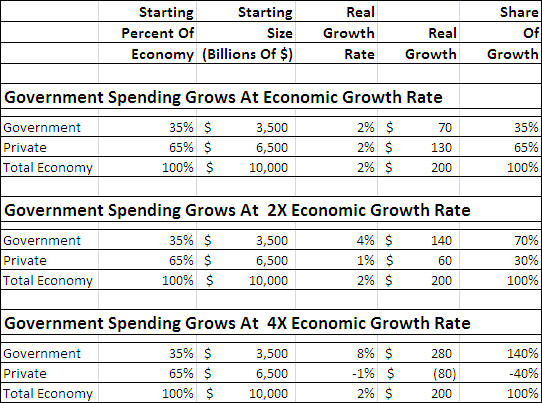
Indeed, as shown in the chart and developed in much more detail in the linked article originally from 2010, this anticipated increase in government spending must necessarily be matched by a decrease in private dollars available for consumption, standard of living and investment growth for the rest of us.
But it is somehow not taken into account in either government press releases or in most mainstream financial analyses of expected investment performance. If it were, and the public better understood these fundamental relationships, there would be a demand for major changes in the most common investment strategies.
Now of significant note is that whereas this 2010-2013 analysis focuses only on federal tax receipts, the above chart from 2010 (and the article, "Crowding Out") factors in state and local government taxes as well. And the more levels of government that are included, the lower the governmental spending growth rate that is needed to consume all private sector economic growth.
Tweaking Inflation Rates
An important related question to consider is whether we accept the current quite low official government rates of inflation.
If you find that your personal expenditures for such things as grocery store food, restaurants, gasoline, utilities, college education, and healthcare are increasing at a rate in excess of the official 1.5% or 2% per year, then the effect on you is much greater than what is shown here.
If a higher rate of inflation is what you are personally experiencing, and is even 1.5% greater than the official rate used herein – then most certainly no real growth occurred in the economy in after-inflation and after-federal tax terms for all three years between 2010 and 2013. We would still have had positive growth in the overall economy (so long as the true rate were less than 2.3% above the official rate), but every bit of the economic growth would've been consumed by the government in spending – and in partially closing the deficit.
Leaving no growth whatsoever for the overall private sector.
Another issue affecting results is that official deficits are based on government accounting, which is politically designed to allow the government to report lower deficits. Apply the same type of accounting used by private corporations and individuals, then as has been widely reported (including here), government deficits soar far beyond what the federal government indicates, and the situation is even more extreme when it comes to the share of the future economy that will be taken by the government.
While the limited goal in this one analysis has been to "truth test" the government's recent optimistic assertion – through using only the government's own numbers – those three additional factors of a likely higher real rate of inflation, the inclusion of state & local government taxes, and the use of governmental accounting need to be at least considered as well. Relatively small movements in any one of these categories are sufficient to entirely consume the slim 4.1% after-inflation and after-tax increase in the private sector over the three fiscal years from 2010 to 2013.
Investment Implications
As my long-time readers know, for many years now I've been advocating an approach to preparing for the future which is not mainstream, but neither is it "gloom and doom" – it is just common sense and reality-based.
As I've long been pointing out as a basic matter of demographics in the United States (and many other nations), the simple fact is that we have an aging population that has been promised expensive retirement benefits, and this means that the government's share of the economy is likely to be steadily rising.
If the government is taking steadily more of the economy, that leaves steadily less of the economy available for private consumption and private growth. And slashing private growth rates slashes the wealth that can be created by private investments.
And if an aging population by itself translates to a lower overall economic growth rate – as many economists believe – that exacerbates the problem.
Moreover, if we accept the historical evidence that deeply indebted nations usually experience lower overall economic growth rates – that further exacerbates the problem.
However, that does not mean that this will all take a highly dramatic form. Nor is there any more reason to believe it will dominate the headlines five or ten years from now, just as it isn't appearing in the headlines right now. Instead, it is likely to be more of a slow but nonetheless irresistible background force, which in the interests of the government and most of the investment industry, the majority of the public will neither be aware of nor understand.
The heart of the issue for investors is that all across the nation – and in analogous situations in other nations – we're being told that if we invest in stocks we will benefit from the growth in the economy on a predictable basis based upon decades of past performance.
However, as total stock returns are the combination of dividends and capital gains – and because dividends are currently quite low by historical standards – this means that capital gains in the years ahead will need to be unusually high if stocks are to perform at historical levels. And given that the primary driver of capital gains for the market over time is supposed to be economic growth, this means that economic growth will in turn need to be unusually high if historic stock returns are to be delivered.
Meanwhile, deficits are being lowered and the government is being funded by appropriating a disproportionate share of that economic growth.
Which means that disproportionately less is available for private investors.
Which naturally should be expected to substantially reduce many investment returns over the longer term.
Another crucial issue is, as my readers know, that economic growth is not the only place where the government is effectively competing with investors for resources.
That is, the biggest reason that the deficit is now below $1 trillion is that interest rates are by historical standards very, very low. If interest rates were to go up substantially – then the deficit explodes.
Therefore, as previously covered in other analyses here and here, the federal government has an overwhelming motivation to keep interest rates very low. The efforts that a deeply indebted and financially stressed government makes to keep interest rates low – suppress interest rates for the entire nation.
In other words, the interests of the government are in some crucial ways in direct competition with the interests of traditional long-term investors when it comes to interest rates, as well as who gets to keep what economic growth there is. What helps hold deficits down are low interest rates, which simultaneously reduce interest payments to investors from bonds, annuities, CDs and money market funds.
So when we look at both stocks and bonds, the two traditional legs that long-term investing in general and retirement investing in particular are usually based upon, in both cases because we are investing for an environment where an already deeply indebted government must pay for new expenditures that are rising at a rate faster than the economy as a whole, we are likely to be outcompeted by the government for yield with both stocks and bonds.
This is not necessarily about gloom and doom, nor is it end-of-the-world talk – this is simply the reality of an aging population with slowing growth rates.
Unfortunately, most investors are not basing their strategies on this reality. Instead they are being encouraged to invest for a future that consists of the past endlessly repeating itself, with stocks and bonds delivering yields over the decades much like they did in the 20th century.
In other words, implicitly they are investing for a world which has two economies. There is one economy that is increasingly dominated by the government, which is consuming economic growth even while suppressing interest rates. And then there is that second economy of blue skies and clear sailing, where investments reliably deliver results like they did in days long gone by.
But given that there is only one economy, this quite common approach of investing for the past may perform very badly indeed in a future of much lower private sector growth and low interest rates.
There are alternative approaches, however. Which begin with accepting that the present and the future are different from the past, and quite likely to continue to be so. Which means that everything changes when it comes to finding the best strategies.
Risks, returns and opportunities are very different in government-dominated economies – and positive results can become much more difficult to obtain. Which strongly increases the benefits of understanding this new environment.
 What you have just read is an "eye-opener" about just one of the ways in which a rapidly shifting world is removing the foundations beneath conventional investing - even while most investors continue to follow the traditional strategies, unware of just how much the financial playing field has changed.
 A personal retirement "eye-opener" linked here shows how the government's actions to reduce interest payments on the national debt can reduce retirement investment wealth accumulation by 95% over thirty years, and how the government is reducing standards of living for those already retired by almost 50%.
 An "eye-opener" tutorial of a quite different kind is linked here, and it shows how governments use inflation and the tax code to take wealth from unknowing precious metals investors, so that the higher inflation goes, and the higher precious metals prices climb - the more of the investor's net worth ends up with the government.
 Another "eye-opener" tutorial is linked here, and it shows how governments can use the 1-2 combination of their control over both interest rates and inflation to take wealth from unsuspecting private savers in order to pay down massive public debts.


If you find these "eye-openers" to be interesting and useful, there is an entire free book of them available here, including many that are only in the book. The advantage to the book is that the tutorials can build on each other, so that in combination we can find ways of defending ourselves, and even learn how to position ourselves to benefit from the hidden redistributions of wealth.


