
The Patterns Of Social Security Purchasing Power & Quality Of Life In Retirement (Series Overview)
By Daniel R. Amerman, CFA
TweetSocial Security has only "partial inflation indexing" - and those three words may dominate standards of living in retirement for many millions of people for decades.
This groundbreaking series of financial analyses provides easy to understand explanations of what is happening and why. As each stage is developed, visual patterns provide the needed information in an intuitively understandable form.
The Social Security Inflation Lag Calendar - Partial Indexing Part 1
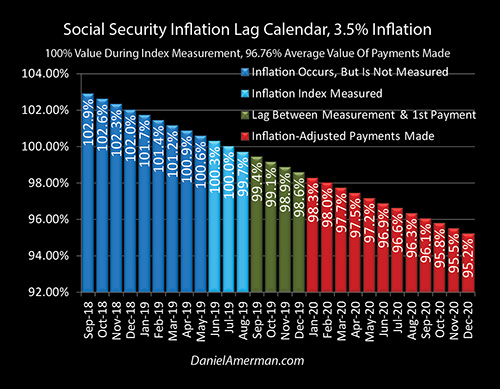
There are two distinct forms of inflation lags as explored in the Part 1 analysis which is linked here. We have the lag between when inflation is measured (the light blue bars) and when the first payment based upon that measurement is actually made (the red bars).
And then on top of that we have a steadily decreasing purchasing power for each benefit over the course of the year which with historically average inflation means that the December benefits are likely to have a purchasing power of only 95 cents on the dollar.
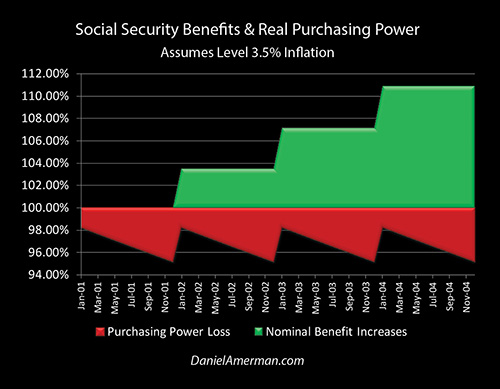
Using the twin lags, we develop the first of our patterns that will govern standard of living in retirement, those of the green stair step pattern of nominal annual benefit increases to keep up with inflation, and the red "saw-tooth" pattern of actual purchasing power.
Out Of Money By December 12th - Social Security Partial Inflation Indexing Part 2
In Part 2 of this series of analyses as linked here, we moved from long-term averages to what has been happening in recent years.
We've had a much lower government reported inflation rate and we've had much lower benefit increases. Crucially, we've also had a mismatch between the benefit increases as determined by the government using its detailed methodology with the CPI-W index, and what the government reports to be average inflation for the nation with the CPI-U index.
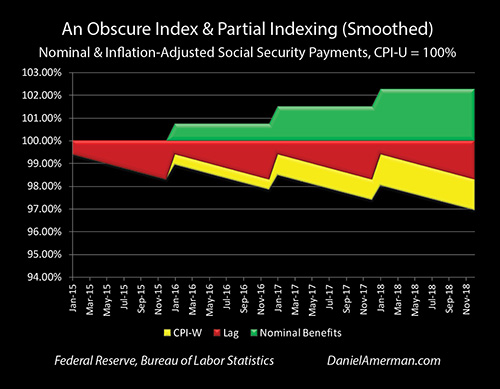
Even the minor mismatch between indexes is enough to produce the yellow pattern of lost purchasing power lost for the nation as a whole in terms of retirees who are relying upon Social Security, or other retirees such as federal government employees who are receiving their own inflation indexed payments.
Out Of Money By November 29th - Social Security Indexing Part 3
For the third analysis as linked here, we move to the future and explore the long-term implications of historically average inflation, and a minor 0.60% annual mismatch between Social Security benefit increases, and the actual growth rate of retiree expenses.
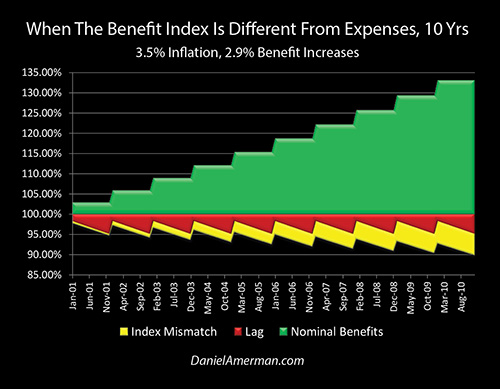
This produces a larger red saw-tooth pattern of inflation lag losses, and a significant increase in the area of the downward yellow zigzag pattern of purchasing power losses.
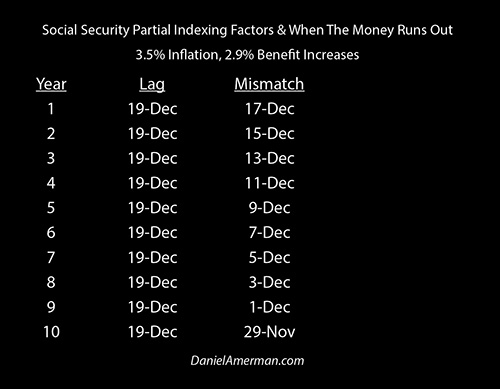
As developed in the analysis, these two seemingly minor real world considerations can on a combined basis consume one month of the purchasing power of Social Security in the span of ten years. This subtle but steady process can place the retirees of an entire nation in the place where they have only 11 months of purchasing power compared to today, but still have 12 full months of expenses to pay.
These purchasing power shortfalls can have a dominant impact on actual standards of living in retirement. Fully understanding and preparing for these subtle but critical issues can also lead to major changes in the financial planning process.
The Critical Impact Of Medicare Premiums On Social Security Inflation Indexing (Part 4)
The Part 4 analysis which is linked here, explores what could be called a somewhat ironic generational knowledge mismatch, when it comes to how Social Security actually works. On the one hand we have tens of millions of people in their 40s, 50s and early 60s who are earnestly making retirement plans based on the common assumption of the full inflation indexing of Social Security benefits.
On the other hand we have many millions of people in their late 60s and older who are actually collecting Social Security benefits while paying Medicare premiums - and they understand full well what a poor joke the inflation indexing of Social Security has been in practice in recent years.
When we take into account that the very small increases in Social Security benefits in recent years have been almost entirely consumed by the increases in Medicare Part B premiums, then we get the realities of the patterns below. (This is based on the very low reported inflation rates and benefit increases of recent years as covered in the Part 2 analysis, rather than the long term averages of Part 3.)
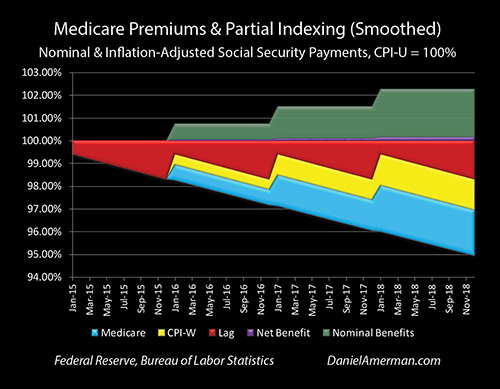
The green stair step of benefit increases becomes semi-transparent - because the cash never reaches most recipients, not when the withholding of Medicare premiums is taken into account. Instead there is the purple area of net increases in benefits after Medicare deductions, which is very hard to see - and this is accurate because it very hard to see what has been on average only a $2 increase that takes place over three years.
This almost complete lack of inflation indexing in practice produces the blue area of purchasing power losses when Medicare premiums are taken into account, and this pattern moves downwards in an almost straight line.
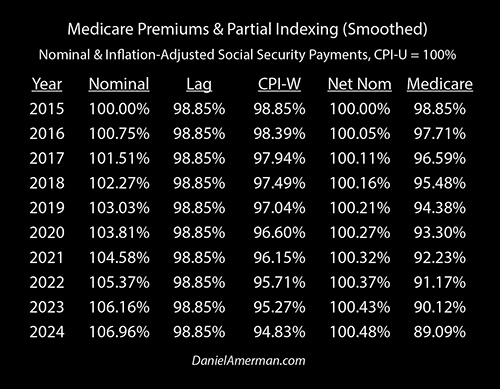
While it has received little coverage, the average Social Security recipient has on a smoothed basis lost two weeks of purchasing power just between 2015 and 2017. If current trend lines continue and we extrapolate the recent past into the future, then 3 weeks of purchasing power will be lost by 2019, 4 weeks by 2021, and by 2024 the average retiree will have only about 46 weeks of purchasing power to cover 52 weeks of expenses (relative to 2015).
What the Part 3 & 4 analyses cover is two quite different ways where the nation can lose a month of net Social Security purchasing power within the next ten years.
Medicare Premiums Are A Shared Pool - Eight Coming Changes That Will Transform Retirement (Social Security Indexing Part 5)
A critical component of financial planning for retirement is that many healthcare expenses are a shared expense for those 65 and older, as a matter of current law and design. A 65 year old pays the same Medicare Part B premiums as a 95 year old, and someone in perfect health pays the same premiums as someone with multiple serious health issues.
Anyone who is in Medicare is participating in a shared pool, via the amount of their premiums. And if the characteristics of the other people in the pool change in such a way that average expenses rise - then everyone shares in that rise through increases in the size of their premiums, and the resulting decreases in the standard of living that can be supported by Social Security net of Medicare.
The coming increases in Medicare premiums are not fundamentally just an inflation index mismatch issue - but rather that is only one of eight major problems. Entirely aside from whatever the future rate of inflation may be - there are other fundamental factors in play created by the aging of the Boomers that are expected to change the "pool", and to substantially increase the average expenses of that pool in the coming years and decades.
There is also the critically important consideration that the "hold harmless" provision of Social Security means that the division of shared and rising medical expenses is not equal within the pool. As explored in the Part 5 analysis, this factor itself can be enough to change many retirement decisions. Unfortunately, many people are volunteering to potentially pay excess Medicare premium increases for other people in the pool for up to five years - without realizing they are doing so.
Thinking through the implications of being in a shared pool where the sharing is unequal may sound like an unusual perspective on how to make better retirement decisions - but it is a governing reality over the long term.
Using Personal Math Instead Of Abstract Theory To Make Better Retirement Decisions
When it comes to financial analysis, the person who controls the assumptions can also be the person who controls the results. So, if someone is relying on the advice of an authority to help them make an important personal financial decision - they are also necessarily relying on that person's assumptions.
Based on some simplifying assumptions, academic researchers have generally concluded that there is a strong incentive for most people to defer claiming Social Security benefits, with waiting until age 70 being common advice. These analyses have been widely publicized in the financial media, and have become what is treated as the conventional wisdom. However, as explored in this analysis, the conventional wisdom is based upon the assumptions of:
1) Perfect Payment Reliability. Every payment will be received in full under the current Social Security regulations, with no modifications or reductions whatsoever, and this will remain true no matter how many years we look into the future.
2) Perfect Inflation Indexing. The annual benefit increases will always exactly equal the rate of inflation and will increase the cash flow in such a way that purchasing power is perfectly maintained, no matter how far in the future we go, or what rates of inflation are experienced in practice.
3) Ignoring Medicare premiums. The financial impact of Medicare premiums and the interrelationship between Social Security and Medicare for beneficiaries are not taken into account.
As explored in this analysis, if you disagree with any of the those assumptions, then the personal math you should use for making Social Security decisions also necessarily changes, and simply accepting the conventional wisdom could be a big mistake for your personal beliefs and circumstances.
How The National Debt, Interest Rates, & Inflation Can Change Investment Outcomes (Series Overview)
The United States government is heavily in debt, and is going still deeper into debt as the result of high annual deficits. As explored in this series of timely analyses, the large and climbing national debt is likely to powerfully impact future interest rates and inflation.
When we look at future stock prices, or bond prices, or real estate prices - interest rates and inflation will be of crucial importance. The relationships and timing identified in the series linked here have critical implications for the price paths that may be traveled by all the major asset classes in the short, medium and long term.
 What you have just read is an "eye-opener" financial analysis about critically important retirement decisions, and how they can change when we take a holistic look at the future.
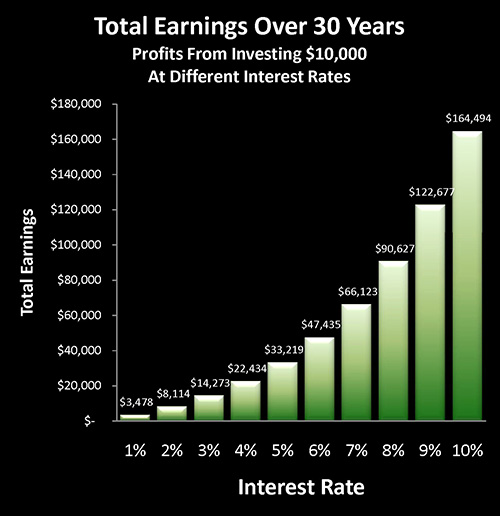
Retirement lifestyle is determined by both benefits and savings. Linked here is a related "eye-opener" that shows how the government's suppressing interest rates can reduce retirement investment wealth accumulation by 95% over thirty years, and how low interest rate policies are profoundly reducing standards of living for those already retired.
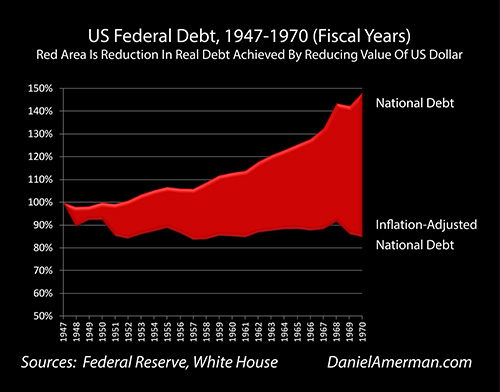
National debts have been reduced many times in many nations ─ and each time the lives of the citizens have changed. The "eye-opener" linked here reviews four traditional methods that can each change your daily life, and explores how governments use your personal savings to pay down their debts in a manner which is invisible to almost all voters.
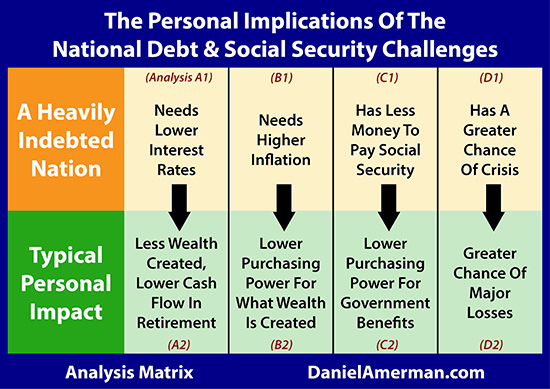
The U.S. national debt is likely to change our daily lives in multiple ways over the coming decades, some of which are little understood by savers and investors. As shown in the first row of analyses in the matrix which is linked here, heavily indebted nations have major challenges when it comes to interest rates, inflation, financial stability and the ability to make Social Security and Medicare payments in full. As is examined in the second row of analyses, each of those national challenges can directly translate to life-changing personal challenges as well.


If you find these "eye-openers" to be interesting and useful, there is an entire free book of them available here, including many that are only in the book. The advantage to the book is that the tutorials can build on each other, so that in combination we can find ways of defending ourselves, and even learn how to position ourselves to benefit from the hidden redistributions of wealth.